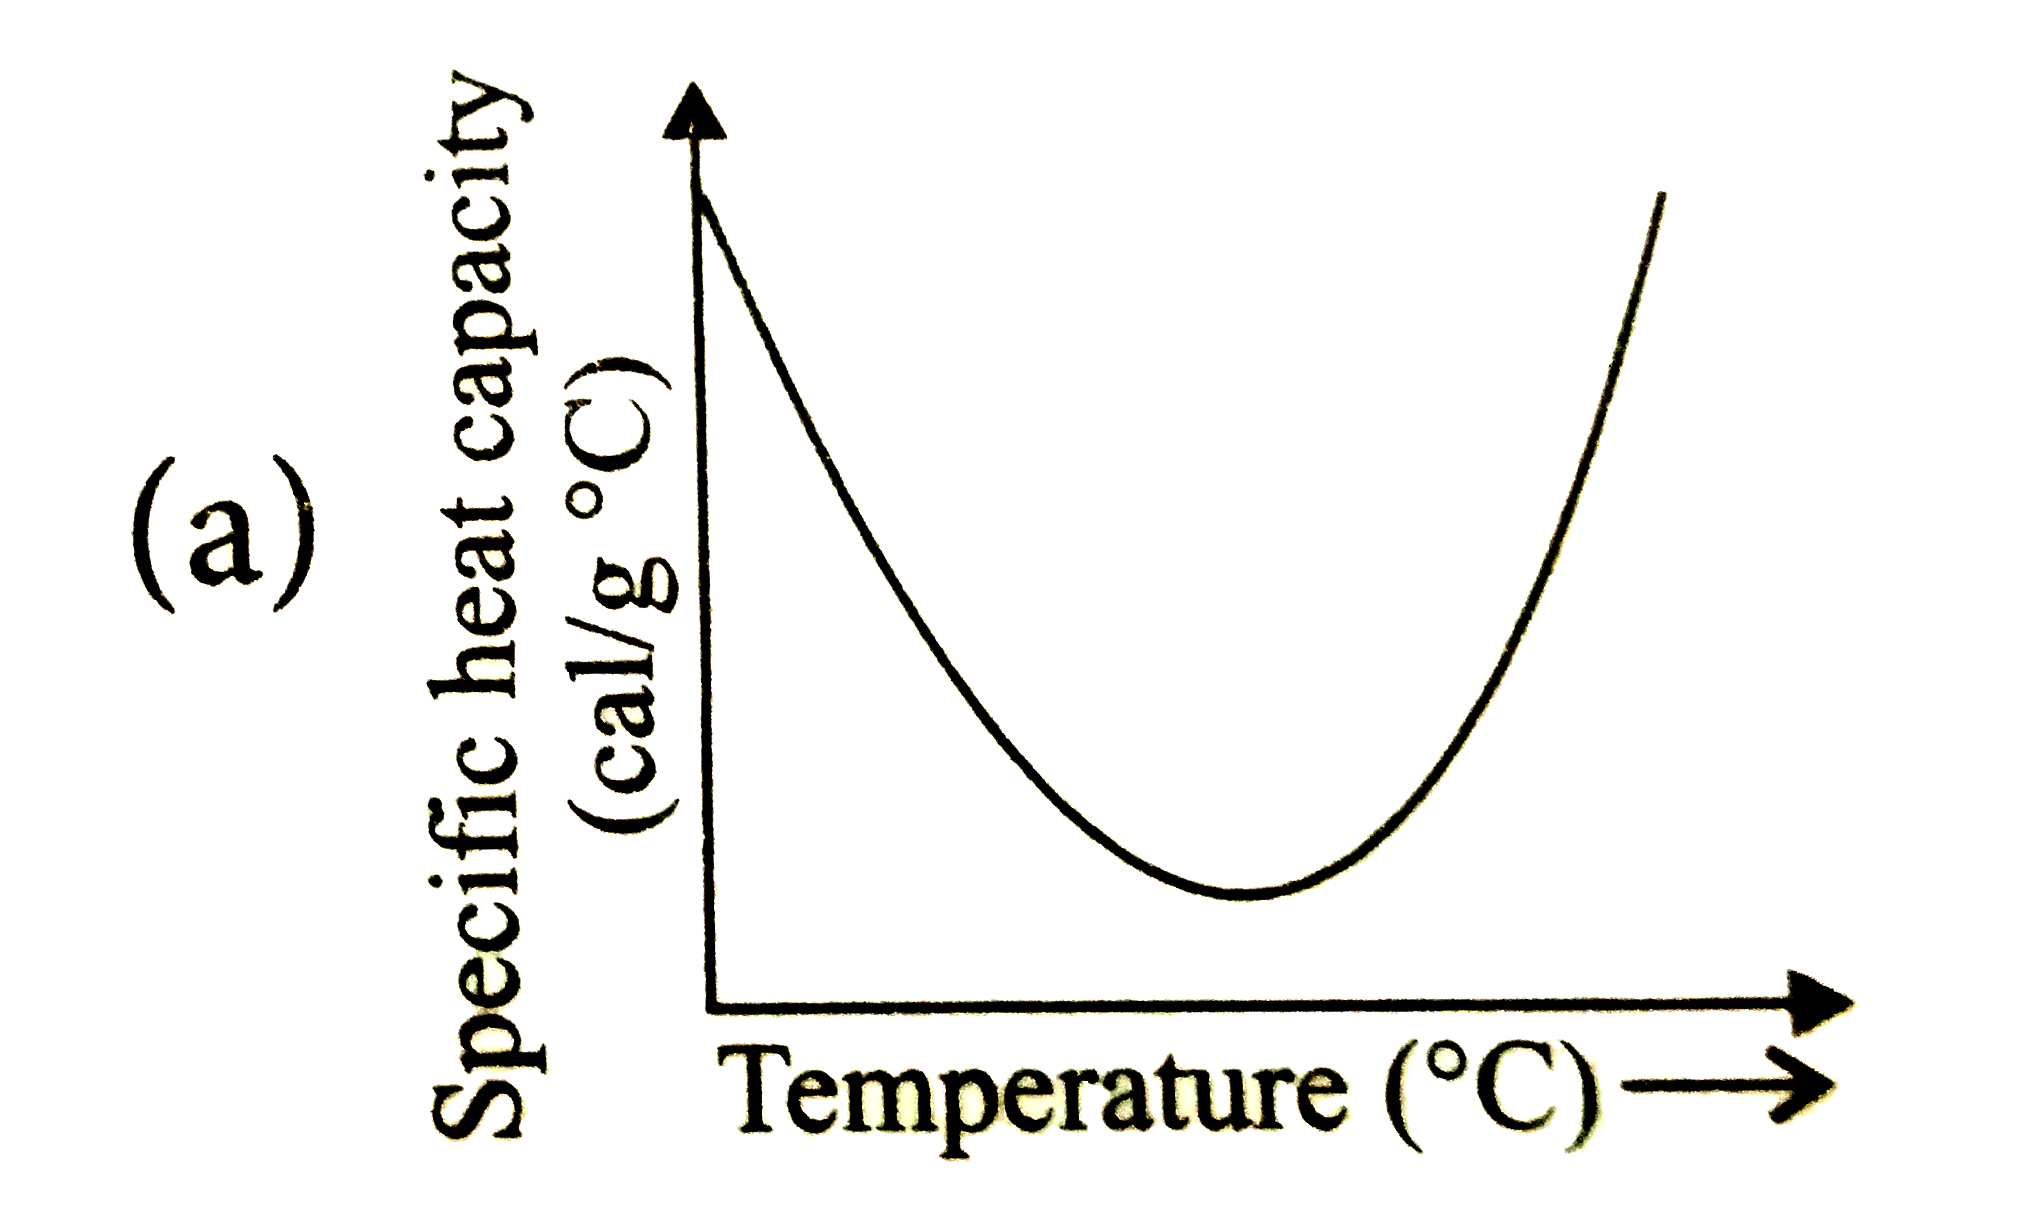
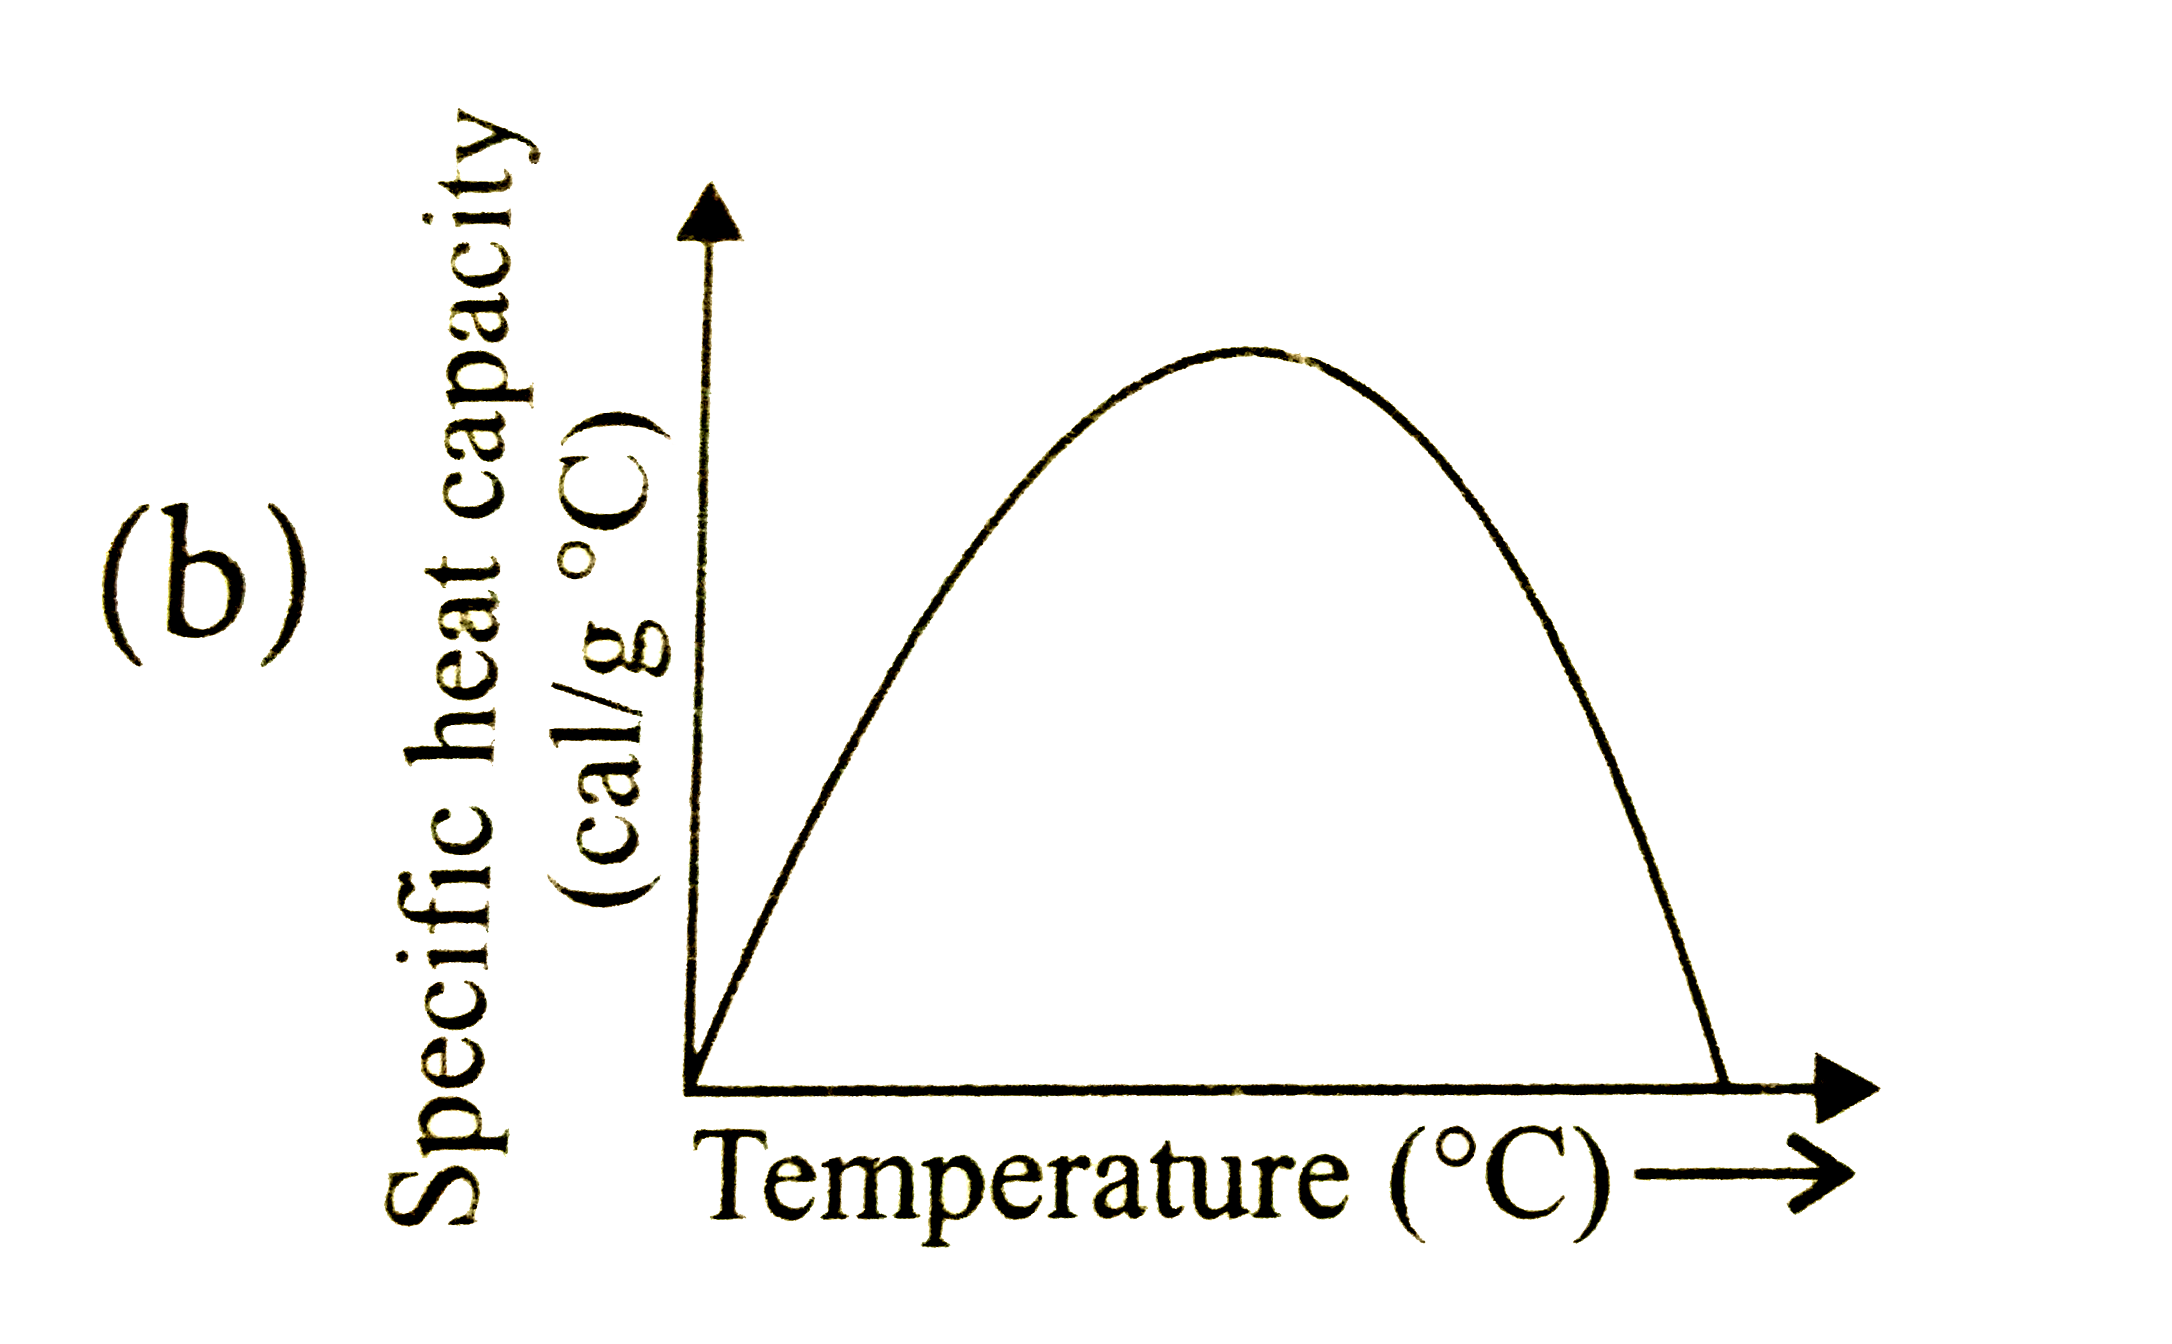
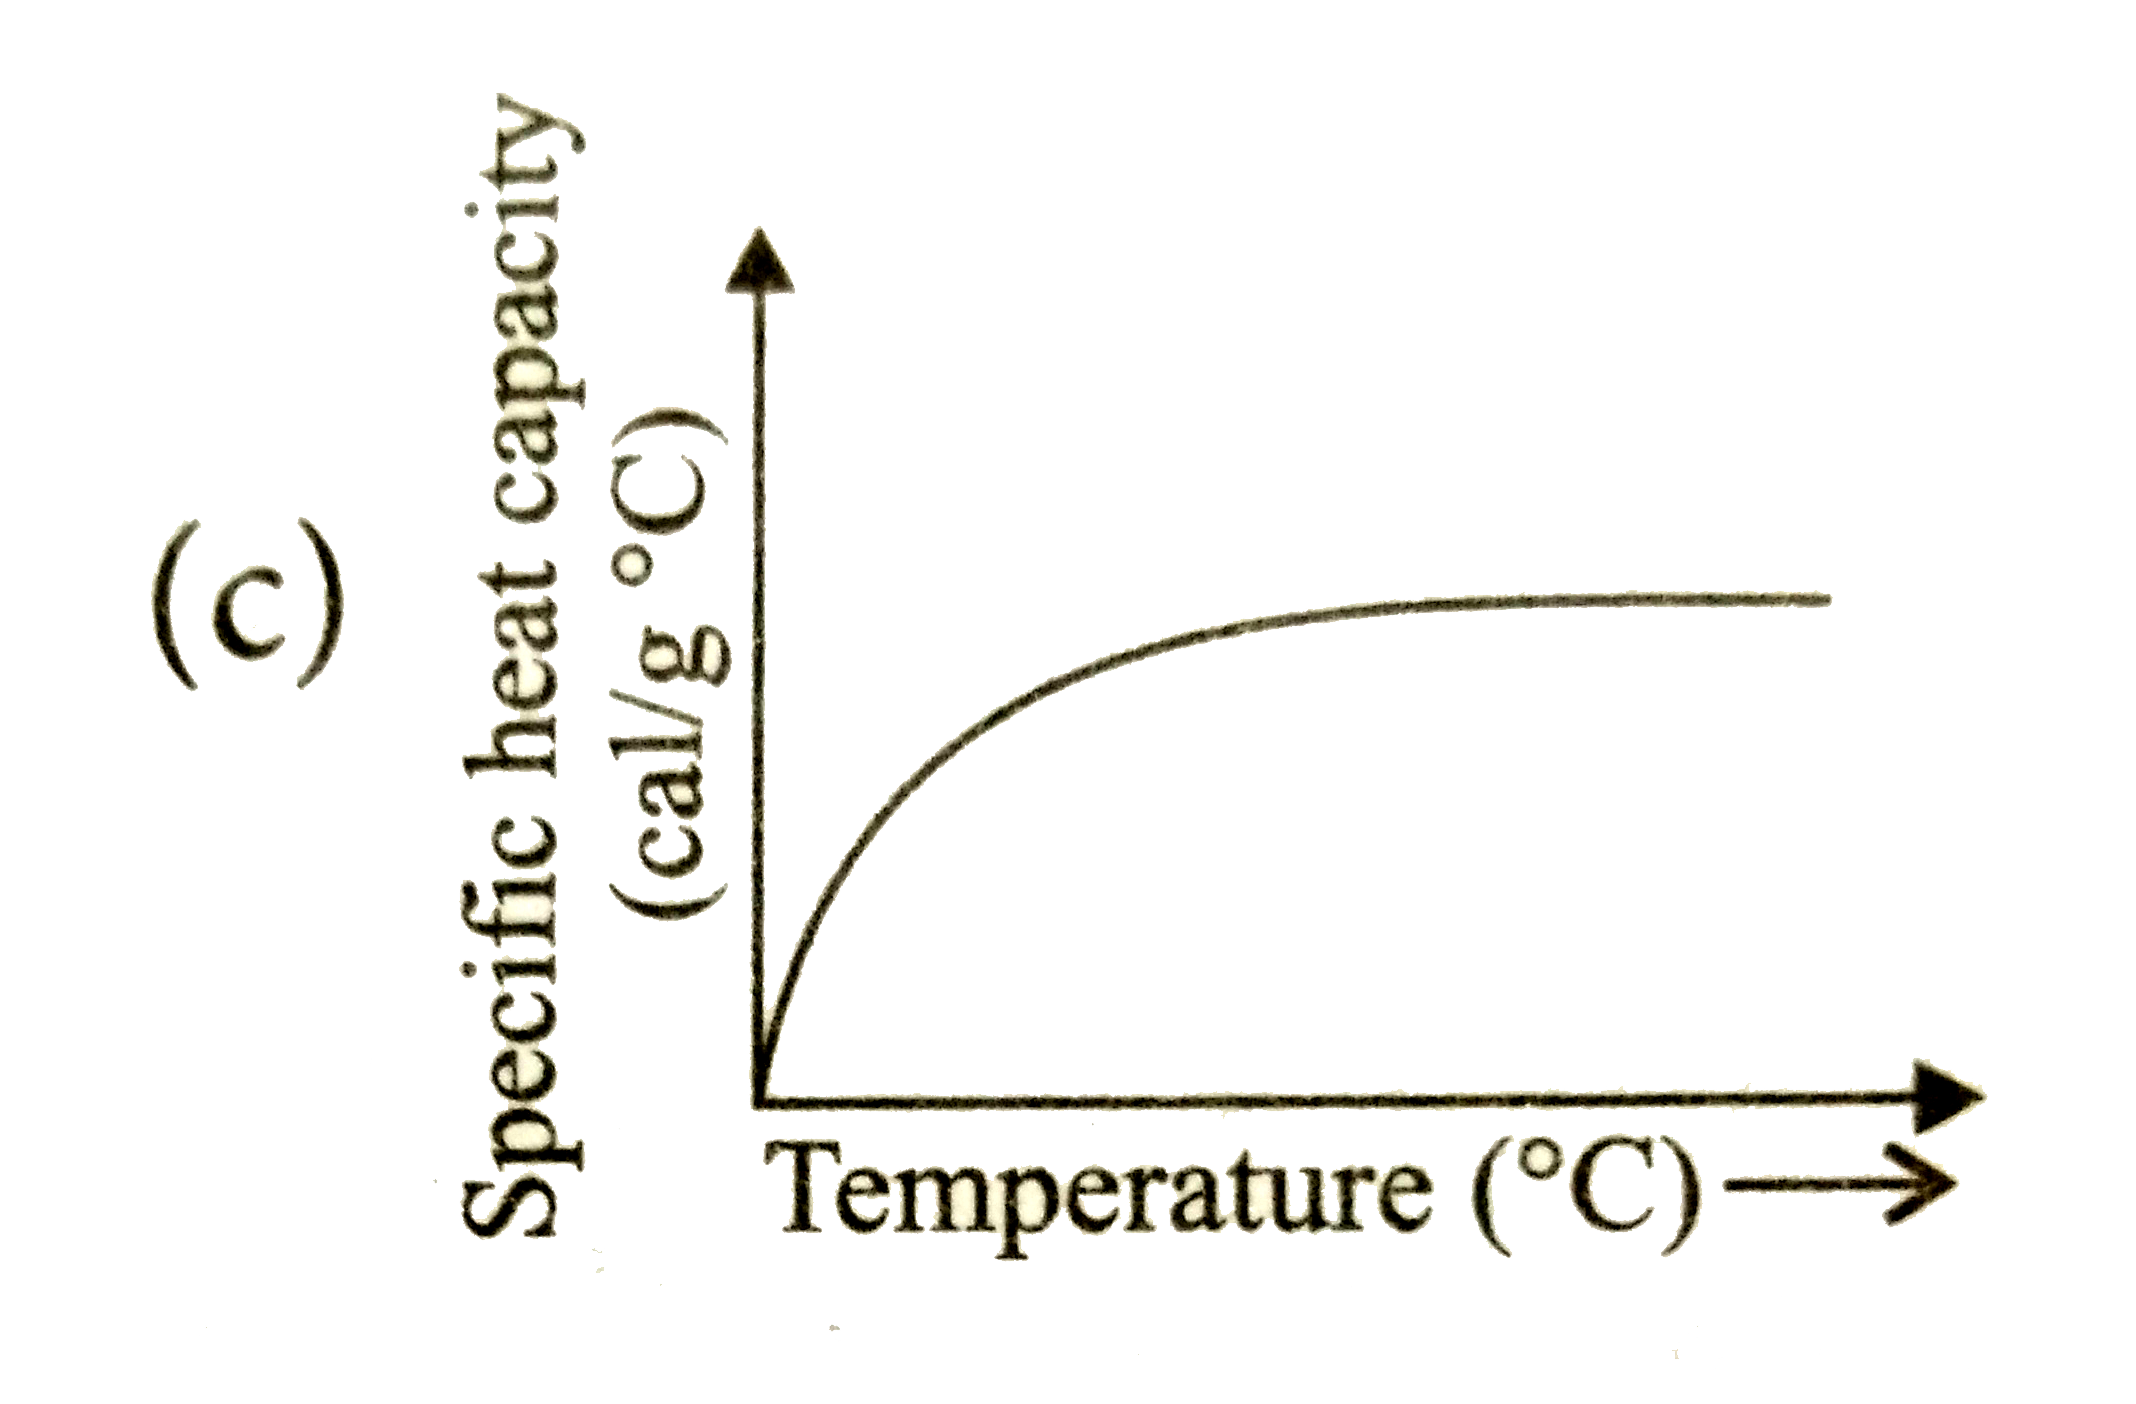
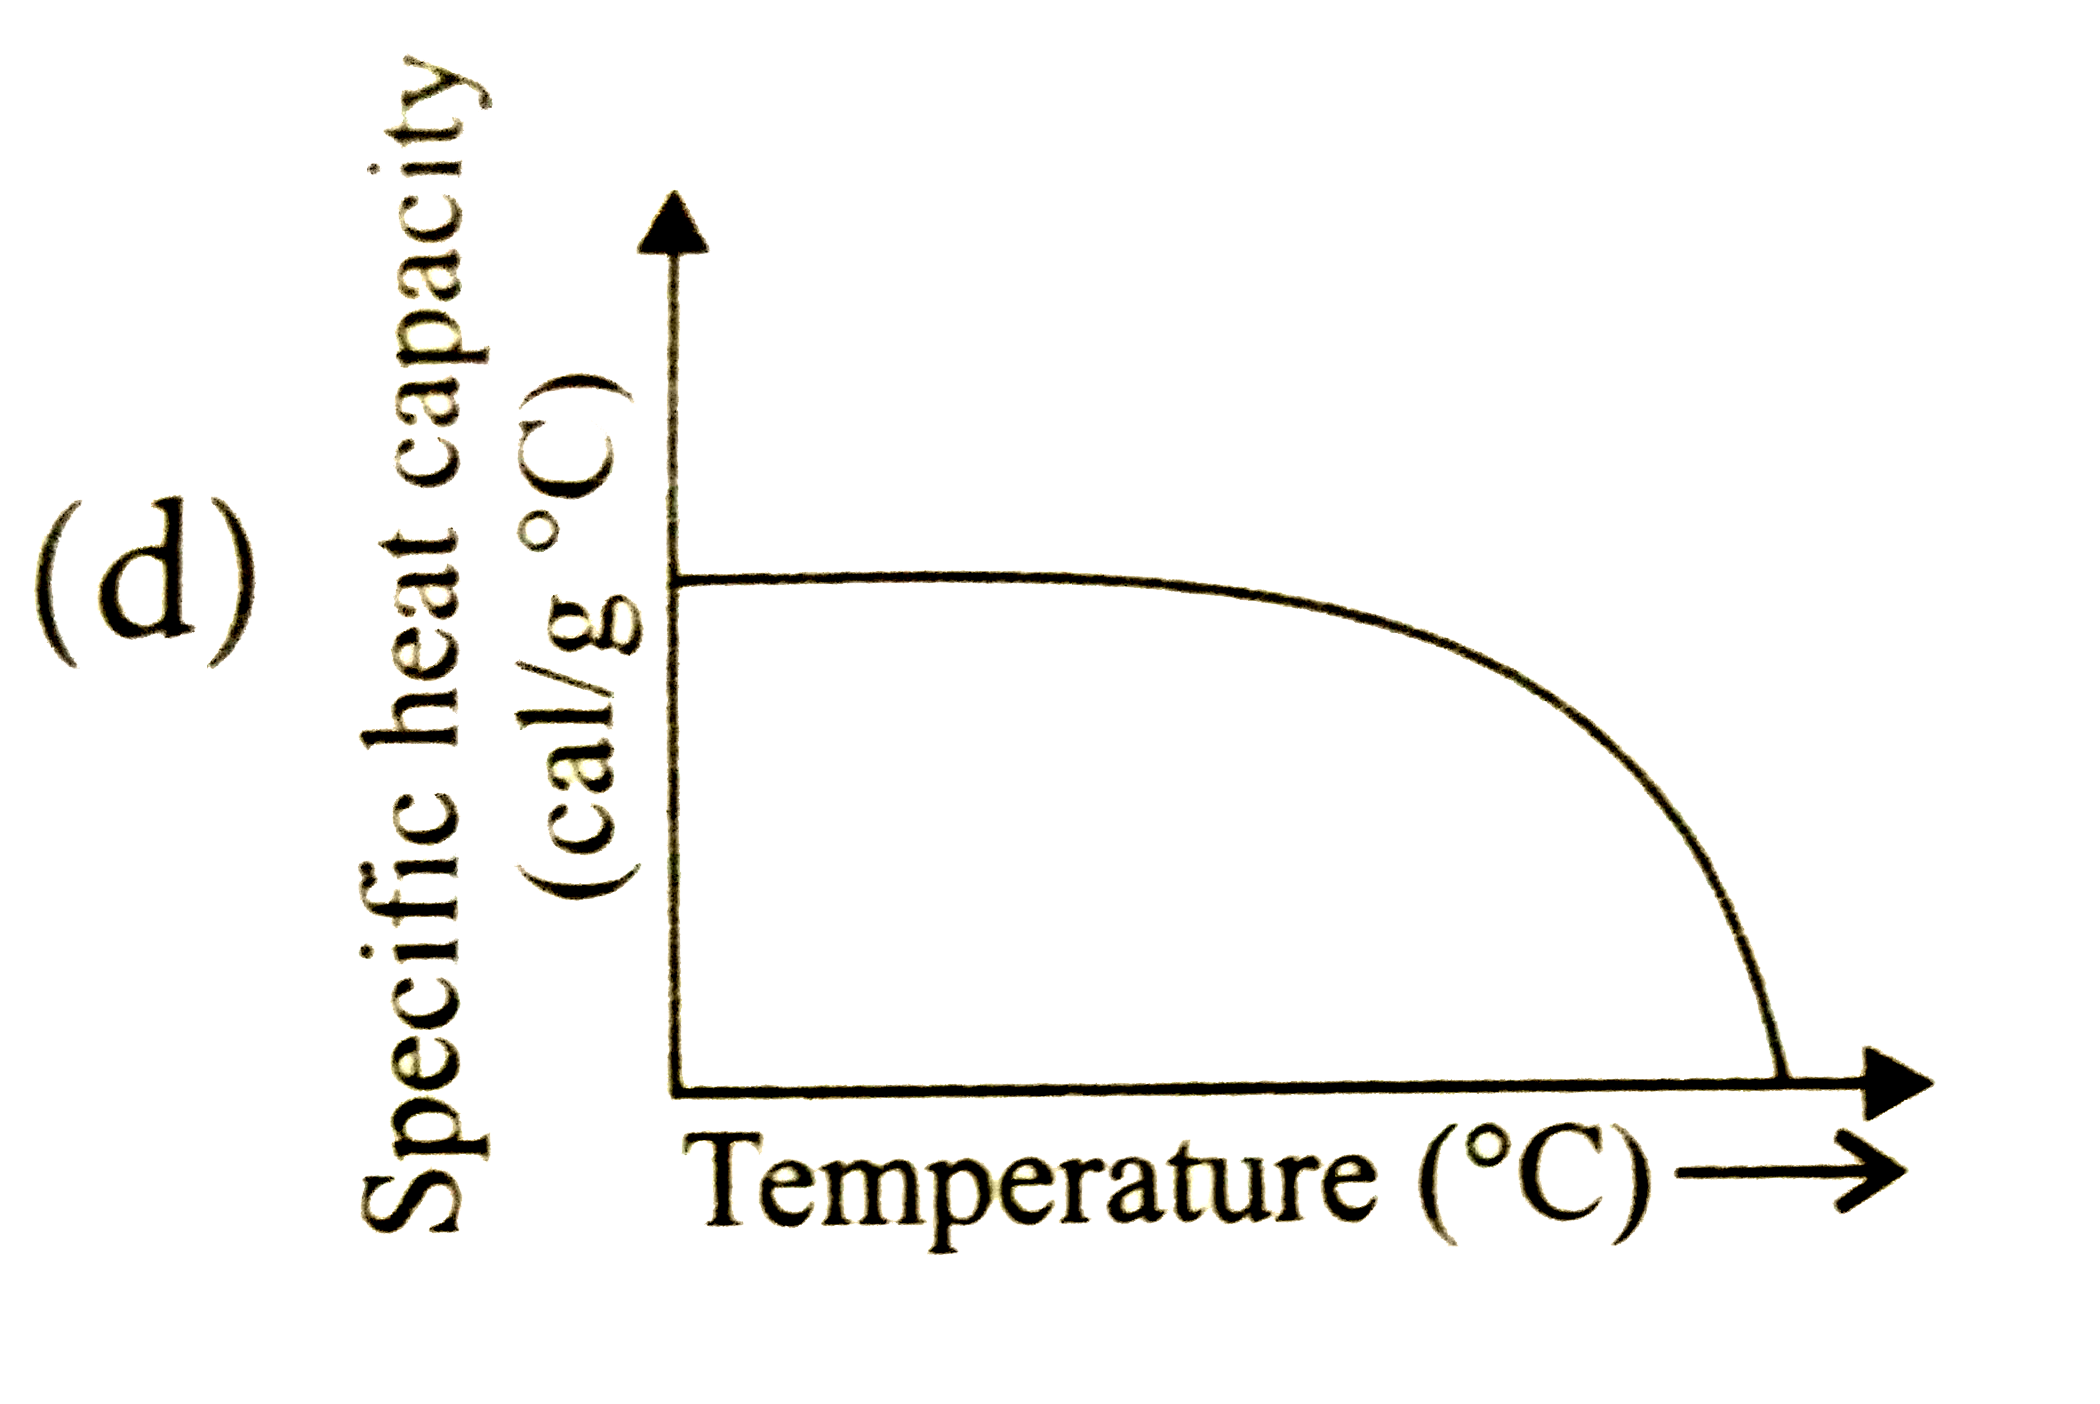
Indicate the graph showing the variation of specific heat of water with temperature . What does it signify?
Text Solution
The variation of specific heat of water with the temperature is as shown in the graph .

From the graph , we find that at T=15∘C , specific heat of water , S=1 calg−1.∘C−1
At T=0∘C,S=1.008Calg−1.∘C−1 the hight est and at T=30∘C,s=0.9976Calg−1.∘C−1, of water increases slightly with rise in temperature .
At T=100∘C , specific heat of water is 1.0057calg−1.∘C−1.
It signifies that the specific heat of water decreases with increase in temperature from 0∘ to 30∘C and increases from 30∘−100∘C.
|
Topper's Solved these Questions
- THERMODYNAMICSBOOK - VGS PUBLICATION-BRILLIANTCHAPTER - THERMODYNAMICSEXERCISE - SHORT ANSWER QUESTIONS
10 Videos
- THERMODYNAMICSBOOK - VGS PUBLICATION-BRILLIANTCHAPTER - THERMODYNAMICSEXERCISE - LONG ANSWER QUESTIONS
4 Videos
- THERMODYNAMICSBOOK - VGS PUBLICATION-BRILLIANTCHAPTER - THERMODYNAMICSEXERCISE - LONG ANSWER QUESTIONS
4 Videos
- SYSTEM OF PARTICLES AND ROTATIONAL MOTION BOOK - VGS PUBLICATION-BRILLIANTCHAPTER - SYSTEM OF PARTICLES AND ROTATIONAL MOTION EXERCISE - PROBLEMS
17 Videos
- TS MARCH- 2018BOOK - VGS PUBLICATION-BRILLIANTCHAPTER - TS MARCH- 2018EXERCISE - SECTION C
1 Videos
Similar Questions
Knowledge Check
Variation of heat of reaction with temperature is known as
A B
B C
C D
D
Which one of the following graphs represents variation of specific heat capacity of water with temperature?
A B
B C
C D
D
Which one of the following graphs represents variation of specific heat capacity of water with temperature?
A B
B C
C D
D
What is red shift? What does it signify?
View SolutionShow variation of resistivity of SI with temperature in a graph.
View SolutionSketch a graph showing variation of resistivity with temperature of (i) Copper (ii) Carbon.
View SolutionWhat is Gauss's law in magnetism? What does it signify?
View SolutionWhat is the value of specific heat of water in SI unit? Does it very with temperature?
View Solution
