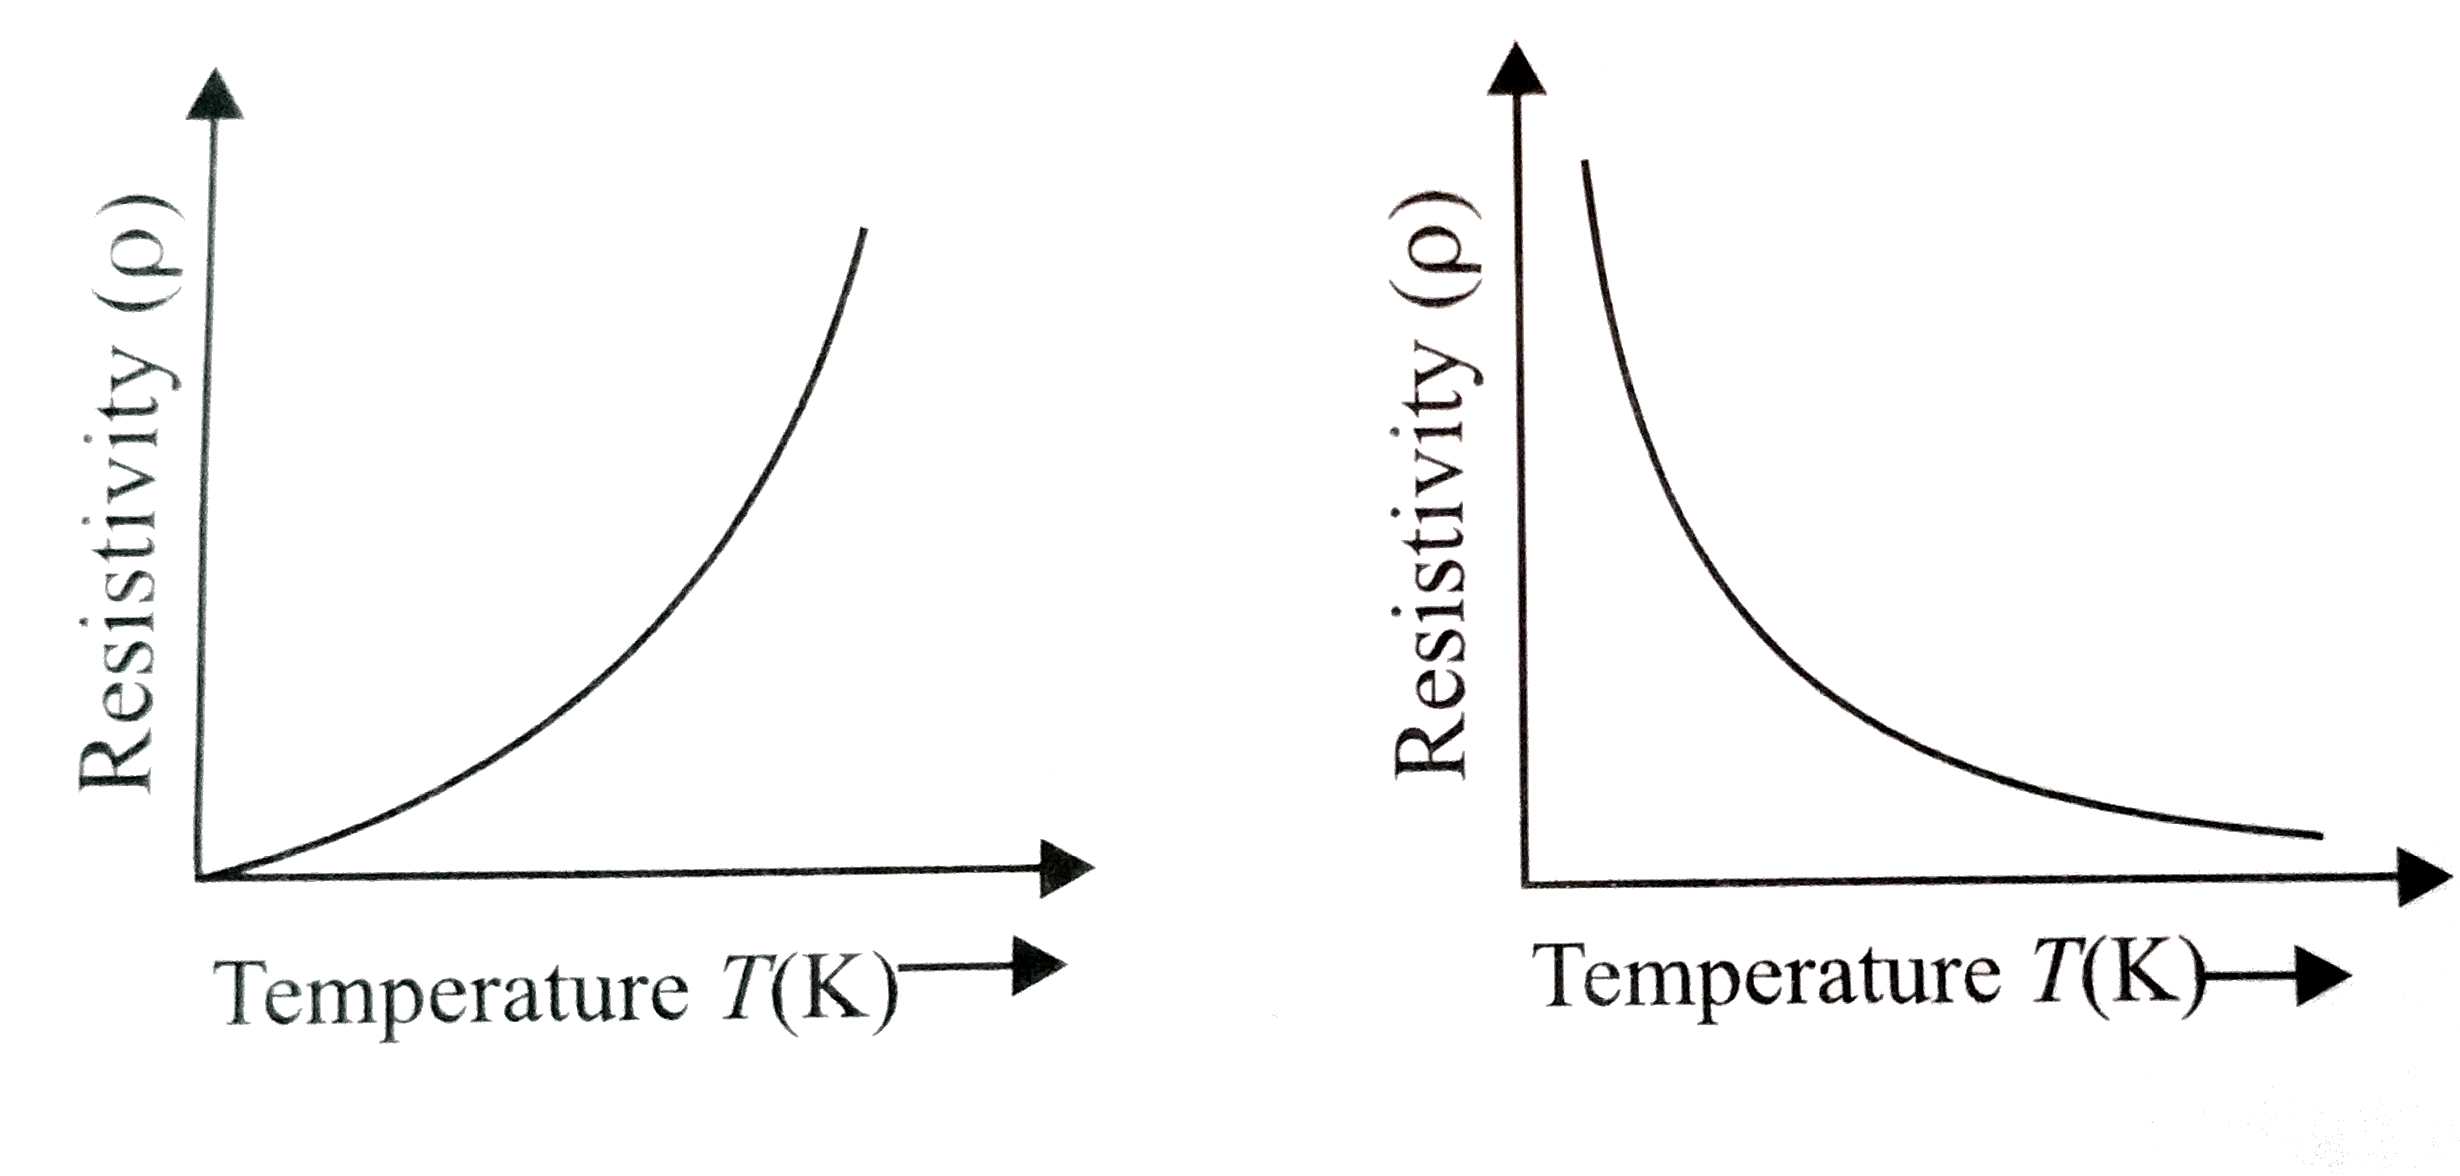
Show variation of resistivity of SI with temperature in a graph.
Step by step video & image solution for Show variation of resistivity of SI with temperature in a graph. by Physics experts to help you in doubts & scoring excellent marks in Class 12 exams.
Updated on:21/07/2023Topper's Solved these Questions
- CBSE Examination Paper Delhi–2014Book:CBSE COMPLEMENTARY MATERIALChapter:CBSE Examination Paper Delhi–2014Exercise:SET-III (Questions Uncommon to set-I and II)
Explore 9 Videos
- CBSE Examination Paper Delhi–2014Book:CBSE COMPLEMENTARY MATERIALChapter:CBSE Examination Paper Delhi–2014Exercise:SET-III (Questions Uncommon to set-I and II)
Explore 9 Videos
- CBSE EXAMINATION PAPER - 2016 Book:CBSE COMPLEMENTARY MATERIALChapter:CBSE EXAMINATION PAPER - 2016 Exercise:SECTION - E
Explore 17 Videos
- CBSE EXAMINATION PAPER, DELHI REGION - 2015 (CODE NO. 55/1/1/D)Book:CBSE COMPLEMENTARY MATERIALChapter:CBSE EXAMINATION PAPER, DELHI REGION - 2015 (CODE NO. 55/1/1/D)Exercise:SECTION E
Explore 6 Videos
Similar Questions
Knowledge Check
Figure (a) and figure (b) both are showing the variation of resistivity (p) with temperature (T) for some materials. Identify the types of these materials.
 AConductor and semiconductorBConductor and InsulatorCInsulator and semiconductorDBoth are conductor
Define the terms resistivity and conductivity and state their S. I. units. Draw a graph showing the variation of resistivity with temperature for a typical semiconductor.
View SolutionDraw a graph showing variation of resistivity with temperature for nichrome. Which property of nichrome is used to make standard resistance coils ?
View Solutionwhich of the following graph represents the variation of resistivity (ρ) with temperature (T) for copper?
View SolutionDefine resistivity of a conductor. Plot a graph showing the variation of resistivity with temperature for a metallic conductor. How does one explain such a behaviour, using the mathematical expression of the resistivity of a material
View SolutionShow on a graph the variation of resistivity with temperature for a typical semiconductor
View SolutionShow on a graph, the variation of resistivity with temperature for a typical semiconductor.
View SolutionDraw a graph showing the variation of resistivity with temperature for nichrome. Which property of nichrome is used to make standard resistance coils?
View Solution
