Sketch a graph showing variation of resistivity with temperature of (i) Copper (ii) Carbon.
To sketch the graphs showing the variation of resistivity with temperature for Copper and Carbon, we need to understand how resistivity changes with temperature for these two materials.
1. Understanding Resistivity and Temperature Relationship:
- For metals like Copper, resistivity increases with an increase in temperature. This is because as temperature rises, the lattice vibrations in the metal increase, leading to more collisions between conduction electrons and lattice ions, which increases resistivity.
- For non-metals like Carbon (specifically in its graphite form), resistivity decreases with an increase in temperature. This is because the increased thermal energy allows more charge carriers to become available, thus reducing resistivity.
2. Graph for Copper:
- X-axis: Temperature (T)
- Y-axis: Resistivity (ρ)
- The graph will start at a lower resistivity value at low temperatures and will slope upwards as temperature increases, indicating that resistivity increases with temperature.
- The curve can be approximated as a straight line for small temperature ranges, but it may curve upwards more steeply at higher temperatures.
3. Graph for Carbon:
- X-axis: Temperature (T)
- Y-axis: Resistivity (ρ)
- The graph will start at a higher resistivity value at low temperatures and will slope downwards as temperature increases, indicating that resistivity decreases with temperature.
- The curve can also be approximated as a straight line for small temperature ranges, but it may curve downwards more steeply at higher temperatures.
4. Labeling the Graphs:
- Clearly label the graph for Copper as "Resistivity vs. Temperature for Copper" and the graph for Carbon as "Resistivity vs. Temperature for Carbon".
- Indicate the direction of increasing temperature on the x-axis and the direction of increasing resistivity on the y-axis.
Final Graph Representation:
- Copper: A line that slopes upwards from left to right.
- Carbon: A line that slopes downwards from left to right.
- For metals like Copper, resistivity increases with an increase in temperature. This is because as temperature rises, the lattice vibrations in the metal increase, leading to more collisions between conduction electrons and lattice ions, which increases resistivity.
- For non-metals like Carbon (specifically in its graphite form), resistivity decreases with an increase in temperature. This is because the increased thermal energy allows more charge carriers to become available, thus reducing resistivity.
- X-axis: Temperature (T)
- Y-axis: Resistivity (ρ)
- The graph will start at a lower resistivity value at low temperatures and will slope upwards as temperature increases, indicating that resistivity increases with temperature.
- The curve can be approximated as a straight line for small temperature ranges, but it may curve upwards more steeply at higher temperatures.
- X-axis: Temperature (T)
- Y-axis: Resistivity (ρ)
- The graph will start at a higher resistivity value at low temperatures and will slope downwards as temperature increases, indicating that resistivity decreases with temperature.
- The curve can also be approximated as a straight line for small temperature ranges, but it may curve downwards more steeply at higher temperatures.
- Clearly label the graph for Copper as "Resistivity vs. Temperature for Copper" and the graph for Carbon as "Resistivity vs. Temperature for Carbon".
- Indicate the direction of increasing temperature on the x-axis and the direction of increasing resistivity on the y-axis.
- Copper: A line that slopes upwards from left to right.
- Carbon: A line that slopes downwards from left to right.
Topper's Solved these Questions
- BOOK - CBSE COMPLEMENTARY MATERIALCHAPTER - ELECTROSTATICS AND CURRENT ELECTRICITY EXERCISE - SHORT ANSWER QUESTIONS (2 MARKS)59videos
ELECTROSTATICS AND CURRENT ELECTRICITY
- BOOK - CBSE COMPLEMENTARY MATERIALCHAPTER - ELECTROSTATICS AND CURRENT ELECTRICITY EXERCISE - SHORT ANSWER QUESTIONS (3 MARKS )23videos
ELECTROSTATICS AND CURRENT ELECTRICITY
- BOOK - CBSE COMPLEMENTARY MATERIALCHAPTER - ELECTRONIC DEVICES EXERCISE - NUMERICALS7videos
ELECTRONIC DEVICES
- BOOK - CBSE COMPLEMENTARY MATERIALCHAPTER - SAMPLE QUESTION PAPER 2019EXERCISE - Section C19videos
SAMPLE QUESTION PAPER 2019
Similar Questions
Knowledge Check
- Question 1 - Select One
Figure (a) and figure (b) both are showing the variation of resistivity (p) with temperature (T) for some materials. Identify the types of these materials.
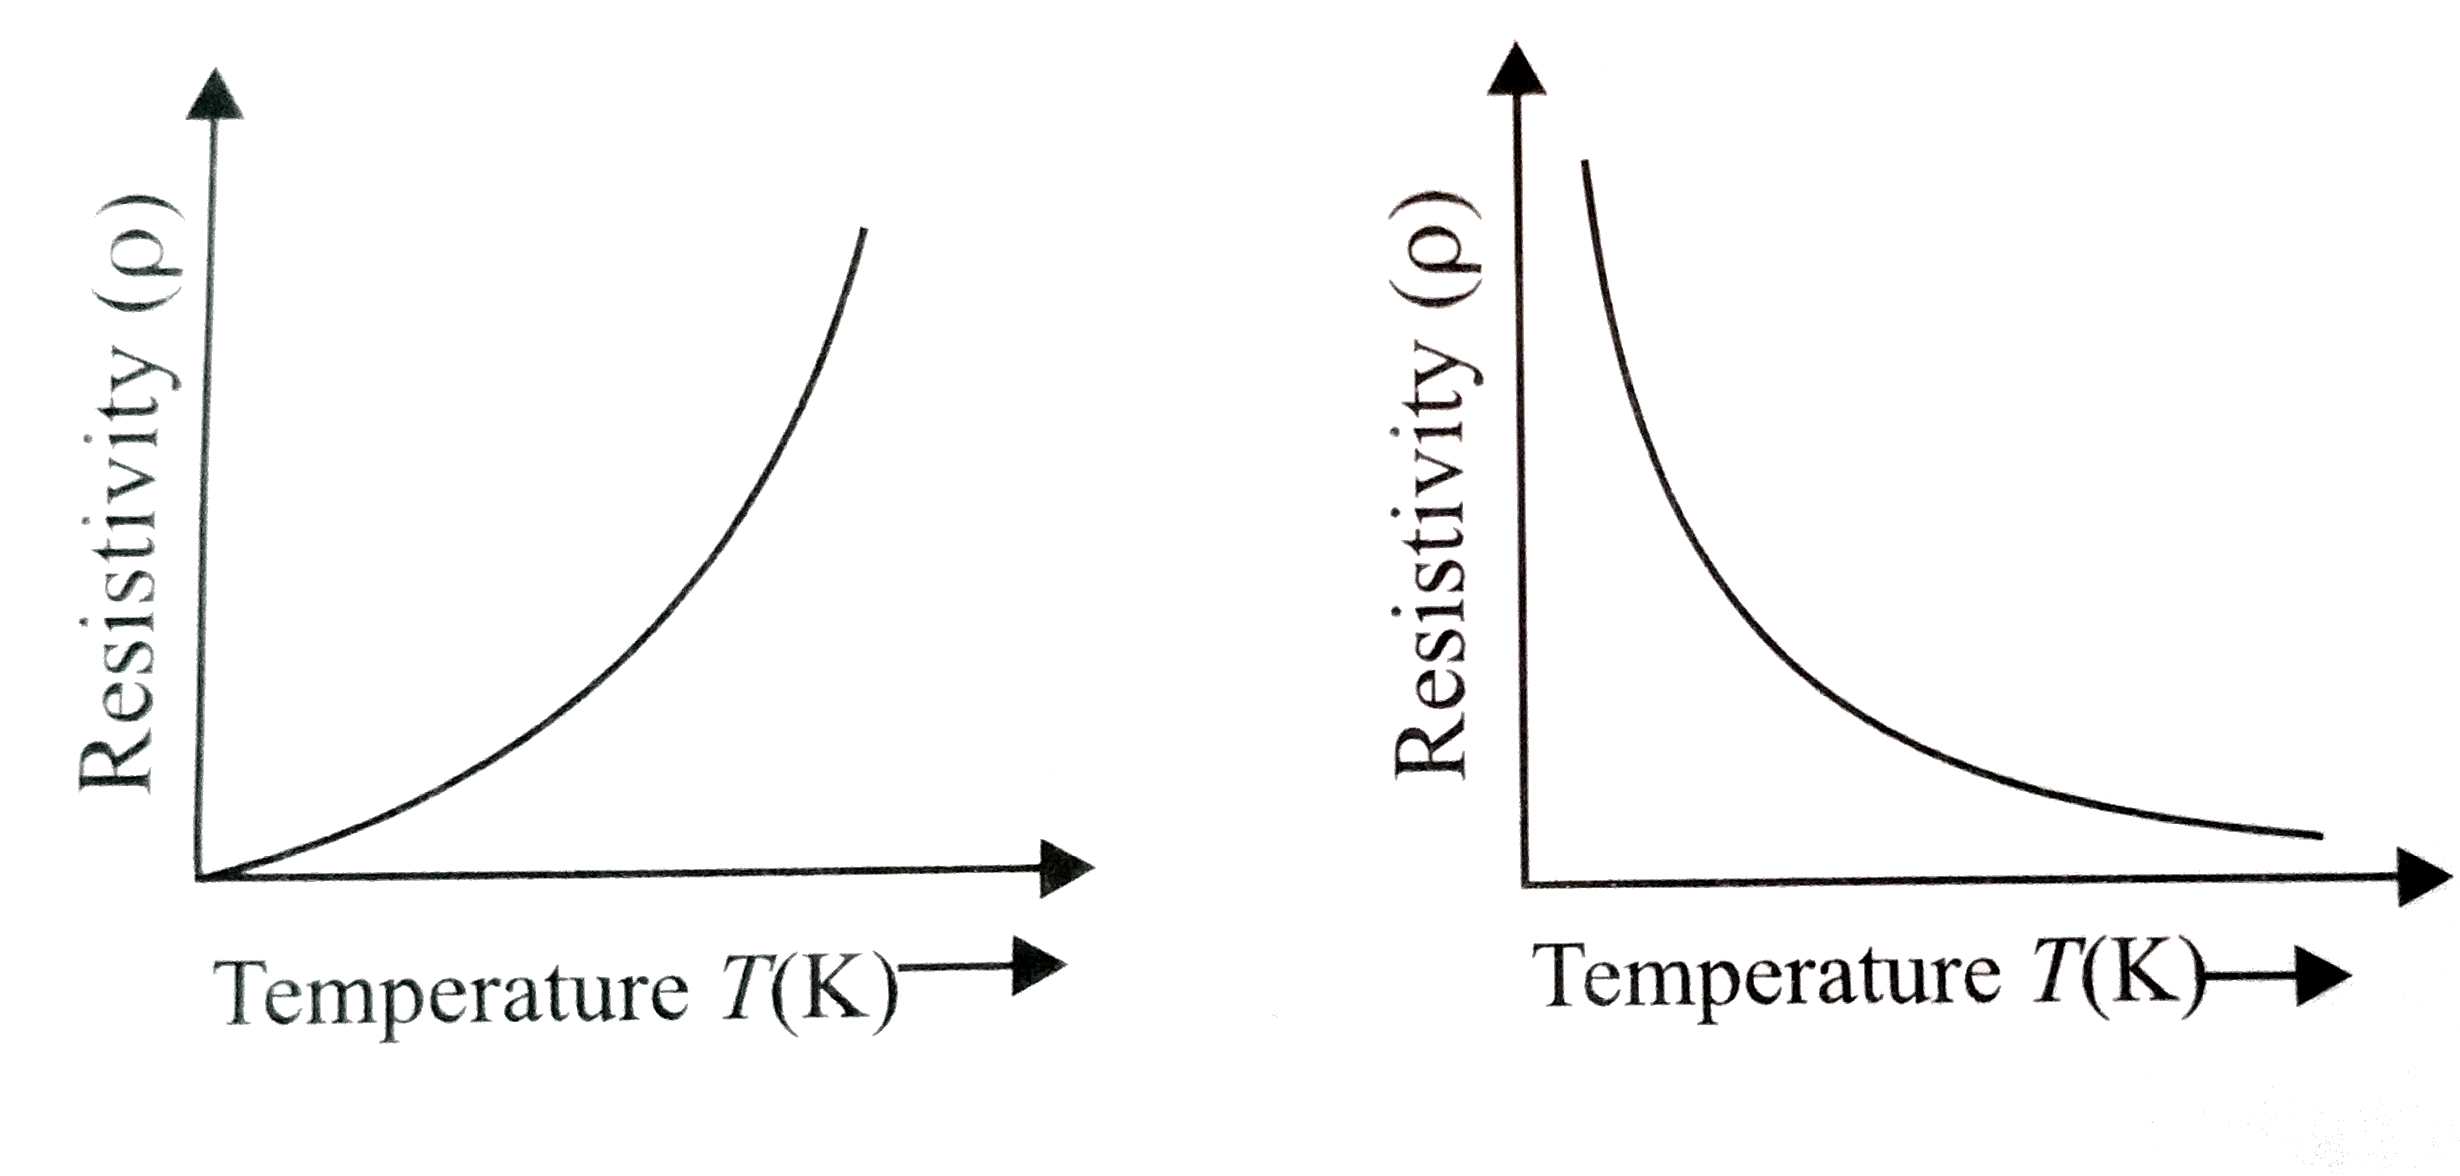 AConductor and semiconductorBConductor and InsulatorCInsulator and semiconductorDBoth are conductor
 - Question 2 - Select One
which of the following graph represents the variation of resistivity (ρ) with temperature (T) for copper?
A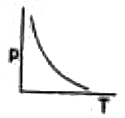 B
B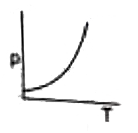 C
C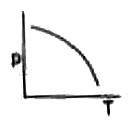 D
D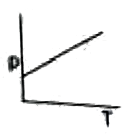
Show on a graph the variation of resistivity with temperature for a typical semiconductor
View SolutionDefine the terms resistivity and conductivity and state their S. I. units. Draw a graph showing the variation of resistivity with temperature for a typical semiconductor.
View SolutionDraw a graph showing variation of resistivity with temperature for nichrome. Which property of nichrome is used to make standard resistance coils ?
View SolutionDefine resistivity of a conductor. Plot a graph showing the variation of resistivity with temperature for a metallic conductor. How does one explain such a behaviour, using the mathematical expression of the resistivity of a material
View SolutionShow on a graph, the variation of resistivity with temperature for a typical semiconductor.
View Solutionwhich of the following graph represents the variation of resistivity (ρ) with temperature (T) for copper?
View Solution

