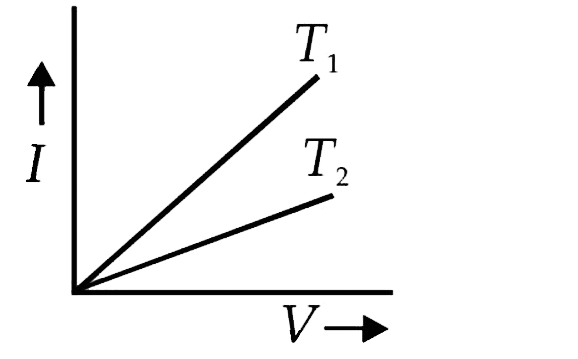
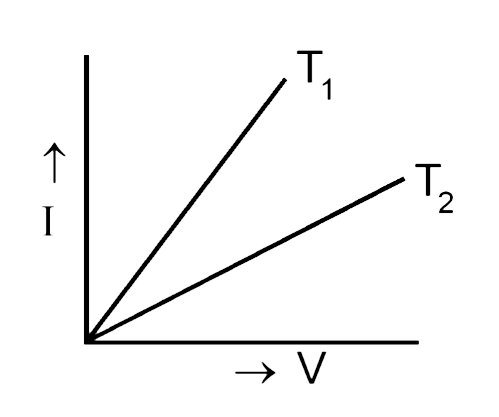
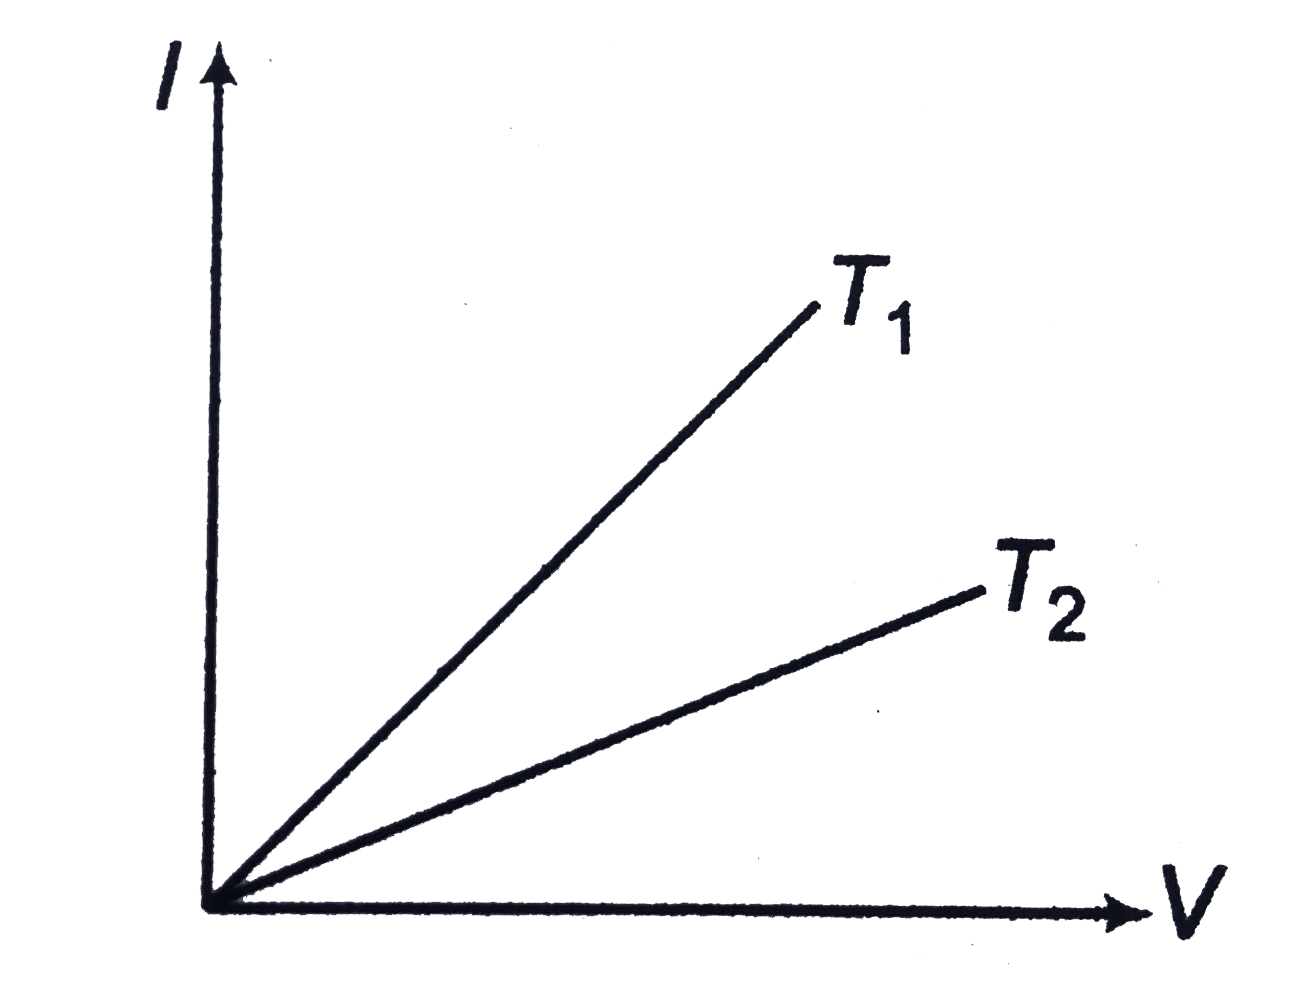
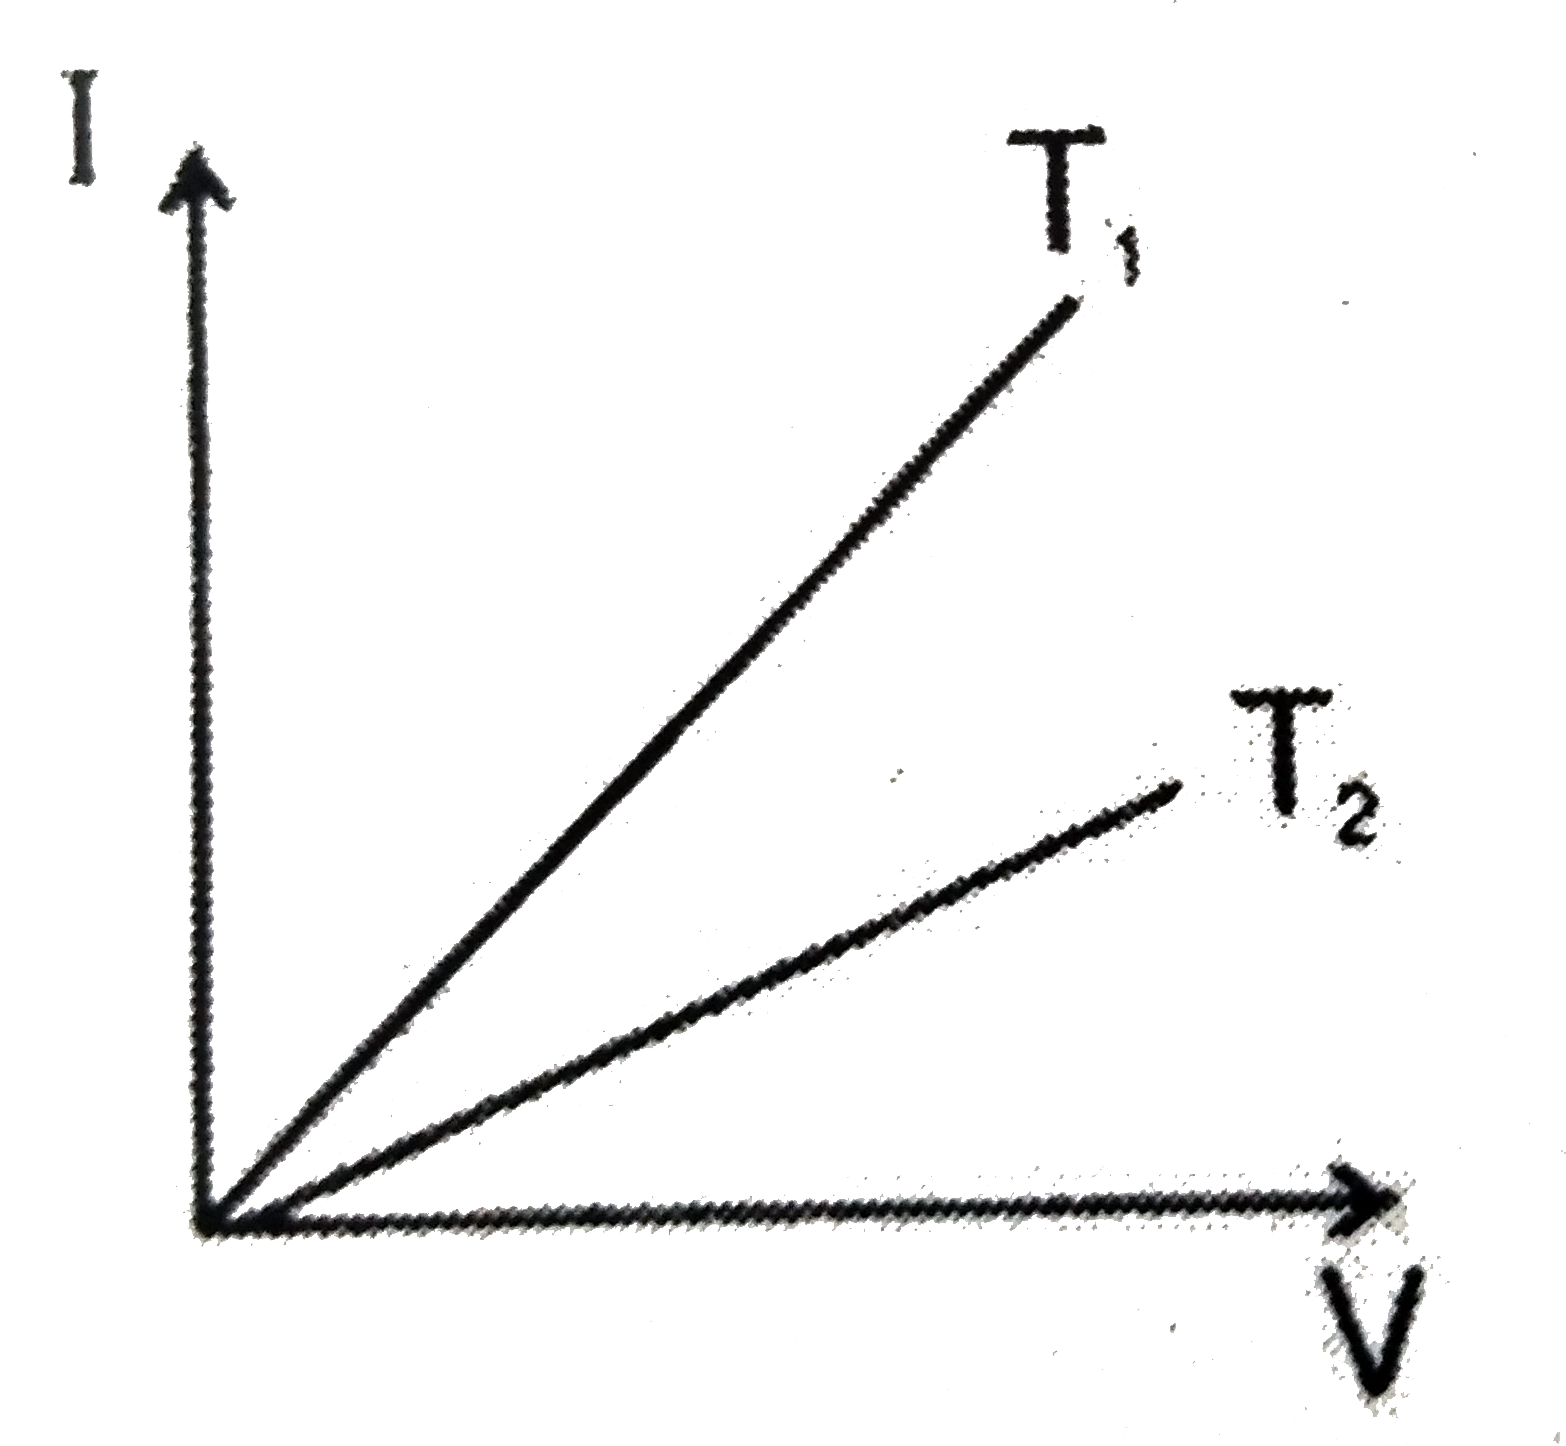
The current -voltage graphs for a given metallic wire at two different temperatures and are shown in the fig.1.46 Is the temperature greater than ?

Temperature is greater than .Resistance of the metallic wire is obtained from the ratio . From the fig.1.46 the gradient of the graph at is less than at .So the ratio is larger i.e,., the resistance of the metallic wire at temperature is larger. Because the resistance of a metallic wire increases with the rise in temperature, so is greater than .
Topper's Solved these Questions
- CURRENT ELECTRICITY BOOK - CHHAYA PUBLICATIONCHAPTER - CURRENT ELECTRICITY EXERCISE - NCERT TEXTBOOK QUESTION WITH ANSWER HINT
4 Videos
- CURRENT ELECTRICITY BOOK - CHHAYA PUBLICATIONCHAPTER - CURRENT ELECTRICITY EXERCISE - NCERT EXEMPLAR QUESTION WITH ANSWER HINT(MCQ-1)
2 Videos
- CURRENT ELECTRICITY BOOK - CHHAYA PUBLICATIONCHAPTER - CURRENT ELECTRICITY EXERCISE - CBSE SCANNER
16 Videos
- COMMUNICATION STSTEMBOOK - CHHAYA PUBLICATIONCHAPTER - COMMUNICATION STSTEMEXERCISE - CBSE SCANNER
28 Videos
- DIFFRACTION AND POLARISATION OF LIGHTBOOK - CHHAYA PUBLICATIONCHAPTER - DIFFRACTION AND POLARISATION OF LIGHTEXERCISE - CBSE SCANNER
27 Videos
Similar Questions
The current - voltage graphs for a given metallic wire at two different temperatures T1andT2 are shown in the figure.

The temperature T2 is greater than T1.
View SolutionThe current - voltage graphs for a given metallic wire at two different temperatures T1andT2 are shown in the figure.

The temperature T2 is greater than T1.
View Solution
Knowledge Check
The current (I) and voltage (V) graphs for a given metallic wire at two different temperature (T1) and (T2) are shown in fig. It is concluded that
 AT1=T2BT1>T2CT1<T2DNone of these
The current (I) and voltage (V) graphs for a given metallic wire at two different temperature (T1) and (T2) are shown in fig. It is concluded that
 AT1>T2BT1<T2CT1=T2DT1=2T2
The current - voltage graphs for a given metallic wire at two different temperatures T1andT2 are shown in the figure.

The temperature T2 is greater than T1.
View SolutionThe current voltage graphs for a given metalic wire two different temperature T1 and T2 are shown in figure The temperature T2 is greater than T1. Is this statement true or false?

View SolutionThe current voltage graphs for a given metalic wire two different temperature T1 and T2 are shown in figure The temperature T2 is greater than T1. Is this statement true or false?

View SolutionThe current voltage graphs for a given metalic wire two different temperature T1 and T2 are shown in figure The temperature T2 is greater than T1. Is this statement true or false?

View SolutionThe current (I) and voltage (V) graphs for a given metallic wire at two different temperature (T1) and (T2) are shown in fig. It is concluded that

View SolutionThe current-coltage graphs for a given metallic wire at two differenct tempeature T1 and T2 are shown in the figure. Which one is higher, T1 or T2

View Solution
