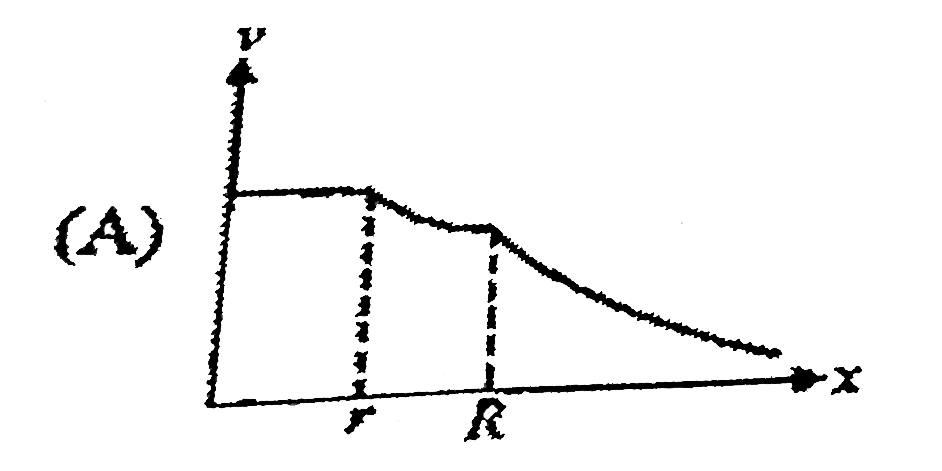
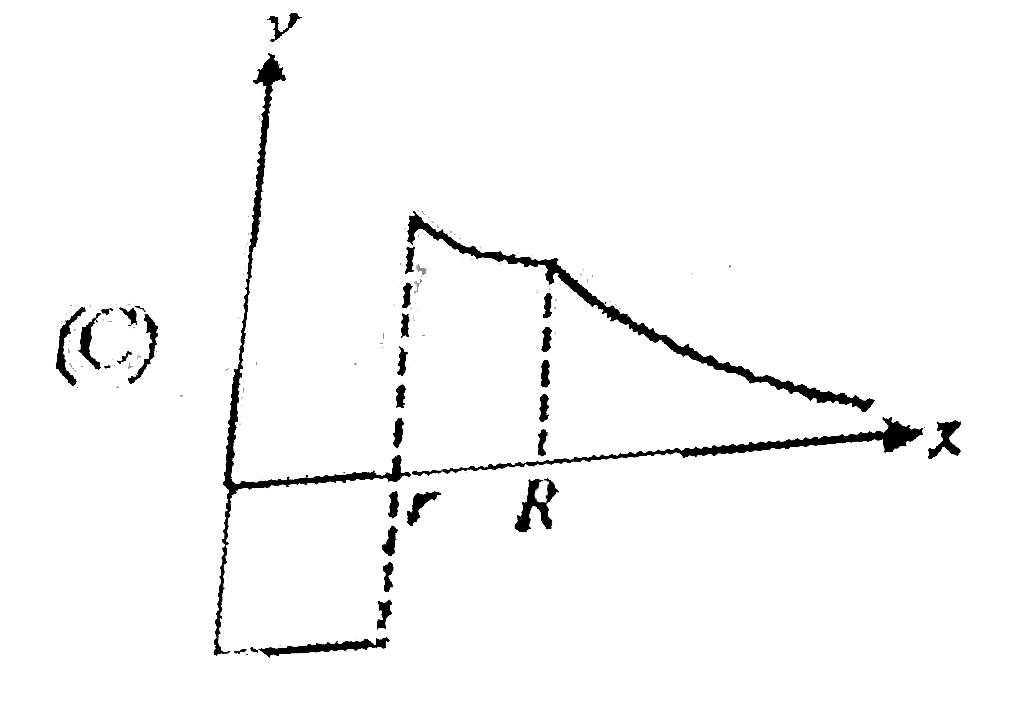
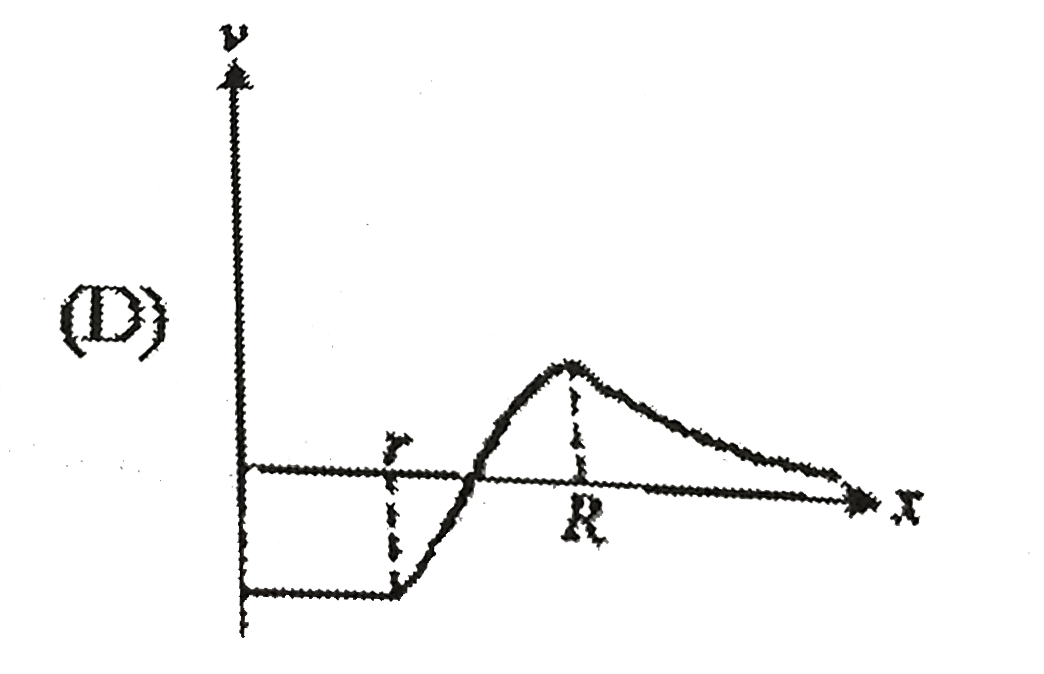
Two concentric spherical shells of radii r and R(r<R) have surface charge densities −σ and +σ respectively. The variation ofelectric potential V with distance x from the centre O of the shells plotted. Which of the following graphs best depict the variation qualitatively?


Step by step video & image solution for Two concentric spherical shells of radii r and R(rltR) have surface charge densities -sigma and +sigma respectively. The variation ofelectric potential V with distance x from the centre O of the shells plotted. Which of the following graphs best depict the variation qualitatively? by Physics experts to help you in doubts & scoring excellent marks in Class 12 exams.
Updated on:21/07/2023Topper's Solved these Questions
- ELECTROSTATICSBOOK - PHYSICS GALAXY - ASHISH ARORACHAPTER - ELECTROSTATICSEXERCISE - Numerical MCQs Single options Correct
64 Videos
- ELECTROSTATICSBOOK - PHYSICS GALAXY - ASHISH ARORACHAPTER - ELECTROSTATICSEXERCISE - Advance MCQs
40 Videos
- ELECTROSTATICSBOOK - PHYSICS GALAXY - ASHISH ARORACHAPTER - ELECTROSTATICSEXERCISE - Discussion Question
25 Videos
- ELECTROMAGNETIC INDUCTION AND ALTERNATING CURRENTBOOK - PHYSICS GALAXY - ASHISH ARORACHAPTER - ELECTROMAGNETIC INDUCTION AND ALTERNATING CURRENTEXERCISE - Advance MCQs
33 Videos
- GEOMETRICAL OPTICSBOOK - PHYSICS GALAXY - ASHISH ARORACHAPTER - GEOMETRICAL OPTICSEXERCISE - Unsolved Numerical Problems
107 Videos
Similar Questions
Three concentric spherical metallic shells A, B and C of radii a, b and c (a lt b ltc) have surface charge densities σ, −σ and σ respectively.
(i) Find the potential of the three shells A, B and C.
(ii) If the shells A and C are at the same potential, obtain the relation between the radii a, b and c.
View SolutionThe dependence of electric potential V on the distance 'r' from the centre of a charged spherical shell is shown by :
View Solution
Knowledge Check
Three concentric metallic spherical shells A,B and C of radii a,band c(a<b<c) have surface charge densities −σ,+σand -sigma respectively,thepotentialofshellA is
A(σ/ε0)[a+b−c]B(σ/ε0)[a−b+c]C(σ/ε0)[b−a−c]DnoneThree concentric spherical metallic spheres A,B and C of radii a,b and c(a<b<c) have surface charge densities σ,−σ and σ respectively.
AThe potential of shell A:
VA=σε0(a+b+c)BThe potential of shell B:
VB=σε0(a2b−b+c)CThe potential of shell C:
VC=σε0(a2−b2c+c)DAll options are correctThree concentric metallic spherical shell A,B and C or radiin a,b and C (a<b>C) have surface charge densities −singama,+σ, and −aigba respectively .
The potential of shell A is :A(σ/ɛ0)[a+b−c]B(σ/ɛ0)[a+b−c]C(σ/ɛ0)[a+b−c]Dnone
Three concentric spherical shells have radii a,b and c(a<b<c) and have surface charge densities σ,−sigam and σ respectively. If VA,VB and VC denote the potentials of the three shells, then for c=q+b, we have
View SolutionThe variation of electrostatic potential with radial distance r from centre of positively charged metallic thin shell of radius R is given by graph
View SolutionThree concentric spherical shells have radii a,b and c(a<b<c) and have surface charge densities σ,−σ and σ respectively. If VA,vB and Vc denote the potentials of the three shells, then, for VA=VC, we get-
View SolutionThree concentric spherical shells have radii a,b and c(a<b<c) and have surface charge densities σ,−σandσ respectively. If VA,VB and VC denote the potentials of the three shells, then for c=a+b, we have
View SolutionThe variation of electrostatic potential with radial distance r from centre of positively charged metallic thin shell of radius R is given by graph
View Solution
