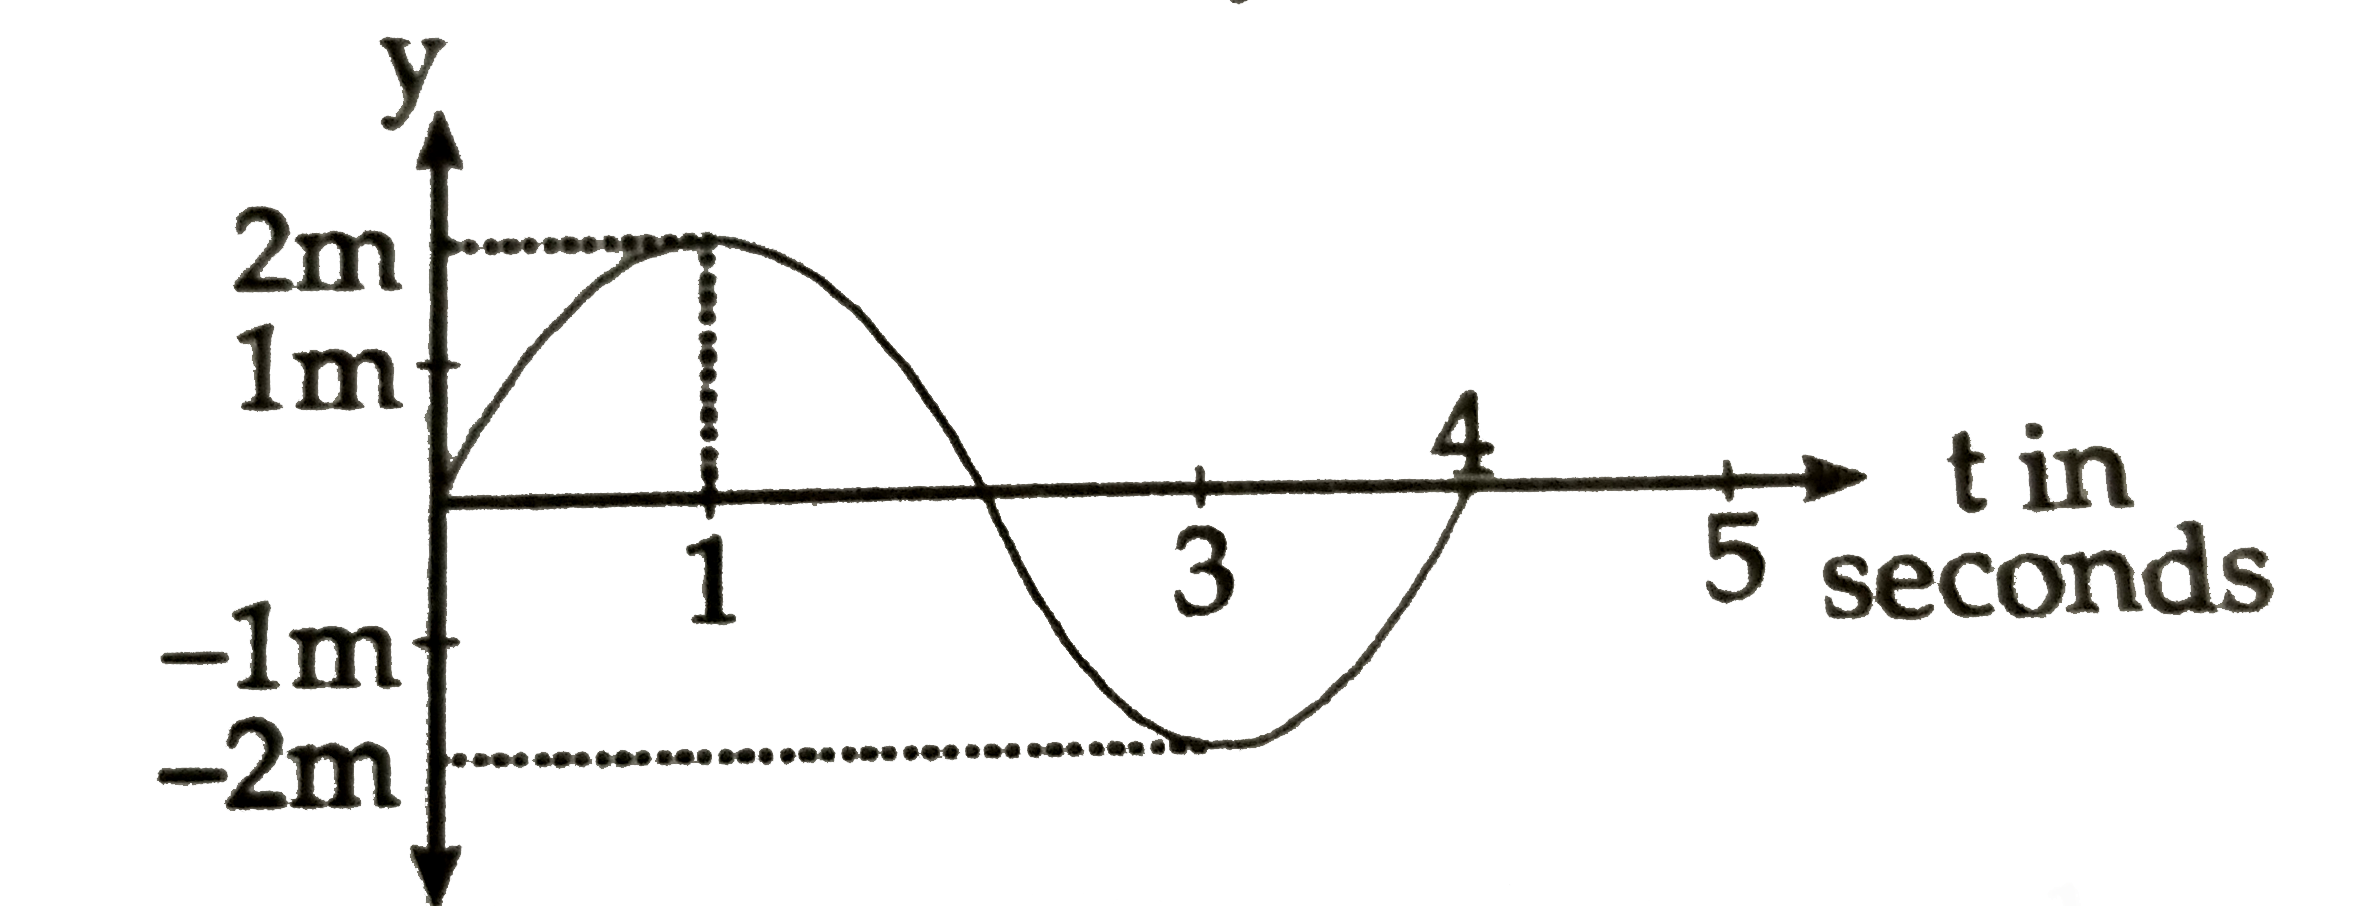
A particle is executing SHM between points-XmandXm, as shown in figure(i). The velocity V(t) of the particle is partially graphed and shown in figure (ii). Two points A and B corresponding to time t1 and time t2 respectively are marked on the V(t) curve.
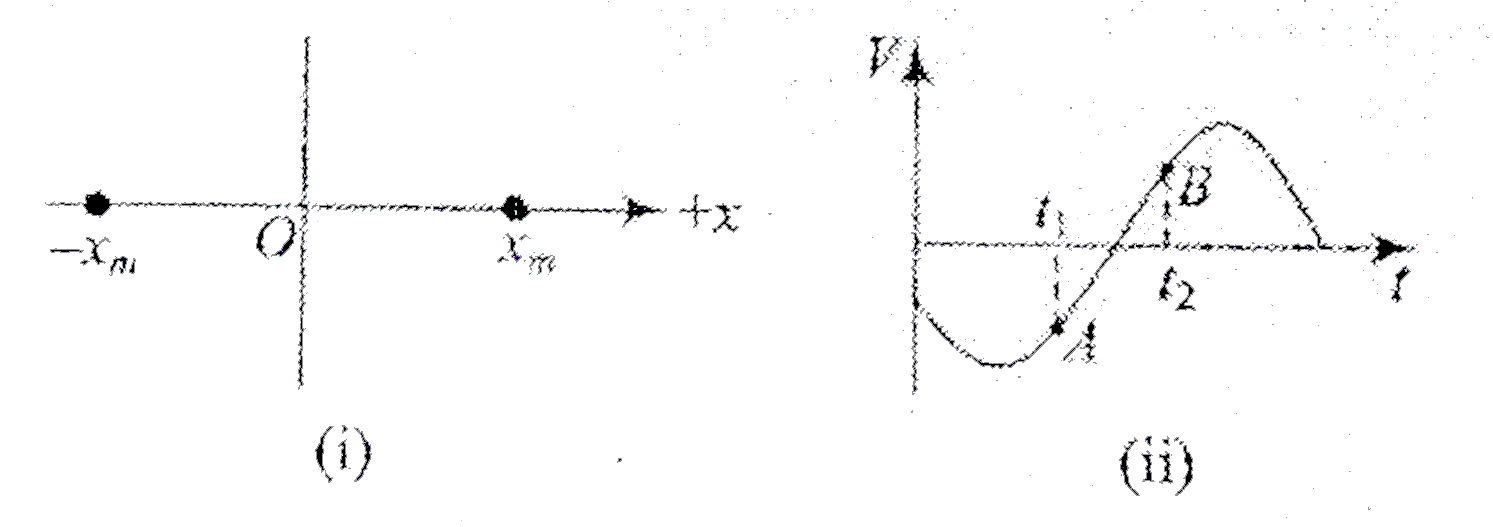
At time t1, it ios going towards Xm.
At time t1, its speed is decreasing
At time t2, its position lies in between −Xm and O
The phase difference Δϕ between points A and B must be expressed as 90∘<Δϕ<180∘.
The correct Answer is:B, C
Step by step video, text & image solution for A particle is executing SHM between points-X_(m)andX_(m), as shown in figure(i). The velocity V(t) of the particle is partially graphed and shown in figure (ii). Two points A and B corresponding to time t_(1) and time t_(2) respectively are marked on the V(t) curve. by Physics experts to help you in doubts & scoring excellent marks in Class 11 exams.
Similar Questions
Knowledge Check
- Question 1 - Select One or More
The figure shows the velocity (v) of a particle plotted against time (t).
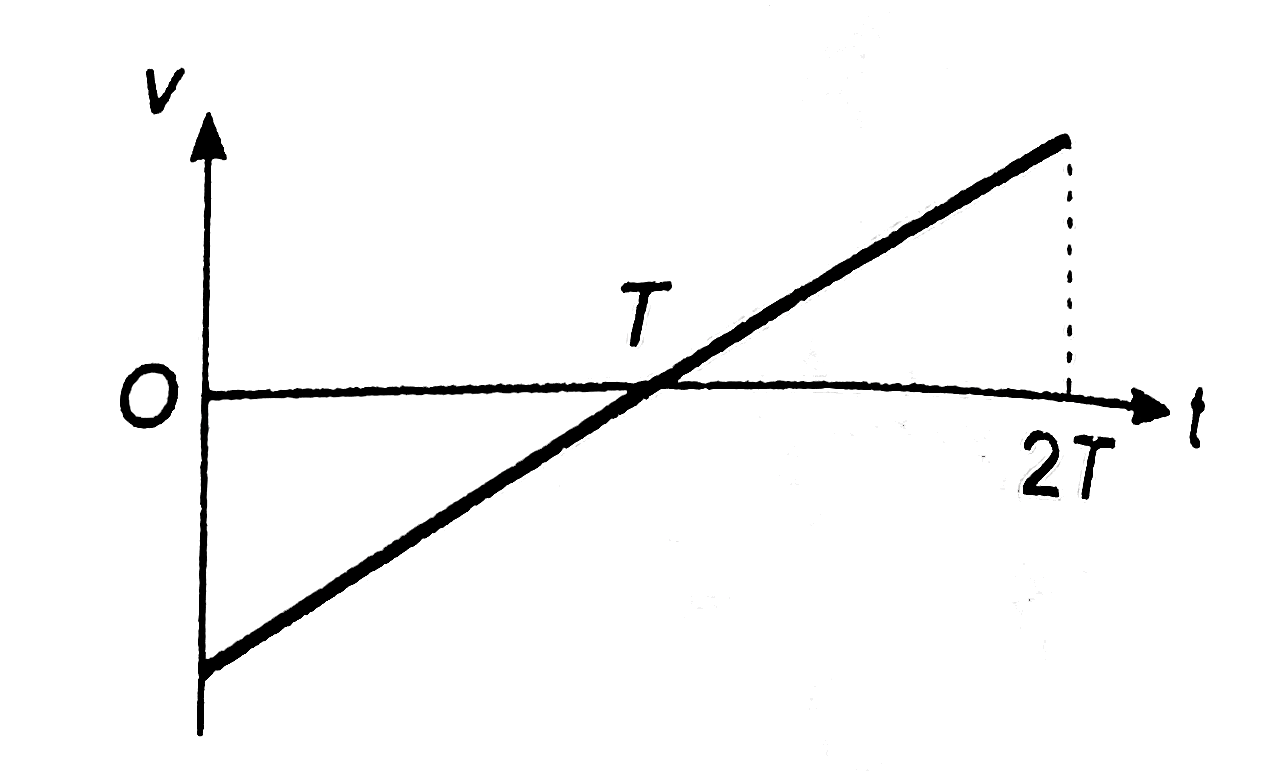 AThe particle changes its direction of motion at some point.BThe acceleration of the particle remains constantCThe displacement of the particle is zeroDThe initial and final speeds of the particle are the same
 - Question 2 - Select One or More
The figure shows the velocity (v) of a particle ploted against time (t).
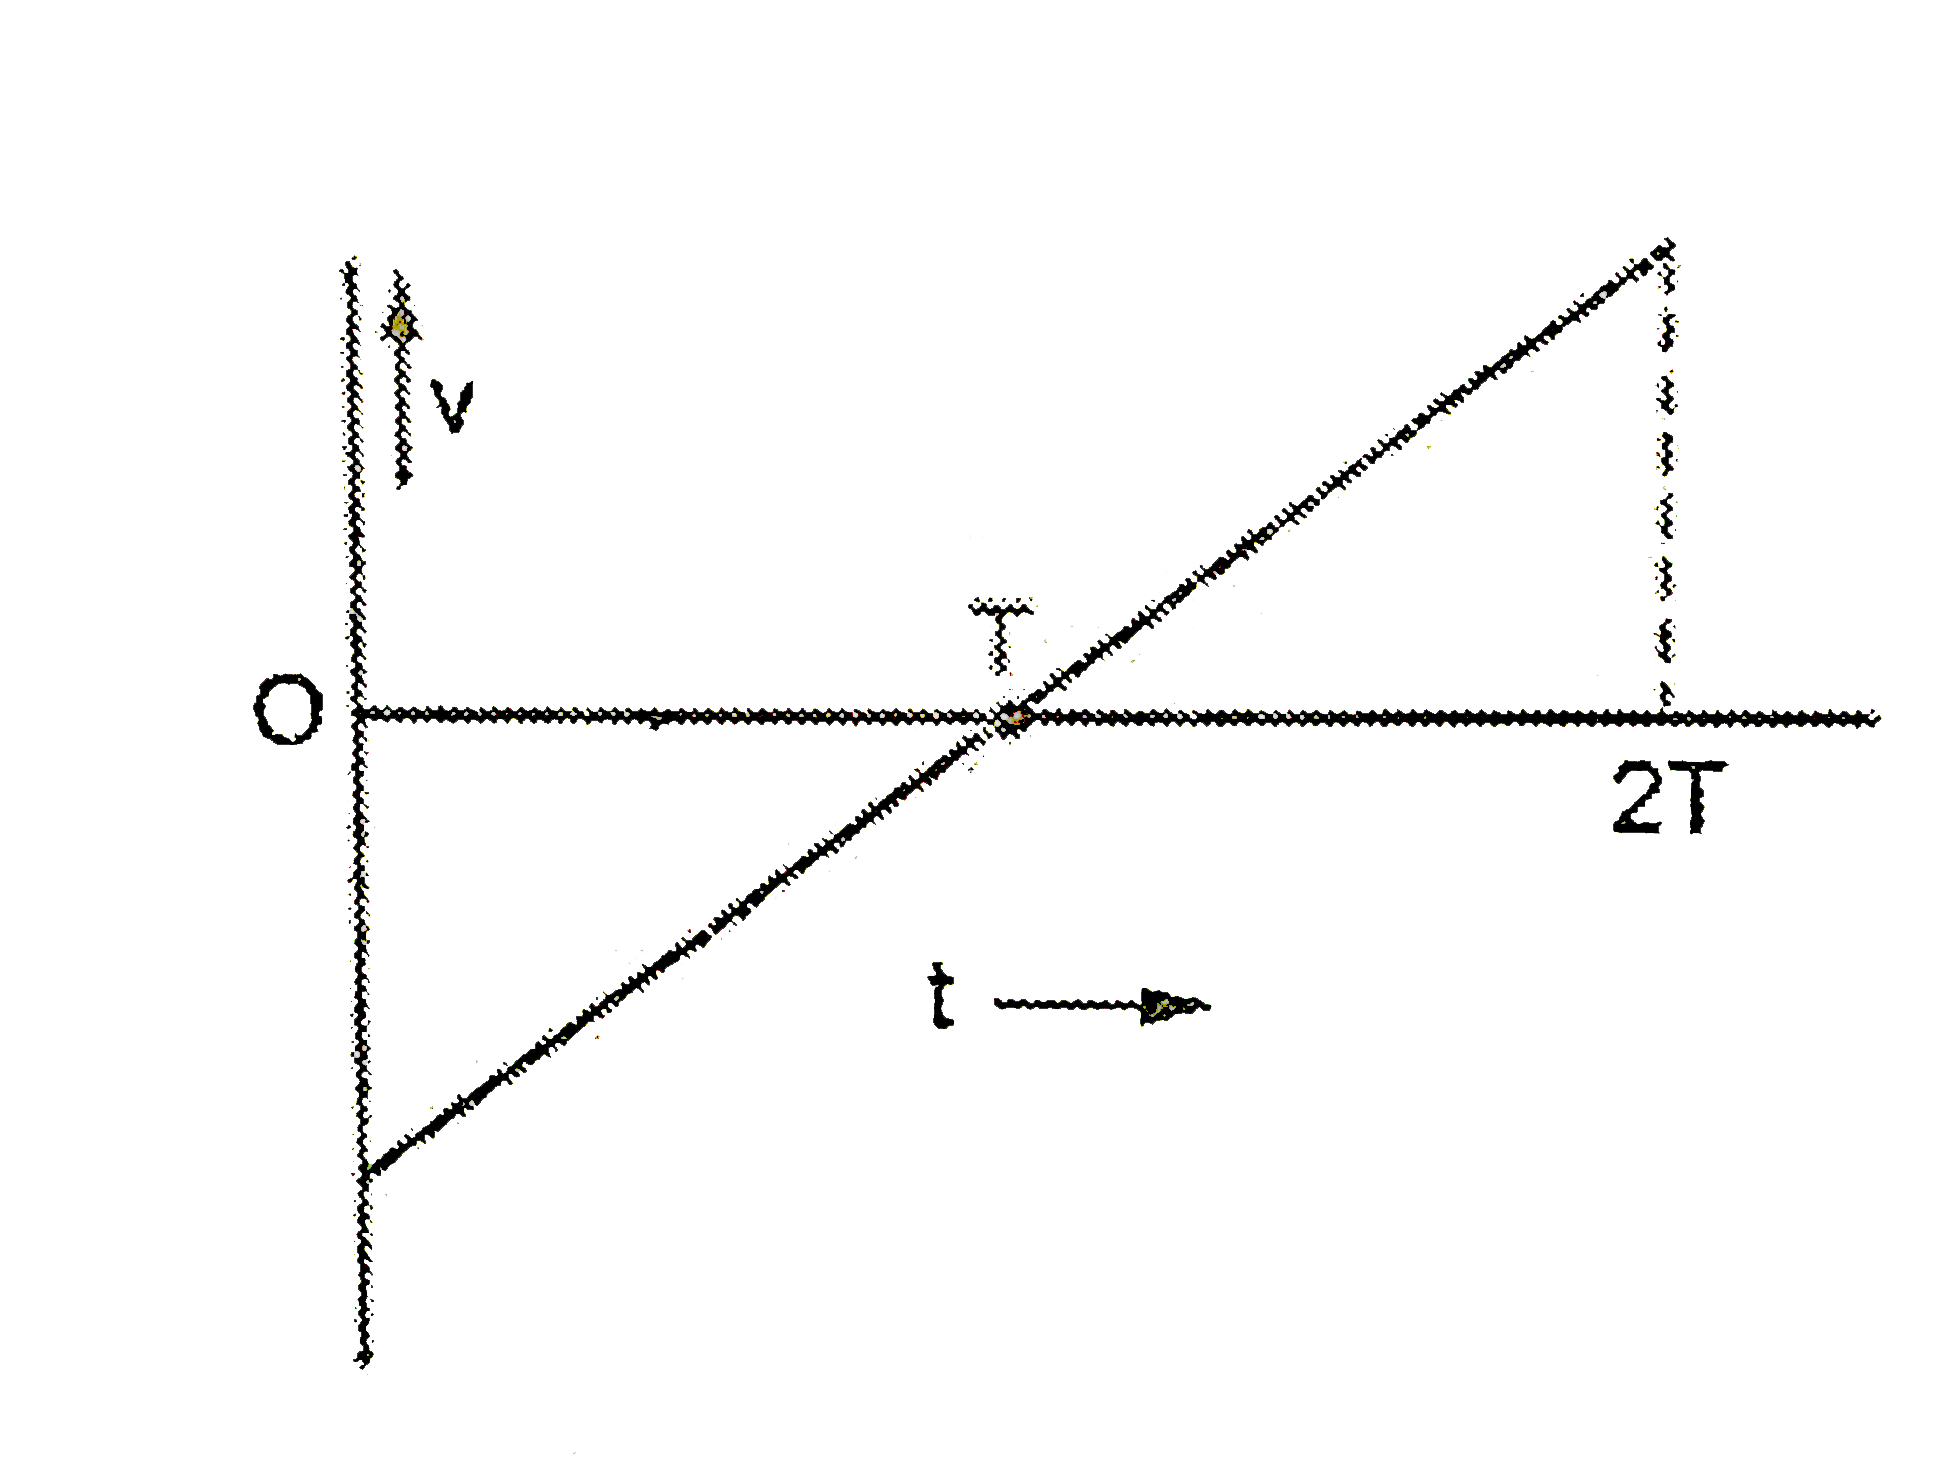 AThe particle changes its direction of motion at some pointBThe acceleration of the particle remains constantCThe displacement of the particle is zeroDThe initial and final speeds of the particle are the same.
 - Question 3 - Select One
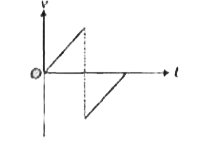
The velocity (v) - time (t) graph for a particle moving along x - axis is shown in the figure. The corresponding position (x) - time (t) is best represented by
 A
A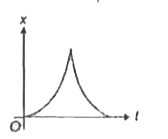 B
B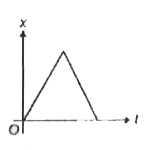 C
C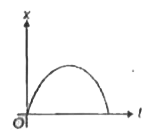 D
D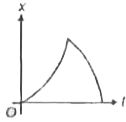
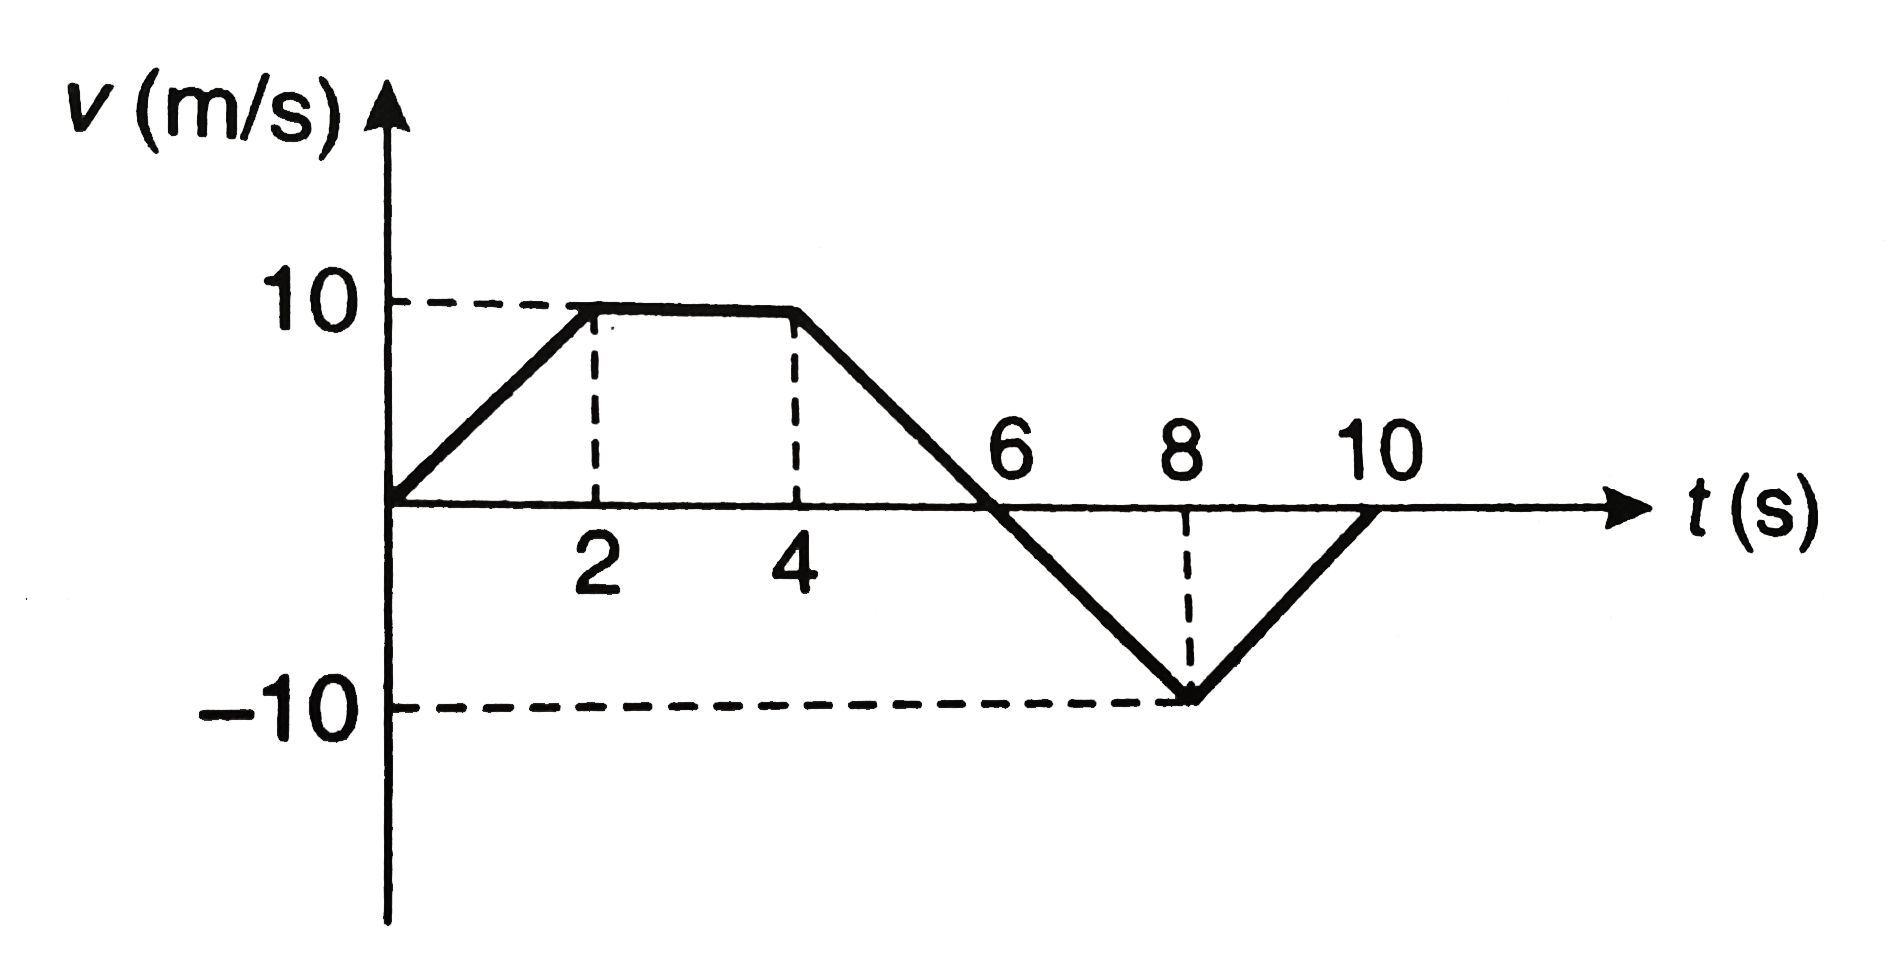
Velocity-time graph of a particle moving in a straight line is shown in figure. At time t=0,s=−10m. Plot corresponding a-t and s-t graphs.
 View Solution
Velocity - time (V–t) graph of a particle moving in a straight line is as shown in the figure. The sign of acceleration in regions OP, PQ, QR and RS respectively are
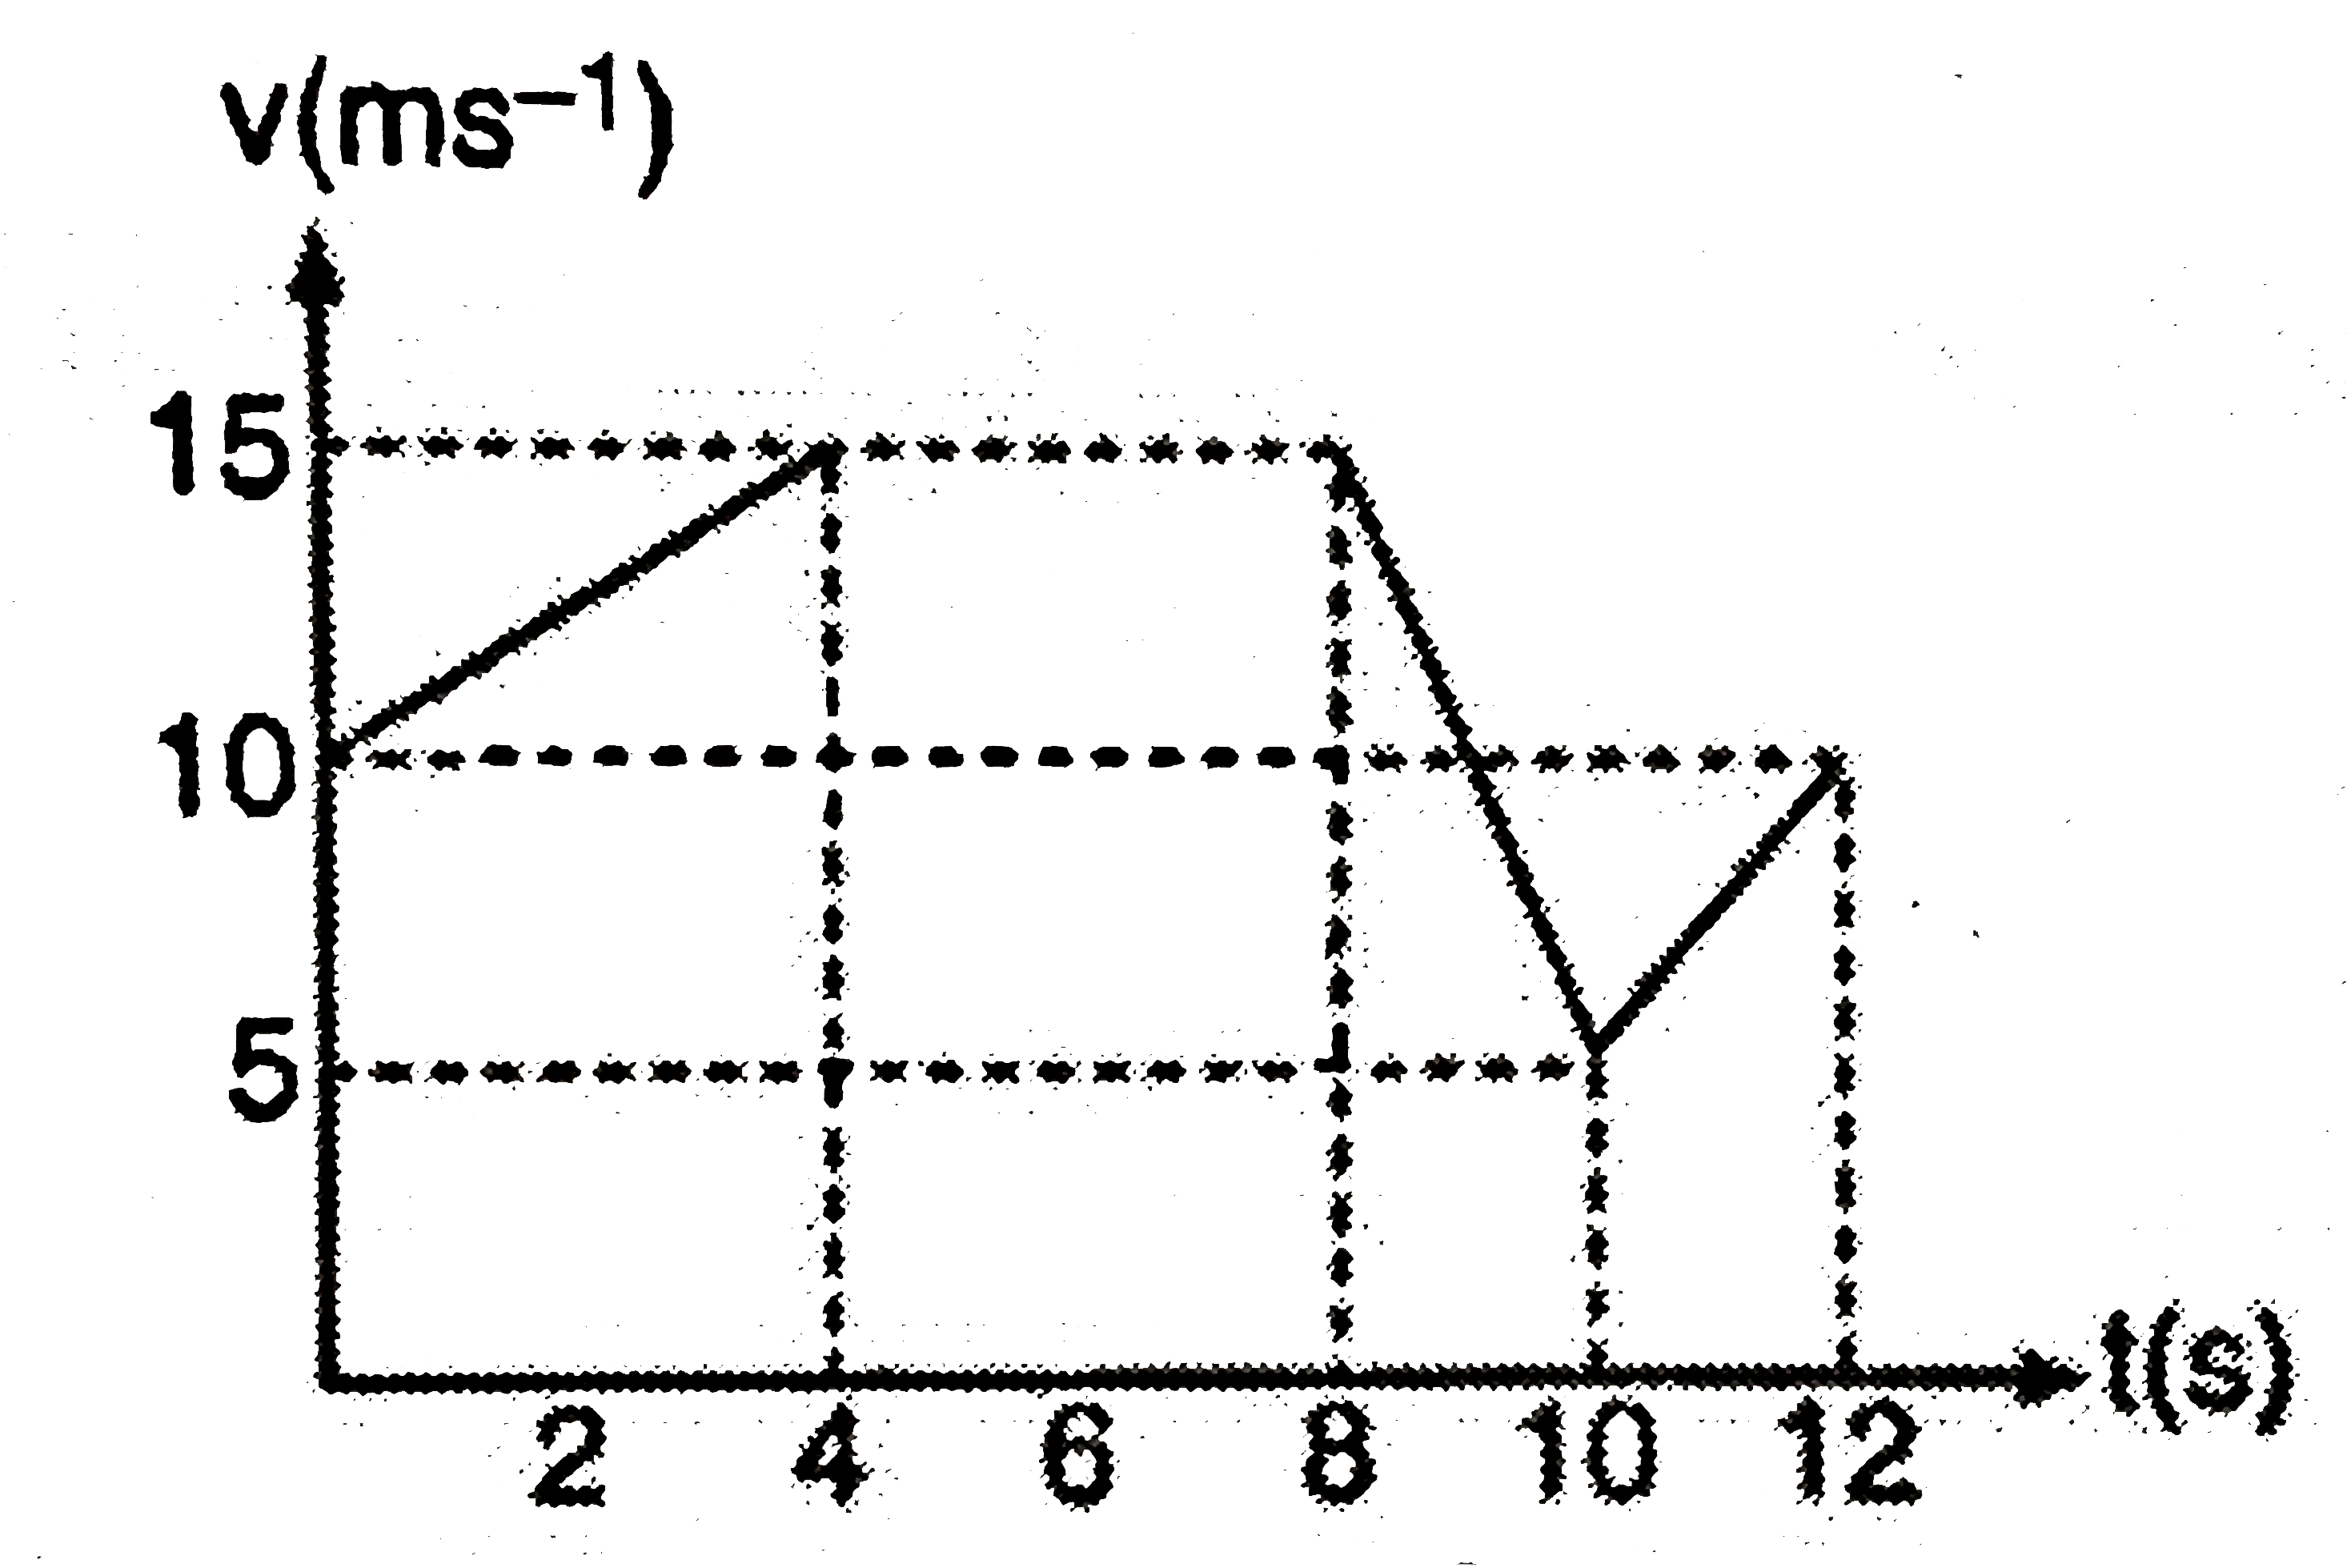
View SolutionThe velocity -time (v−t) graph of a particle moving in a straight line is shown in figure. The acceleration of the particle at t=9 is:
 View Solution
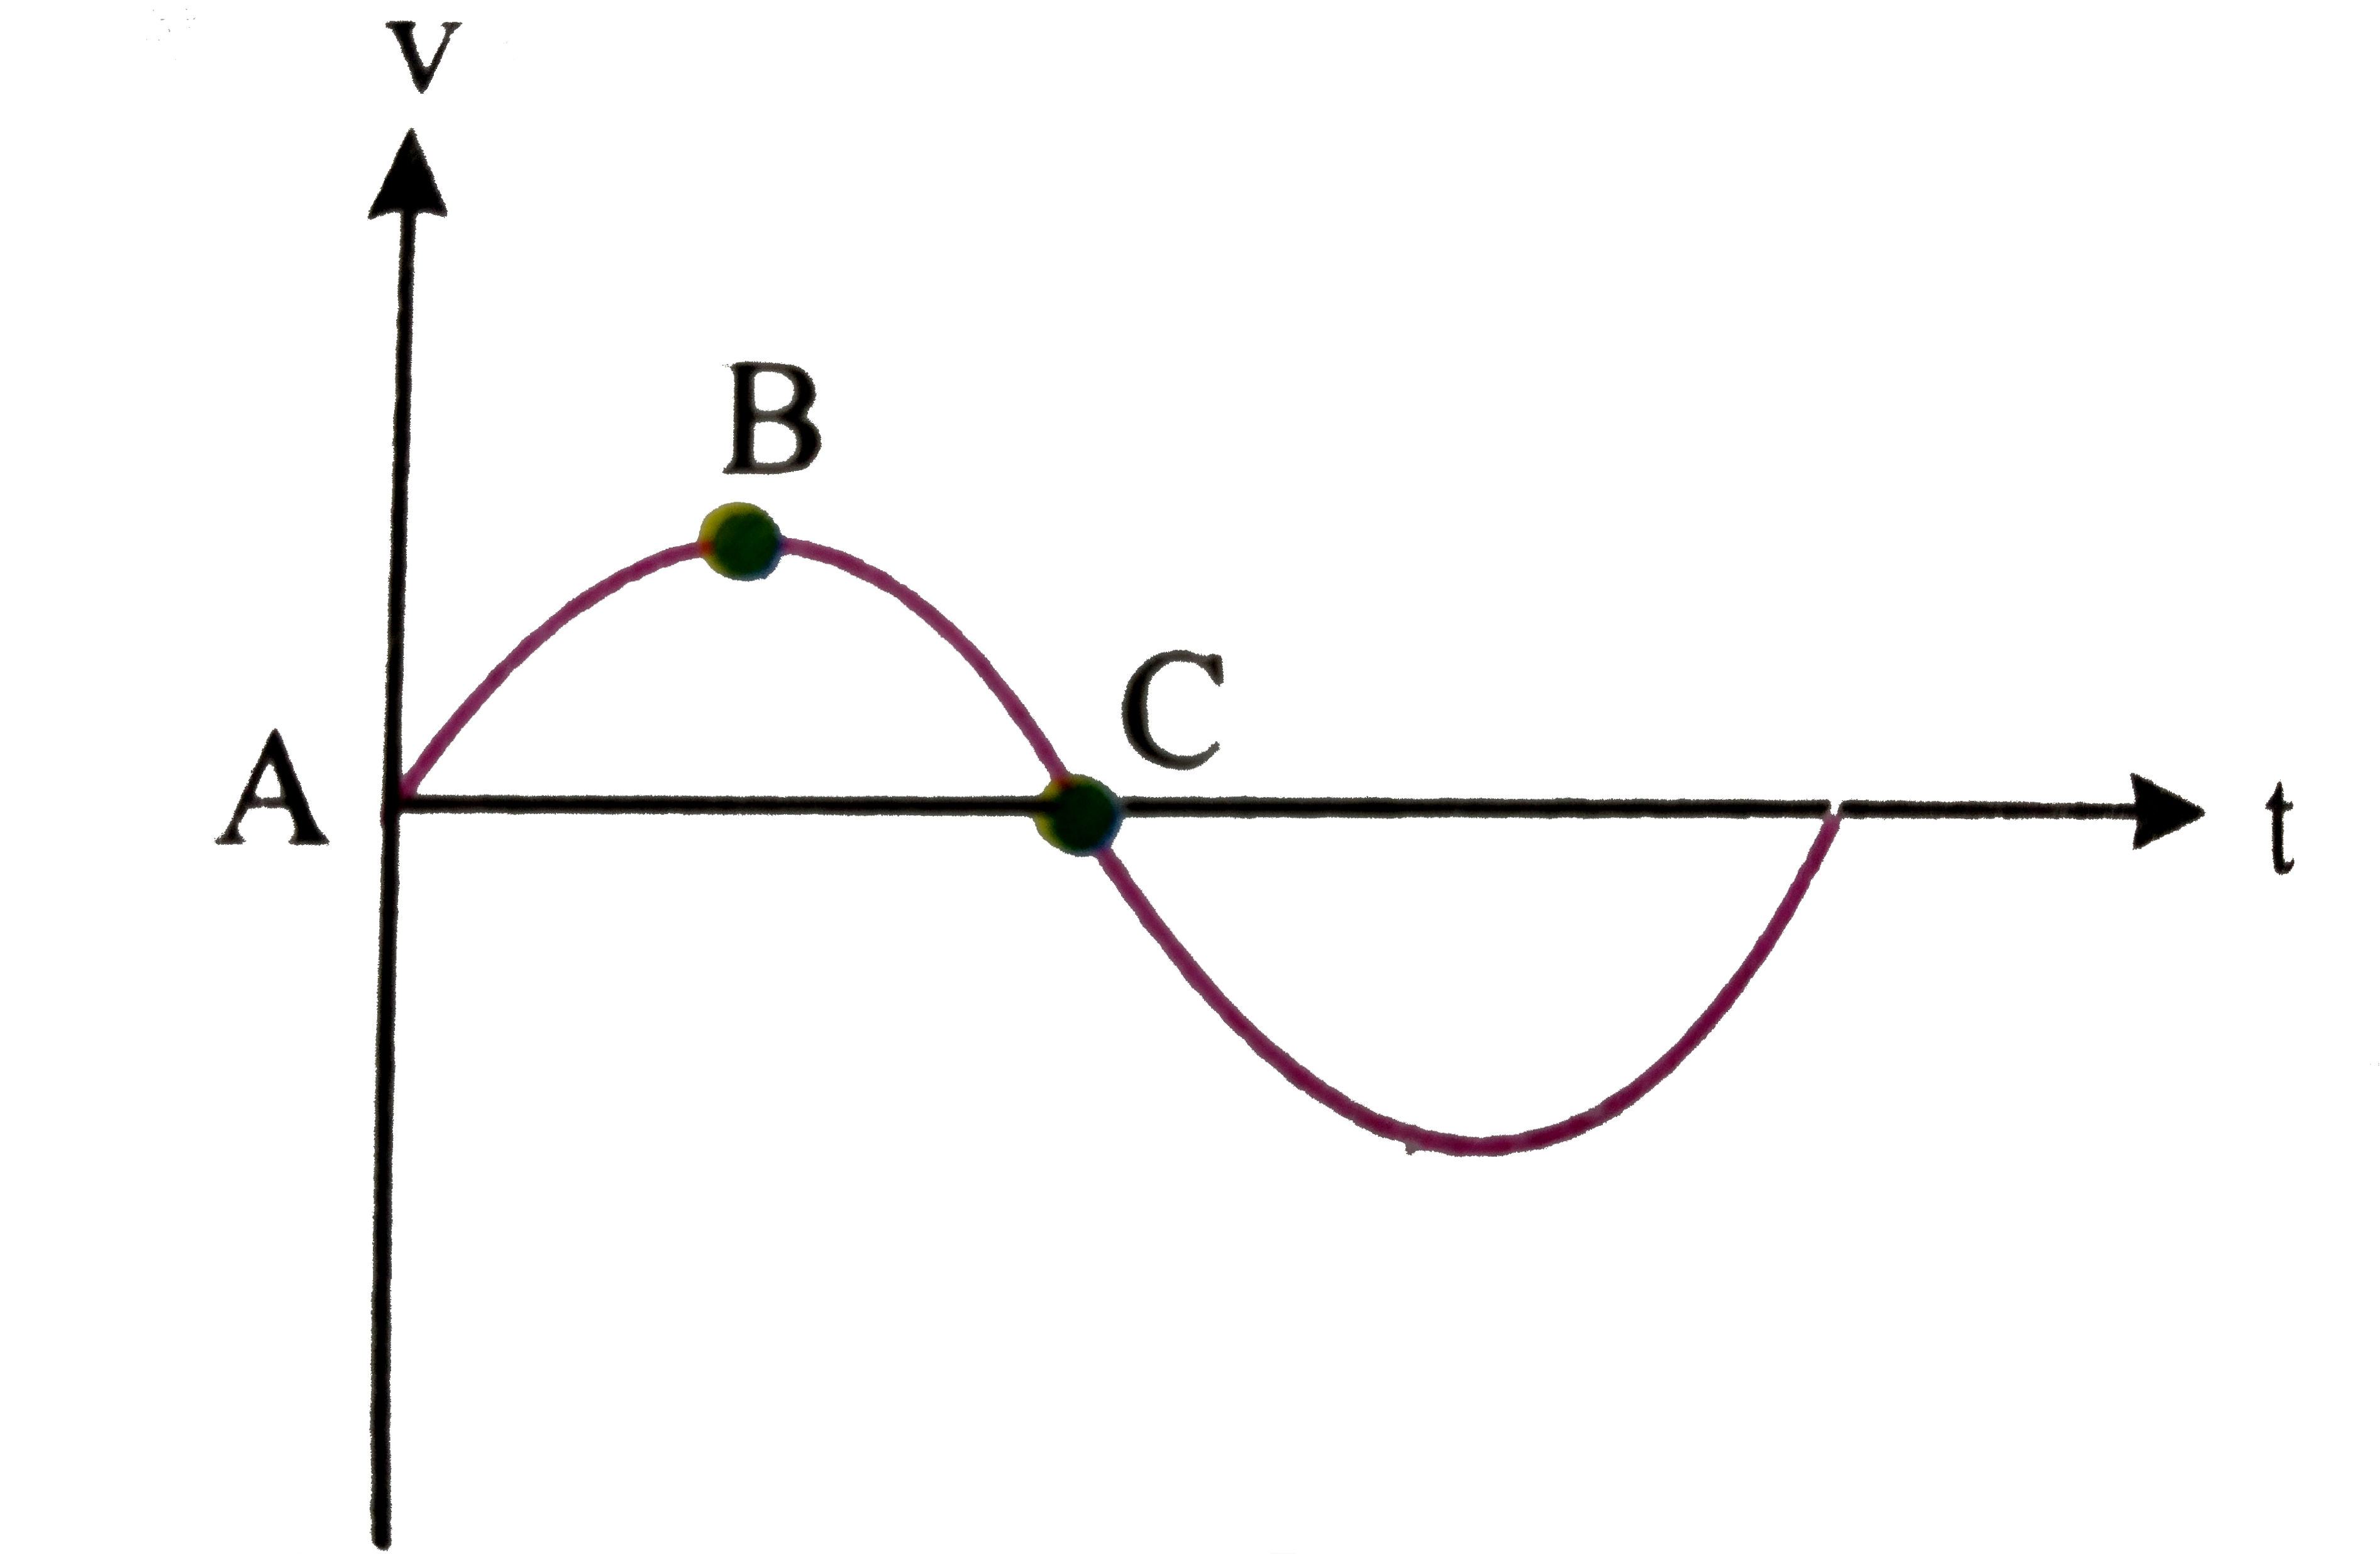
v−t graph of a particle in SHM is as shown is figure. Choose the wrong option.
 View Solution
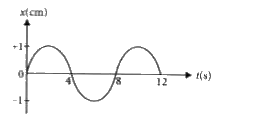
The x-t graph of a particle undergoing SHM is as shown in figure. The acceleration of the particle at t=2/3 is
 View Solution


