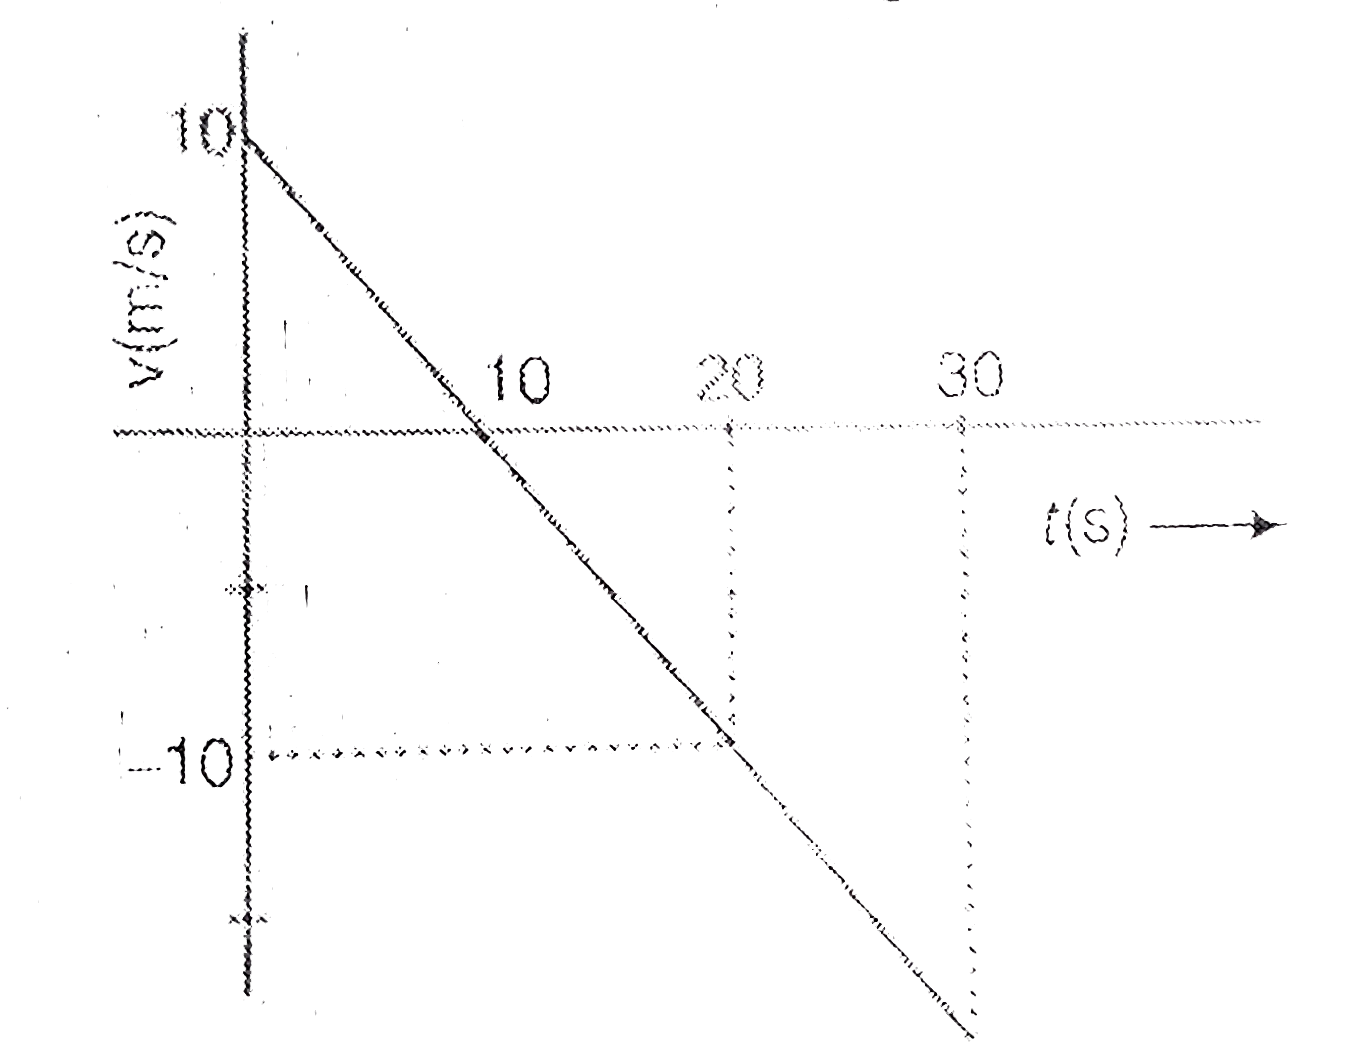
Velocity - time (V–t) graph of a particle moving in a straight line is as shown in the figure. The sign of acceleration in regions OP, PQ, QR and RS respectively are
Step by step video & image solution for Velocity - time (V–t) graph of a particle moving in a straight line is as shown in the figure. The sign of acceleration in regions OP, PQ, QR and RS respectively are by Physics experts to help you in doubts & scoring excellent marks in Class 11 exams.
Similar Questions
Knowledge Check
- Question 1 - Select One or More
Velocity displacement graph of a particle moving in a straight line is as shown in figure.
 Amagnitude of acceleration of particle is decreasingBmagnitude of acceleration of particlre is increasingCacceleration versus displacement graph straight lineDacceleration versus displacement graph is parabola
 - Question 2 - Select One or More
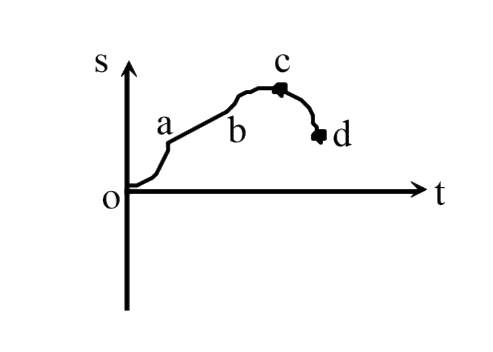
Displacement time graph of a particle moving in a straight line is a shown in figure.
 Ain region A acceleration is positiveBin region B acceleration is negativeCin region C acceleration is positiveDin region D acceleration is negative
 - Question 3 - Select One
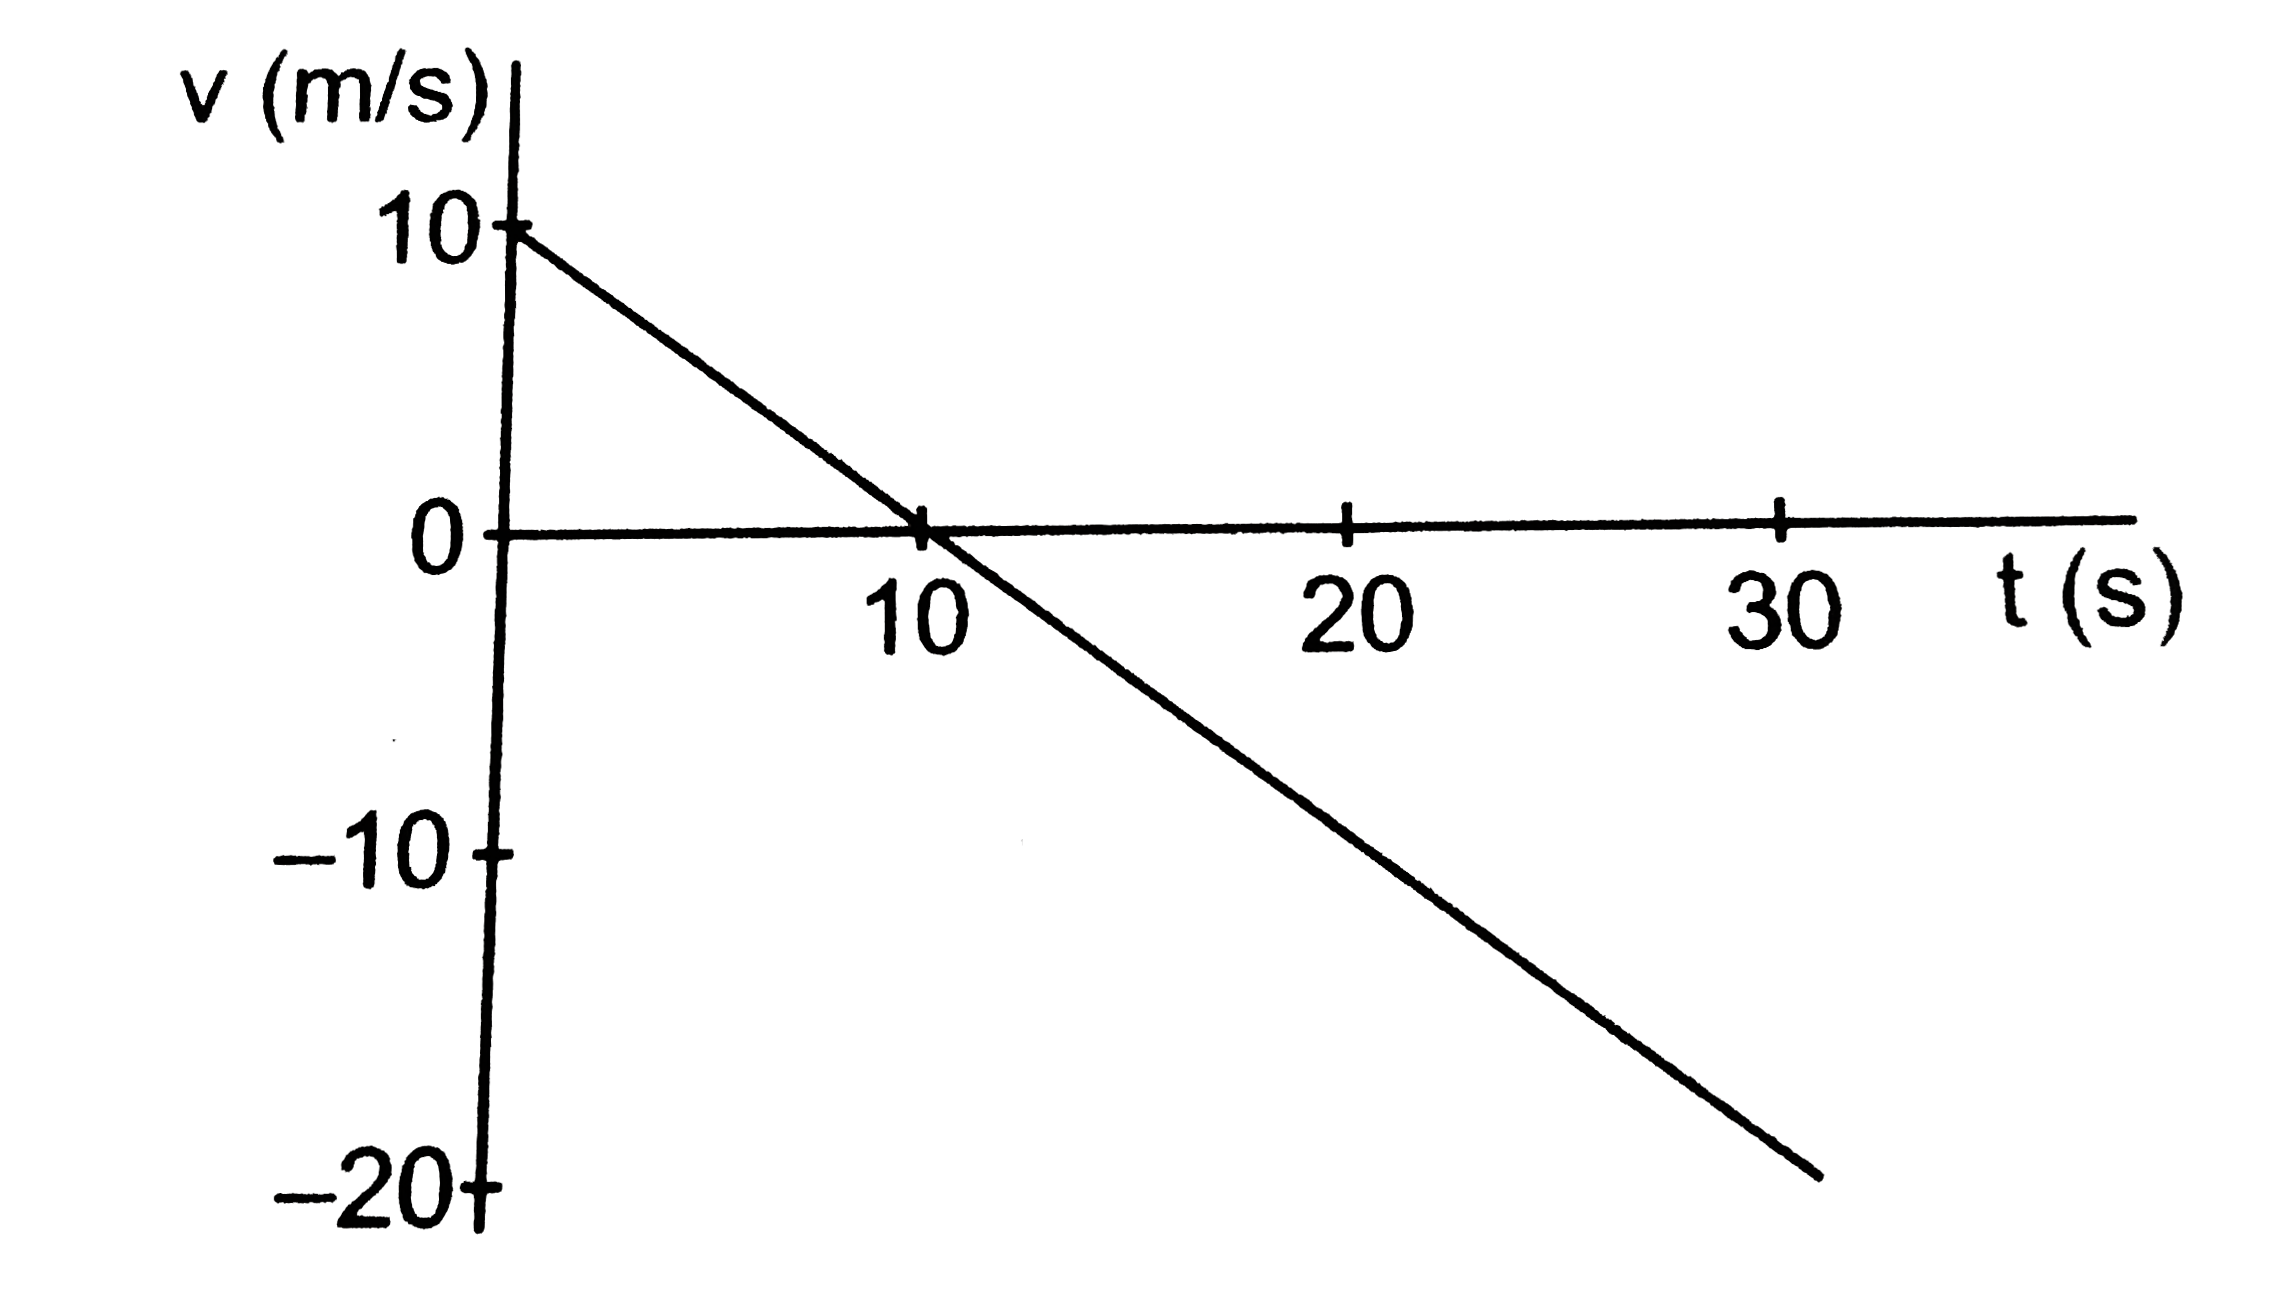
The velocity- time plot for a particle moving on a straight line is shown in the figure
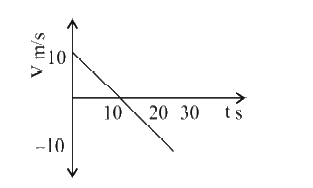 Athe particle has a non uniform accelerationBthe particle has never turned aroundCthe particle has zero displacementDthe average speed in the interval 0 to 10 s is the same as the average speed in the interval 10 s to 20 s
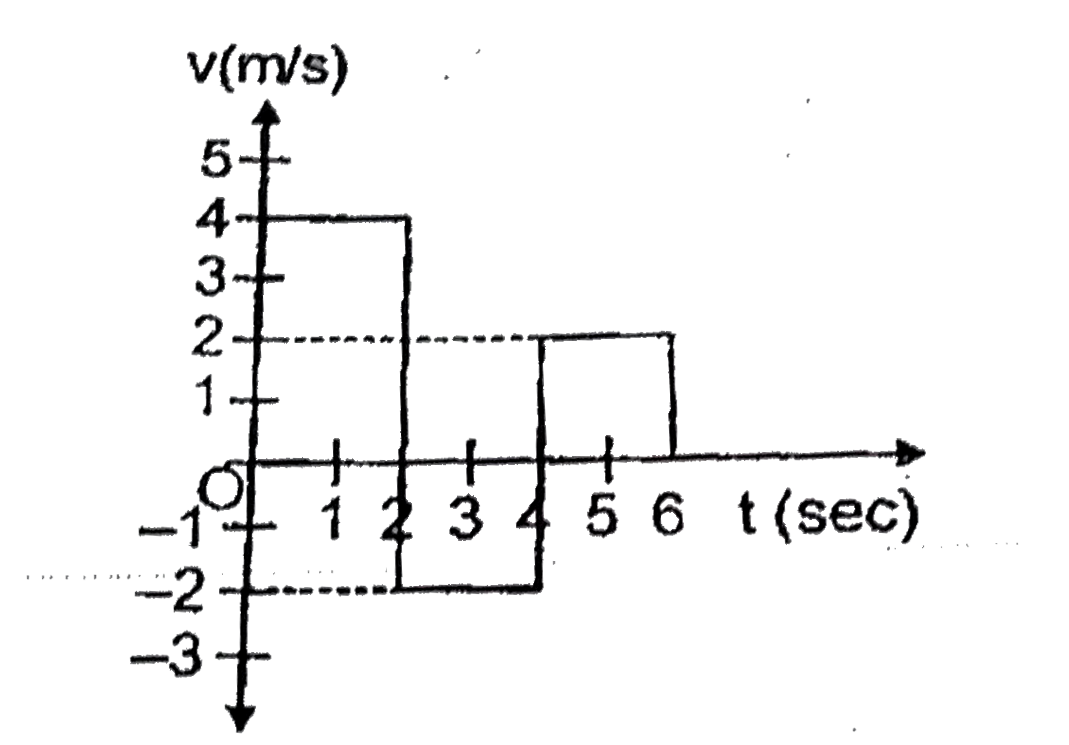
The velocity-time graph of a body moving in a straight line is shown in the figure.
 View Solution
Velocity versus displacement graph of a particle moving in a straight line as shown in figure.
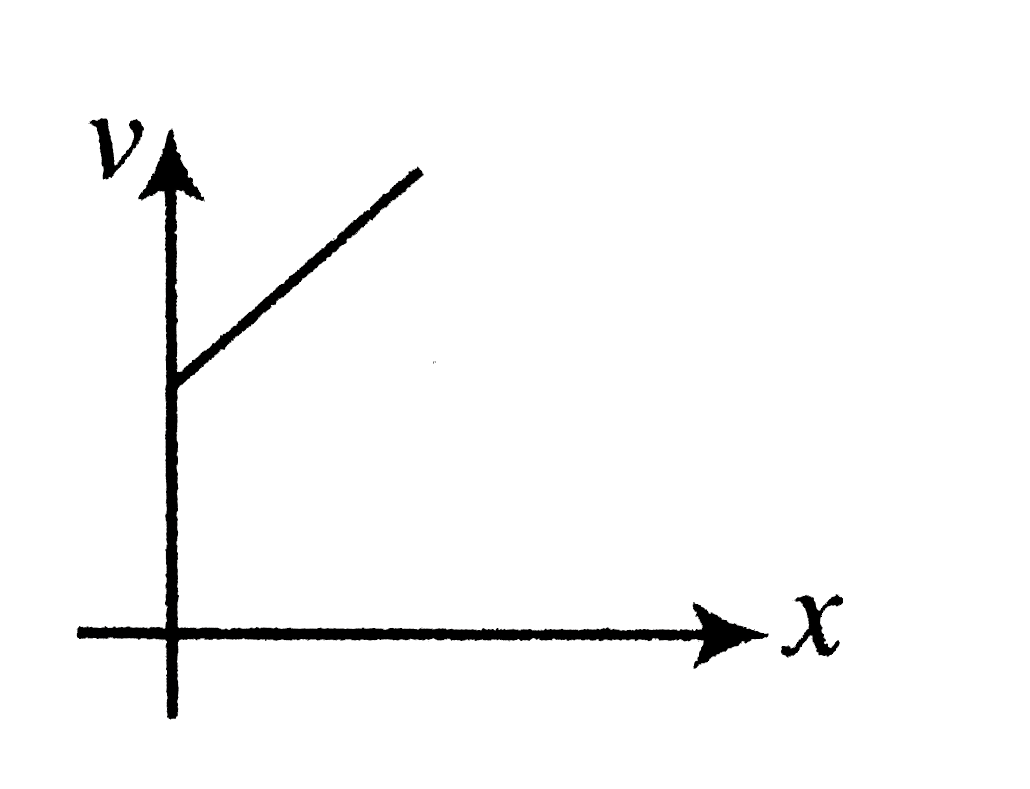
The acceleration of the particle.View SolutionThe velocity time plot for a particle moving on straight line is shown in the figure.
 View Solution
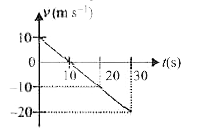
The velocity-time plot for a particle moving on a straight line is shown in figure.
 View Solution
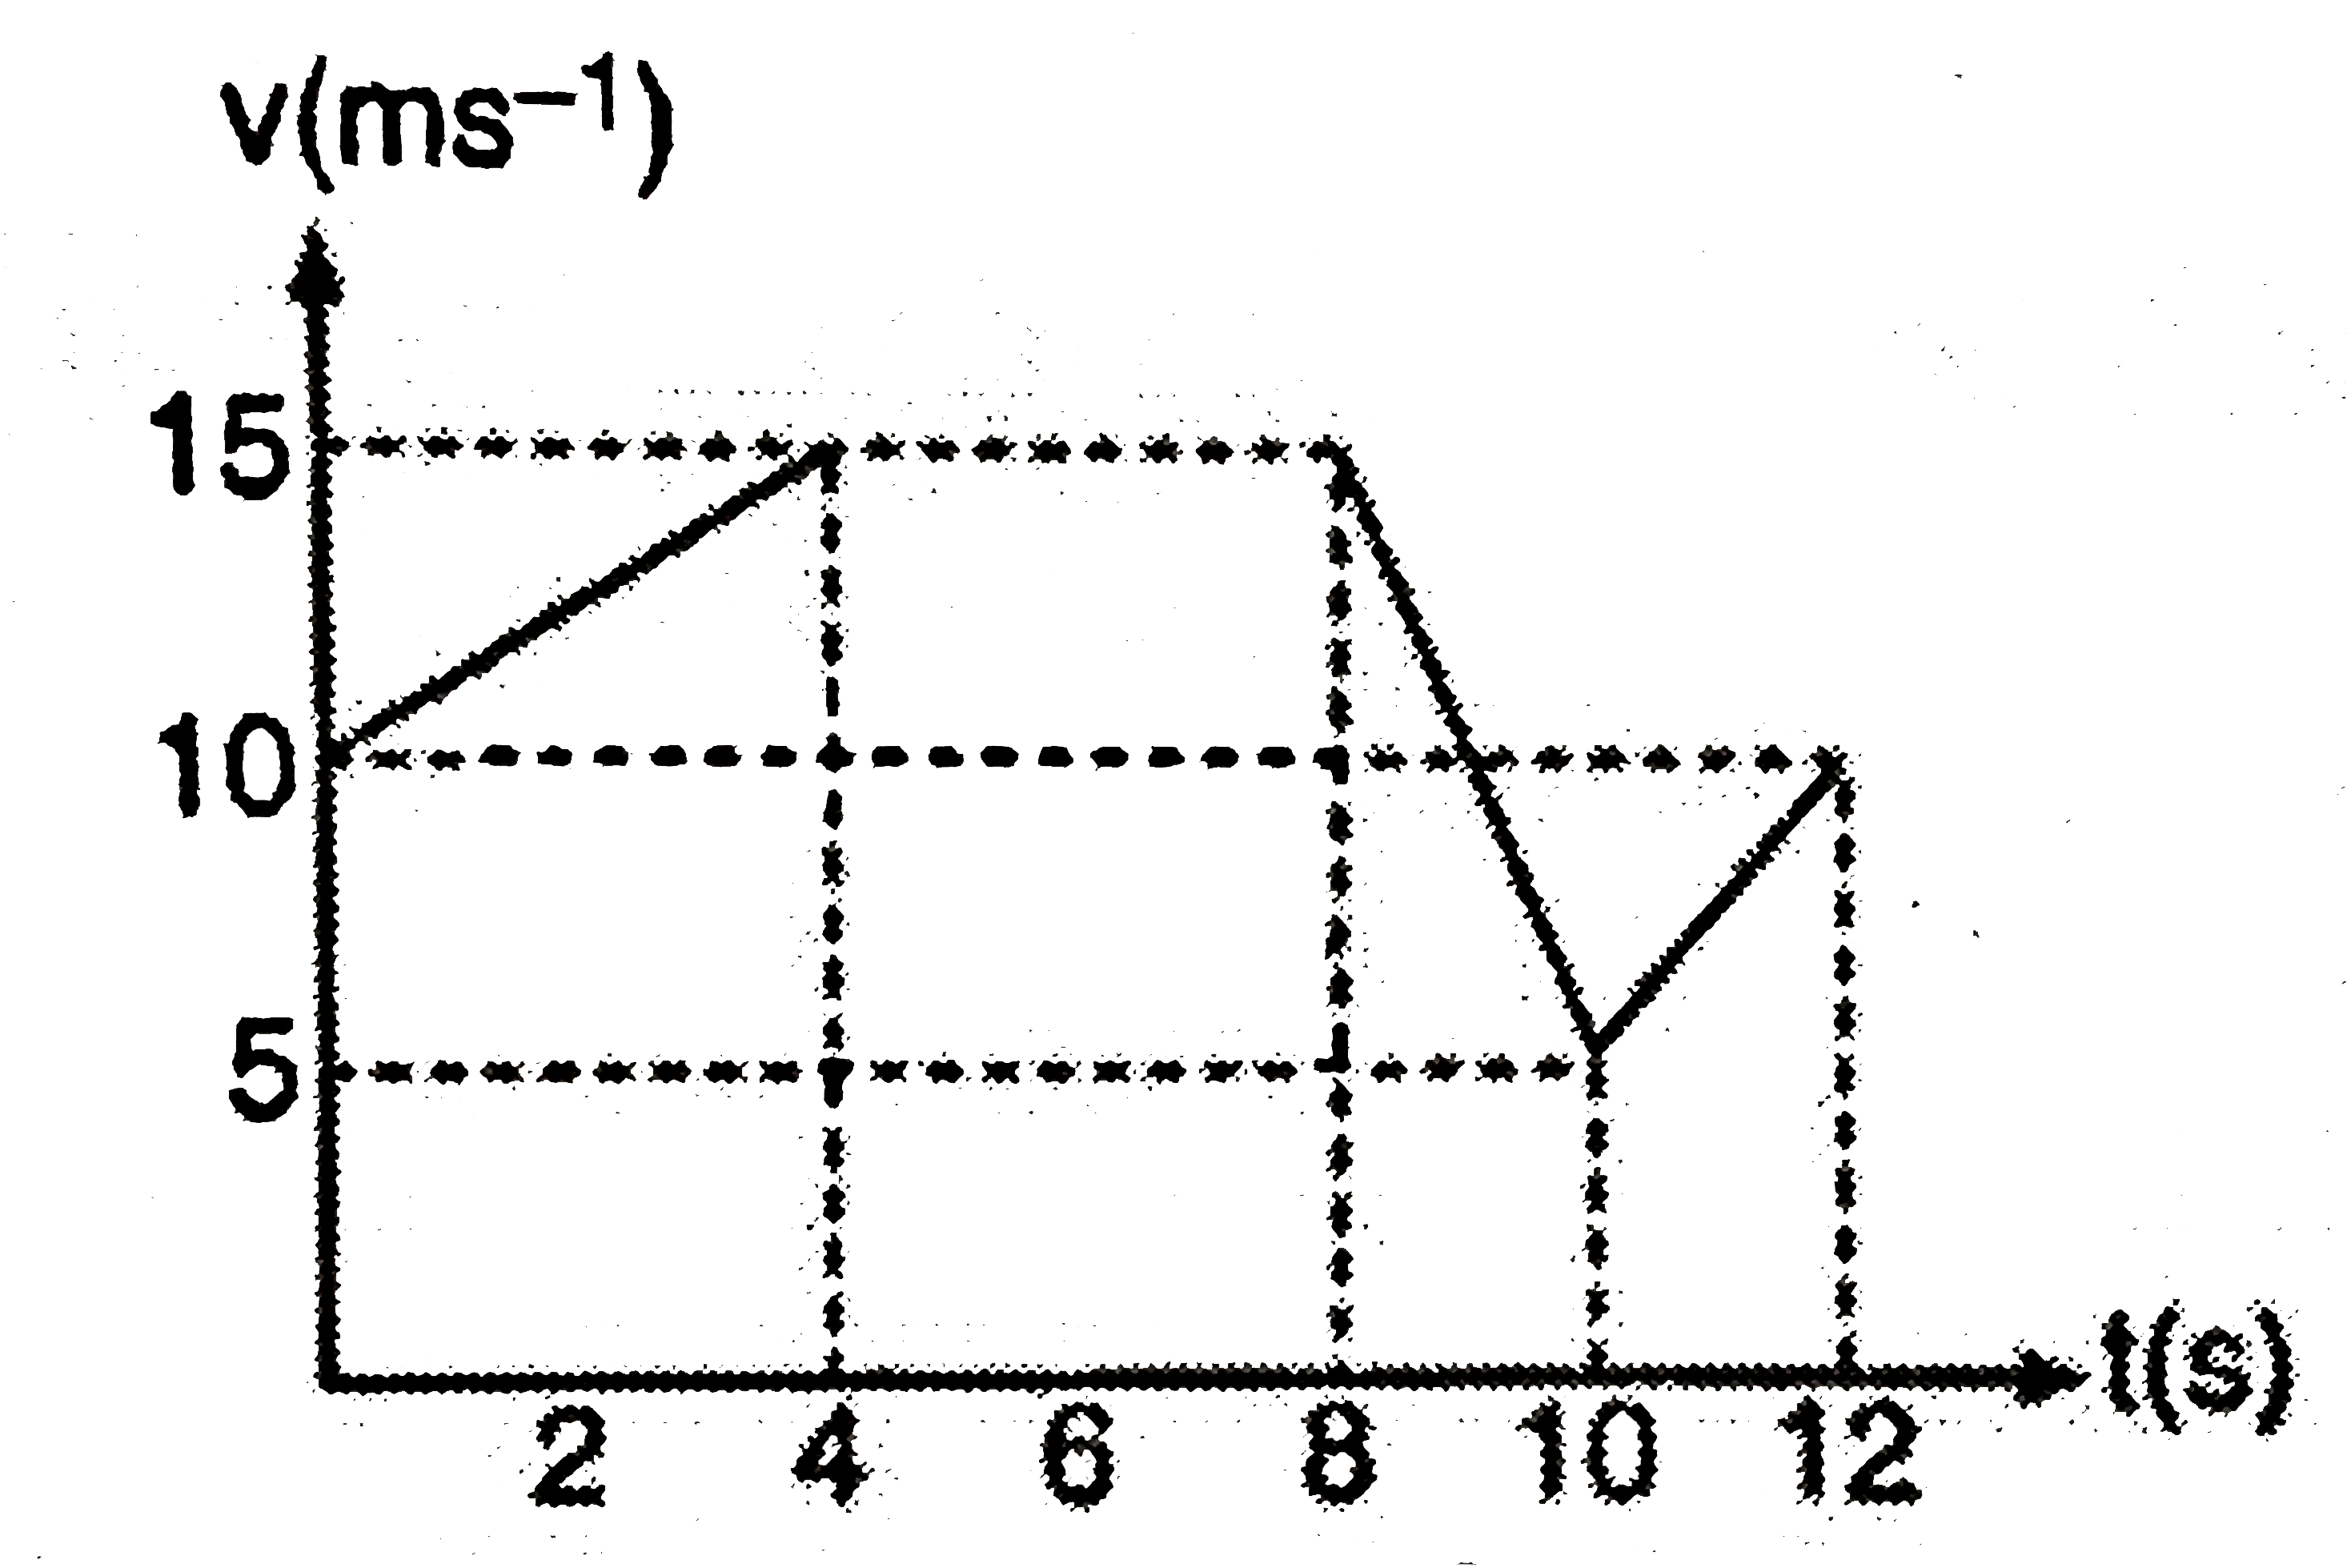
The velocity -time (v−t) graph of a particle moving in a straight line is shown in figure. The acceleration of the particle at t=9 is:
 View Solution

