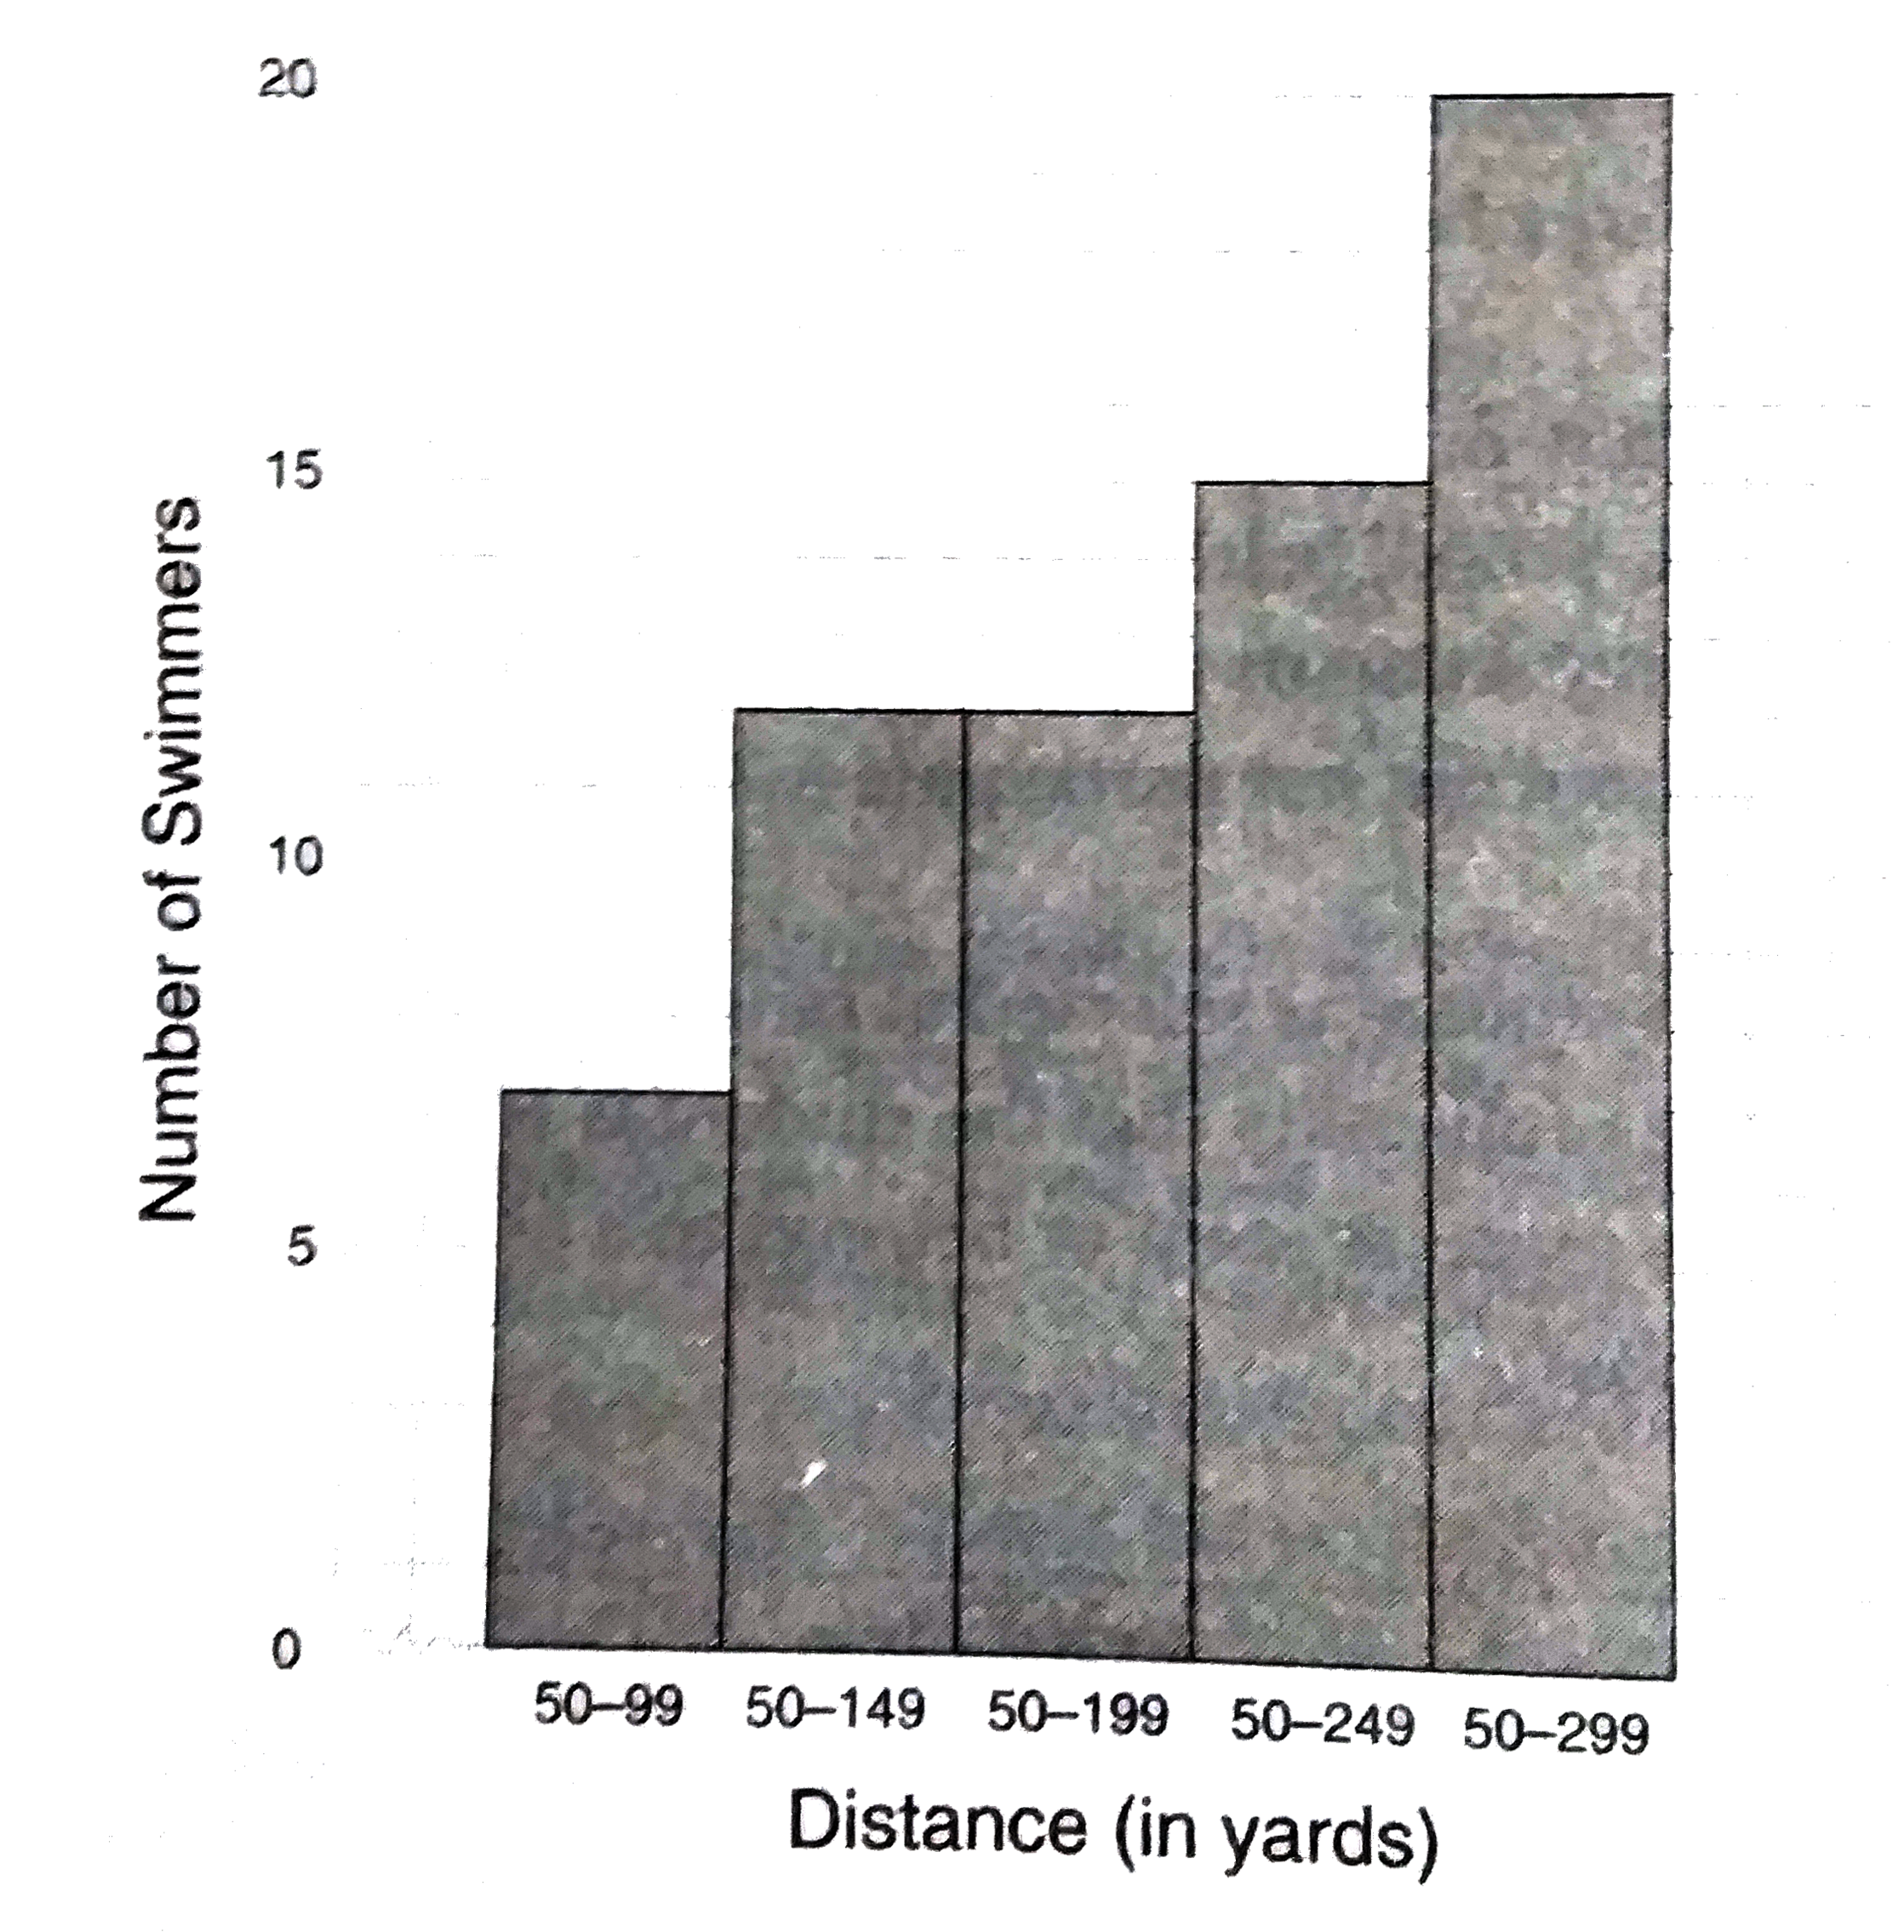
Based on the comulative histogram above, what percent of the total number of swimmers swam between 200 and 249 yards?
The correct Answer is:
Step by step video, text & image solution for Based on the comulative histogram above, what percent of the total number of swimmers swam between 200 and 249 yards? by Maths experts to help you in doubts & scoring excellent marks in Class 12 exams.
Topper's Solved these Questions
- BOOK - ENGLISH SATCHAPTER - PROBLEM SOLVING AND DATA ANALYSISEXERCISE - Multiple Choice128videos
PROBLEM SOLVING AND DATA ANALYSIS
- BOOK - ENGLISH SATCHAPTER - PROBLEM SOLVING AND DATA ANALYSISEXERCISE - EXERICSE80videos
PROBLEM SOLVING AND DATA ANALYSIS
- BOOK - ENGLISH SATCHAPTER - PROBLEMS IN CONTEXT EXERCISE - PRACTICE TEST10videos
PROBLEMS IN CONTEXT
Similar Questions
A certain school has 300 students, 142 of whom are boys. It has 30 teachers, 12 of whom are men. What percent of the total number of students and teachers in the school is female?
View SolutionThe following graph shows the breakup of the type of employees of company Z form 1997 - 2000, Managerial , Staff, Unskilled and Temporay .
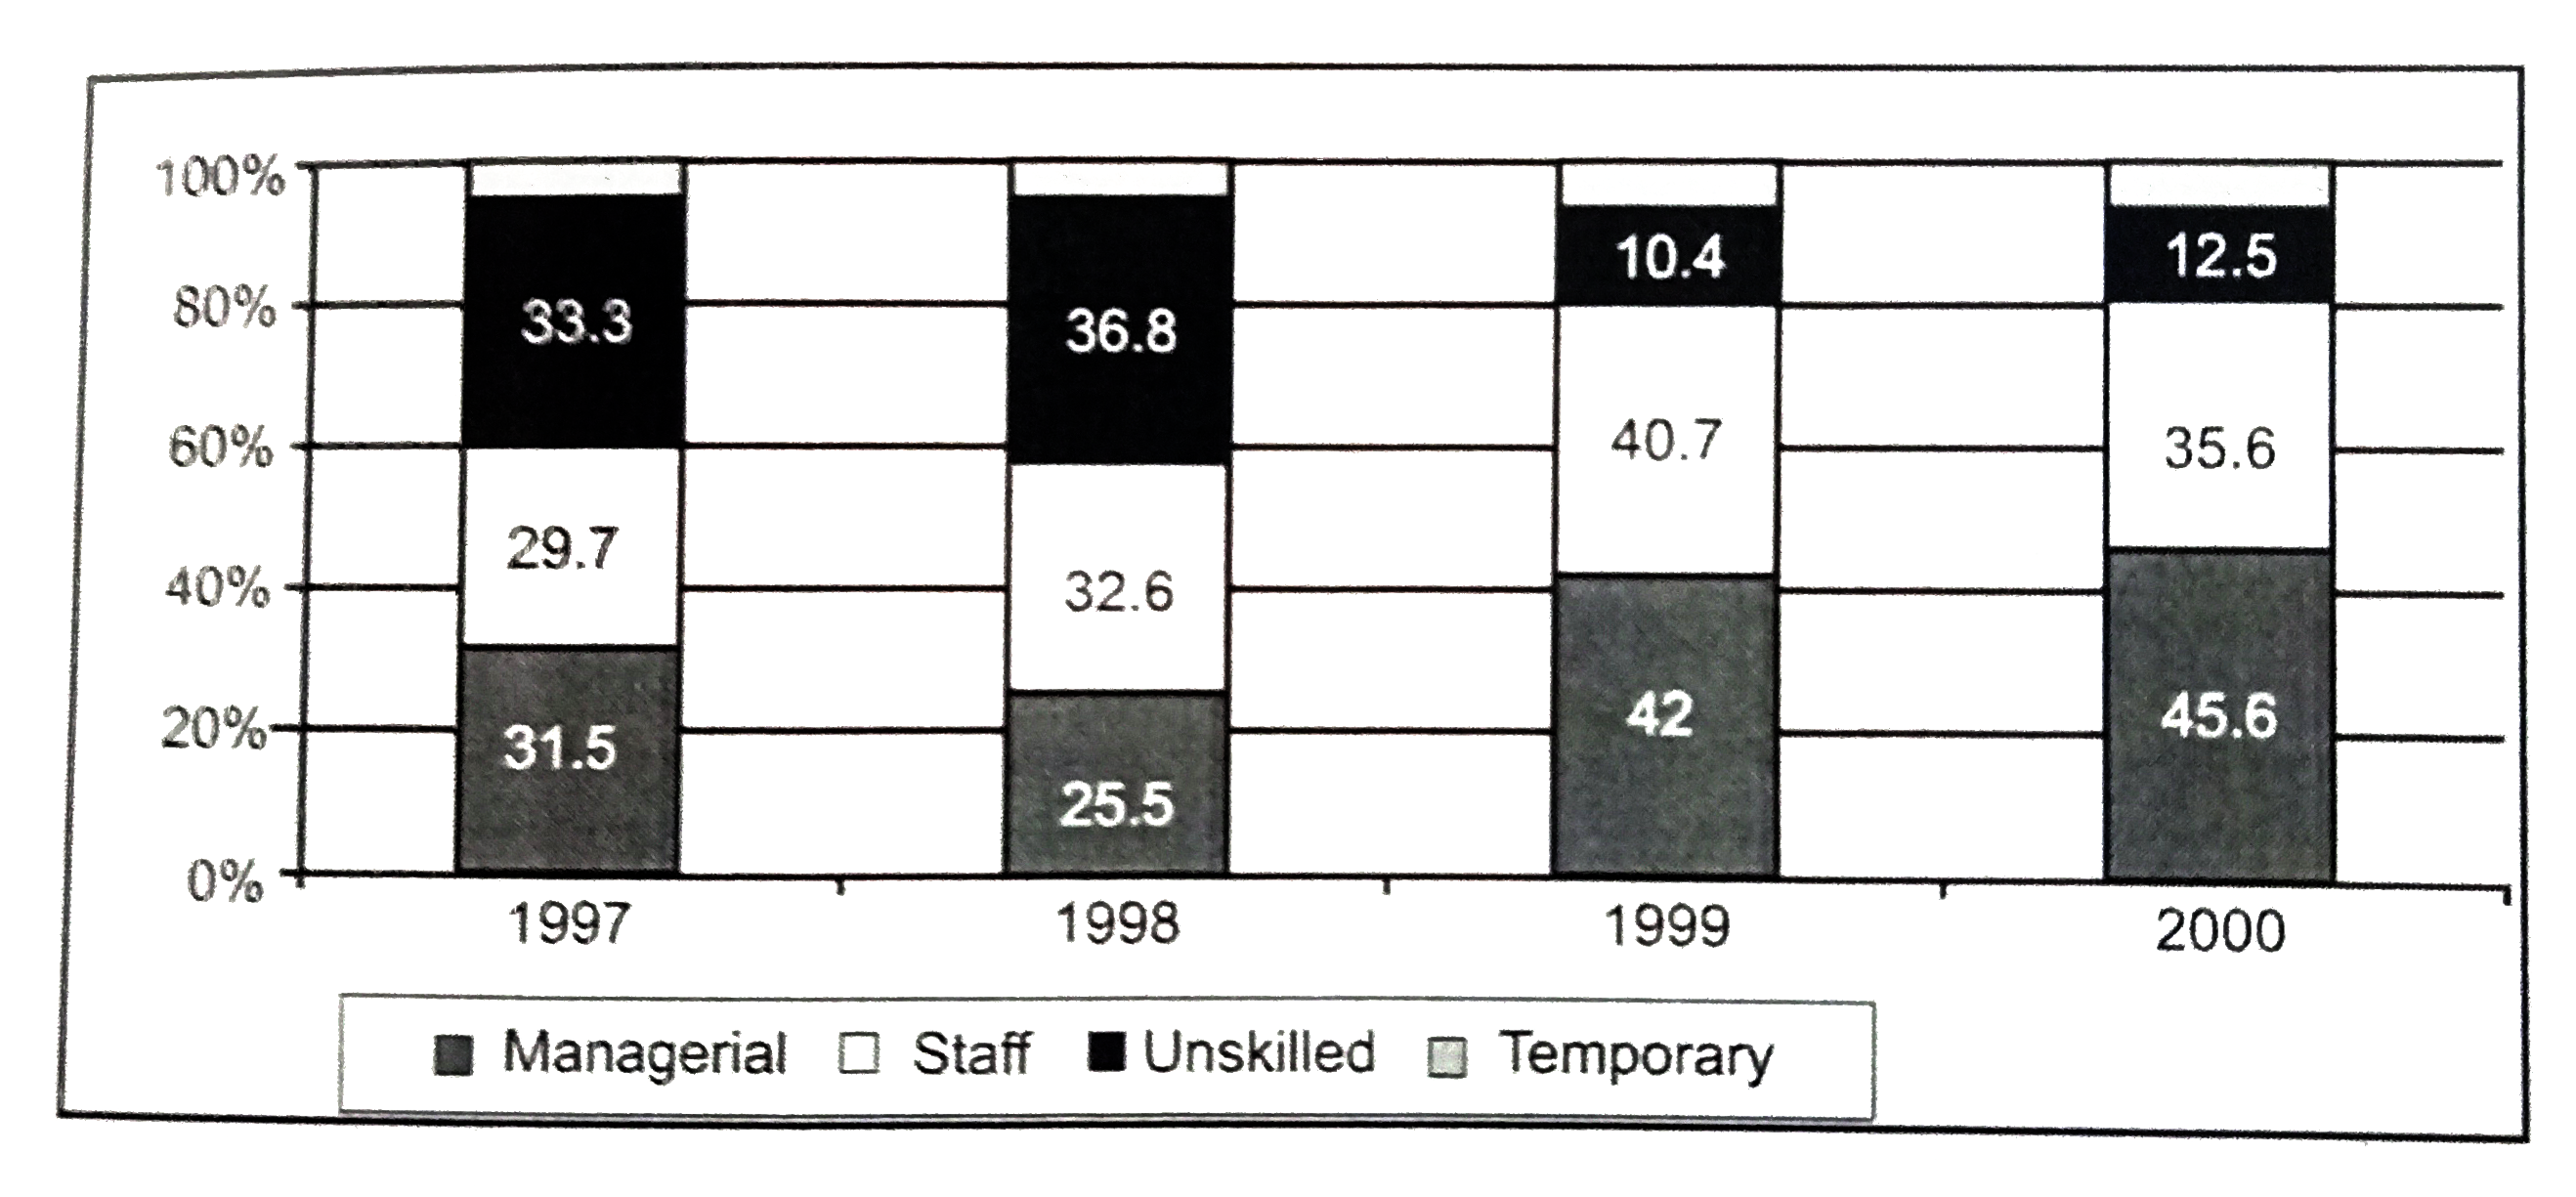
If the total number of employees remained the same throughout, what is the approxmiate percent increase in the number of staff employees between 1997 and 1998 ?View Solution
Knowledge Check
- Question 1 - Select One
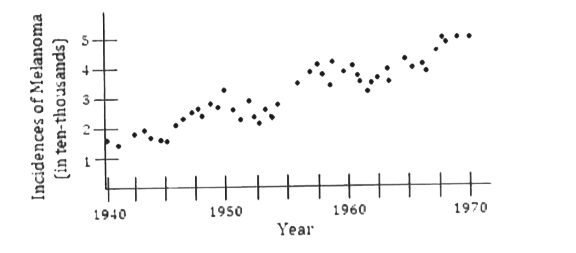
The scatterplot above shows the numbers of people diagnosed with melanoma, in ten - thousands, from 1940 to 1970. Based on the data shown in the figure, which of the following values is closest to the range of the number of incidences of melanoma between 1945 and 1950?A5000B10000C17000D36000 - Question 2 - Select One
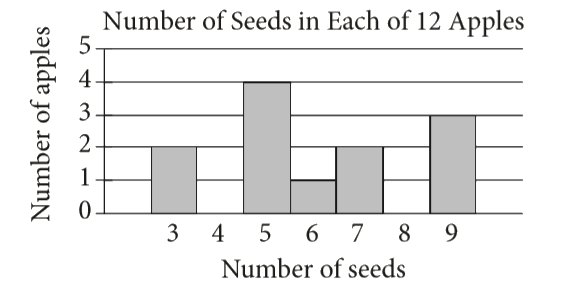
Based on the histogram above, of the following, which is closest to the average (arithmetic mean) number of seeds per apple?A4B5C6D7 - Question 3 - Select One
A2 litre vessel is filled with air at 50∘C and pressure of 3 atm. The temperature is now raised to 200∘C A valve is now opened so that the pressure inside drops to one atm What fraction of the total number of moles, inside escaped on openig the valve ? Assume no change in the volume of the container .
A7.7B9.9C8.9D0.77

A magnet school is a free public school that has a fused theme. According to the table above, what was the increase in the total number of graduates in five of these magnet schools in District 1 from 2013 to 2014?View Solution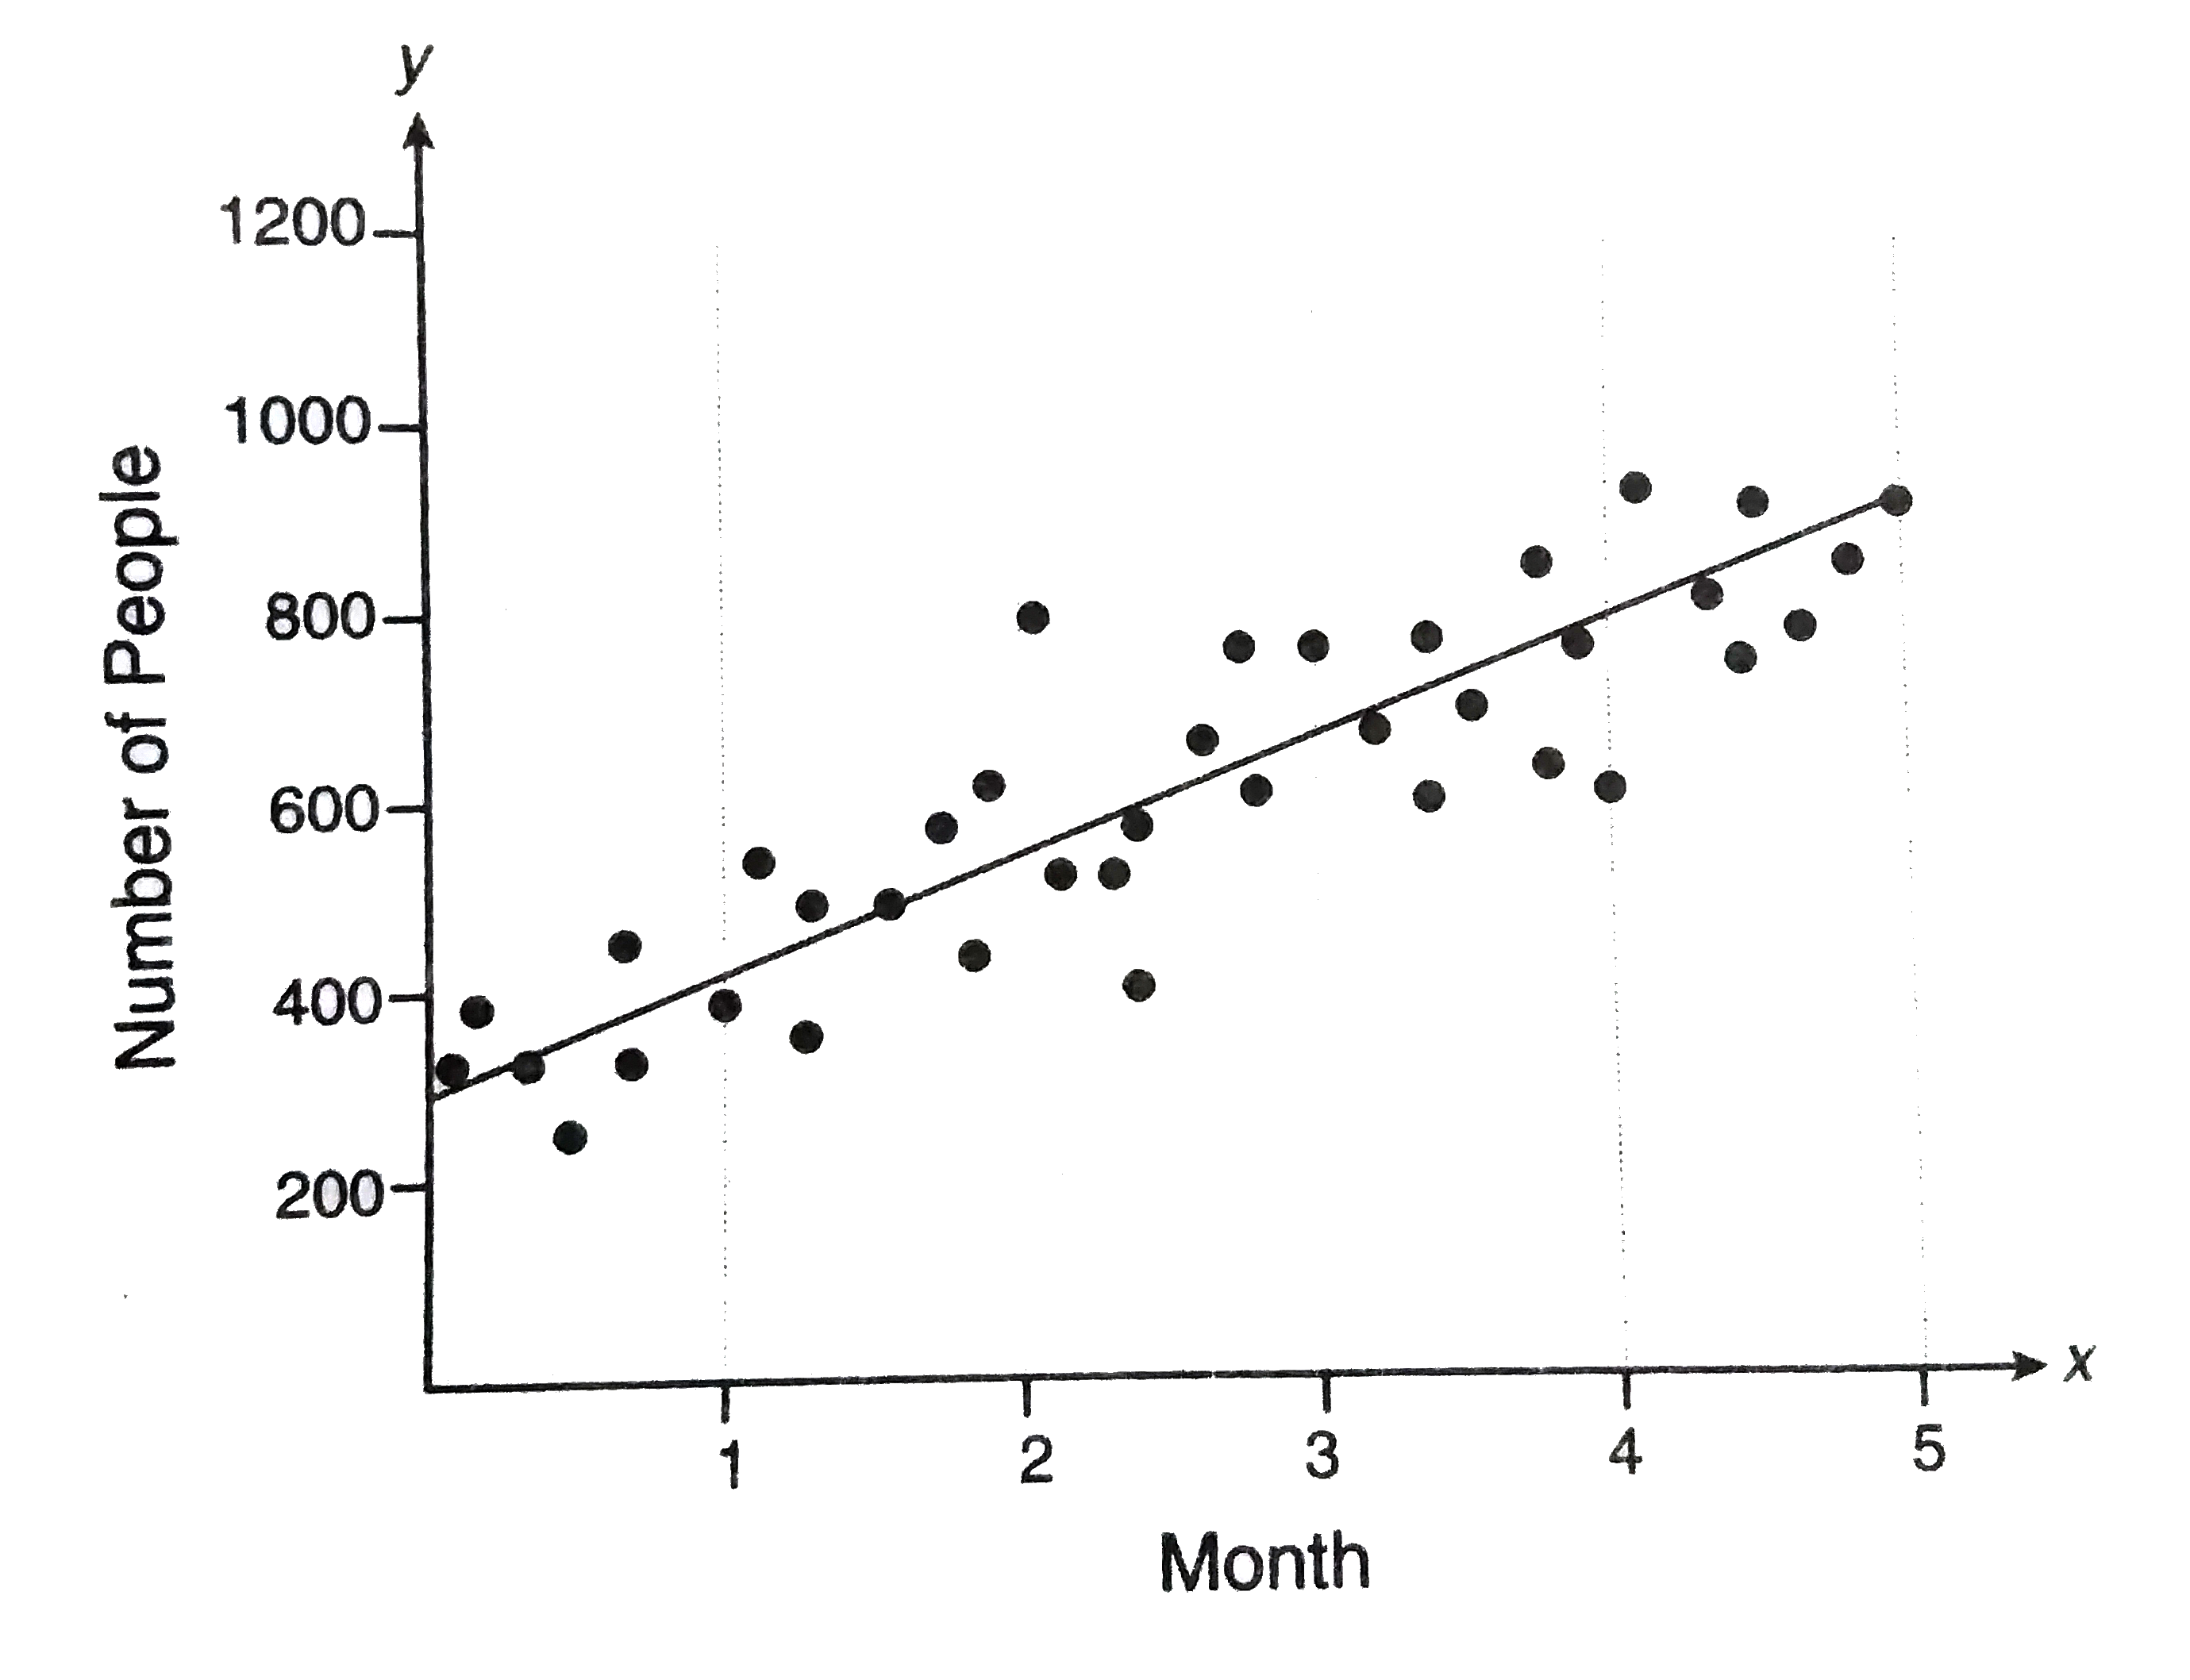
A new fitness class was started at several fitness clubs owned by the same company. The scatterplot shows the total number of people attending the class during the first five months in which the class was offered. The line of best fit is drawn.
Q. For month 4, the predicted number of people attending the class was approximately what percent greater than the actual number of people attending the class?View SolutionThe following table gives the number of households in USA during 2000-2014.
The following charts give the distribution of households based on the numbers of children for the years 2000 and 2014.

The following charts give the distribution based on the number of childre for the year 2000 and 2014.
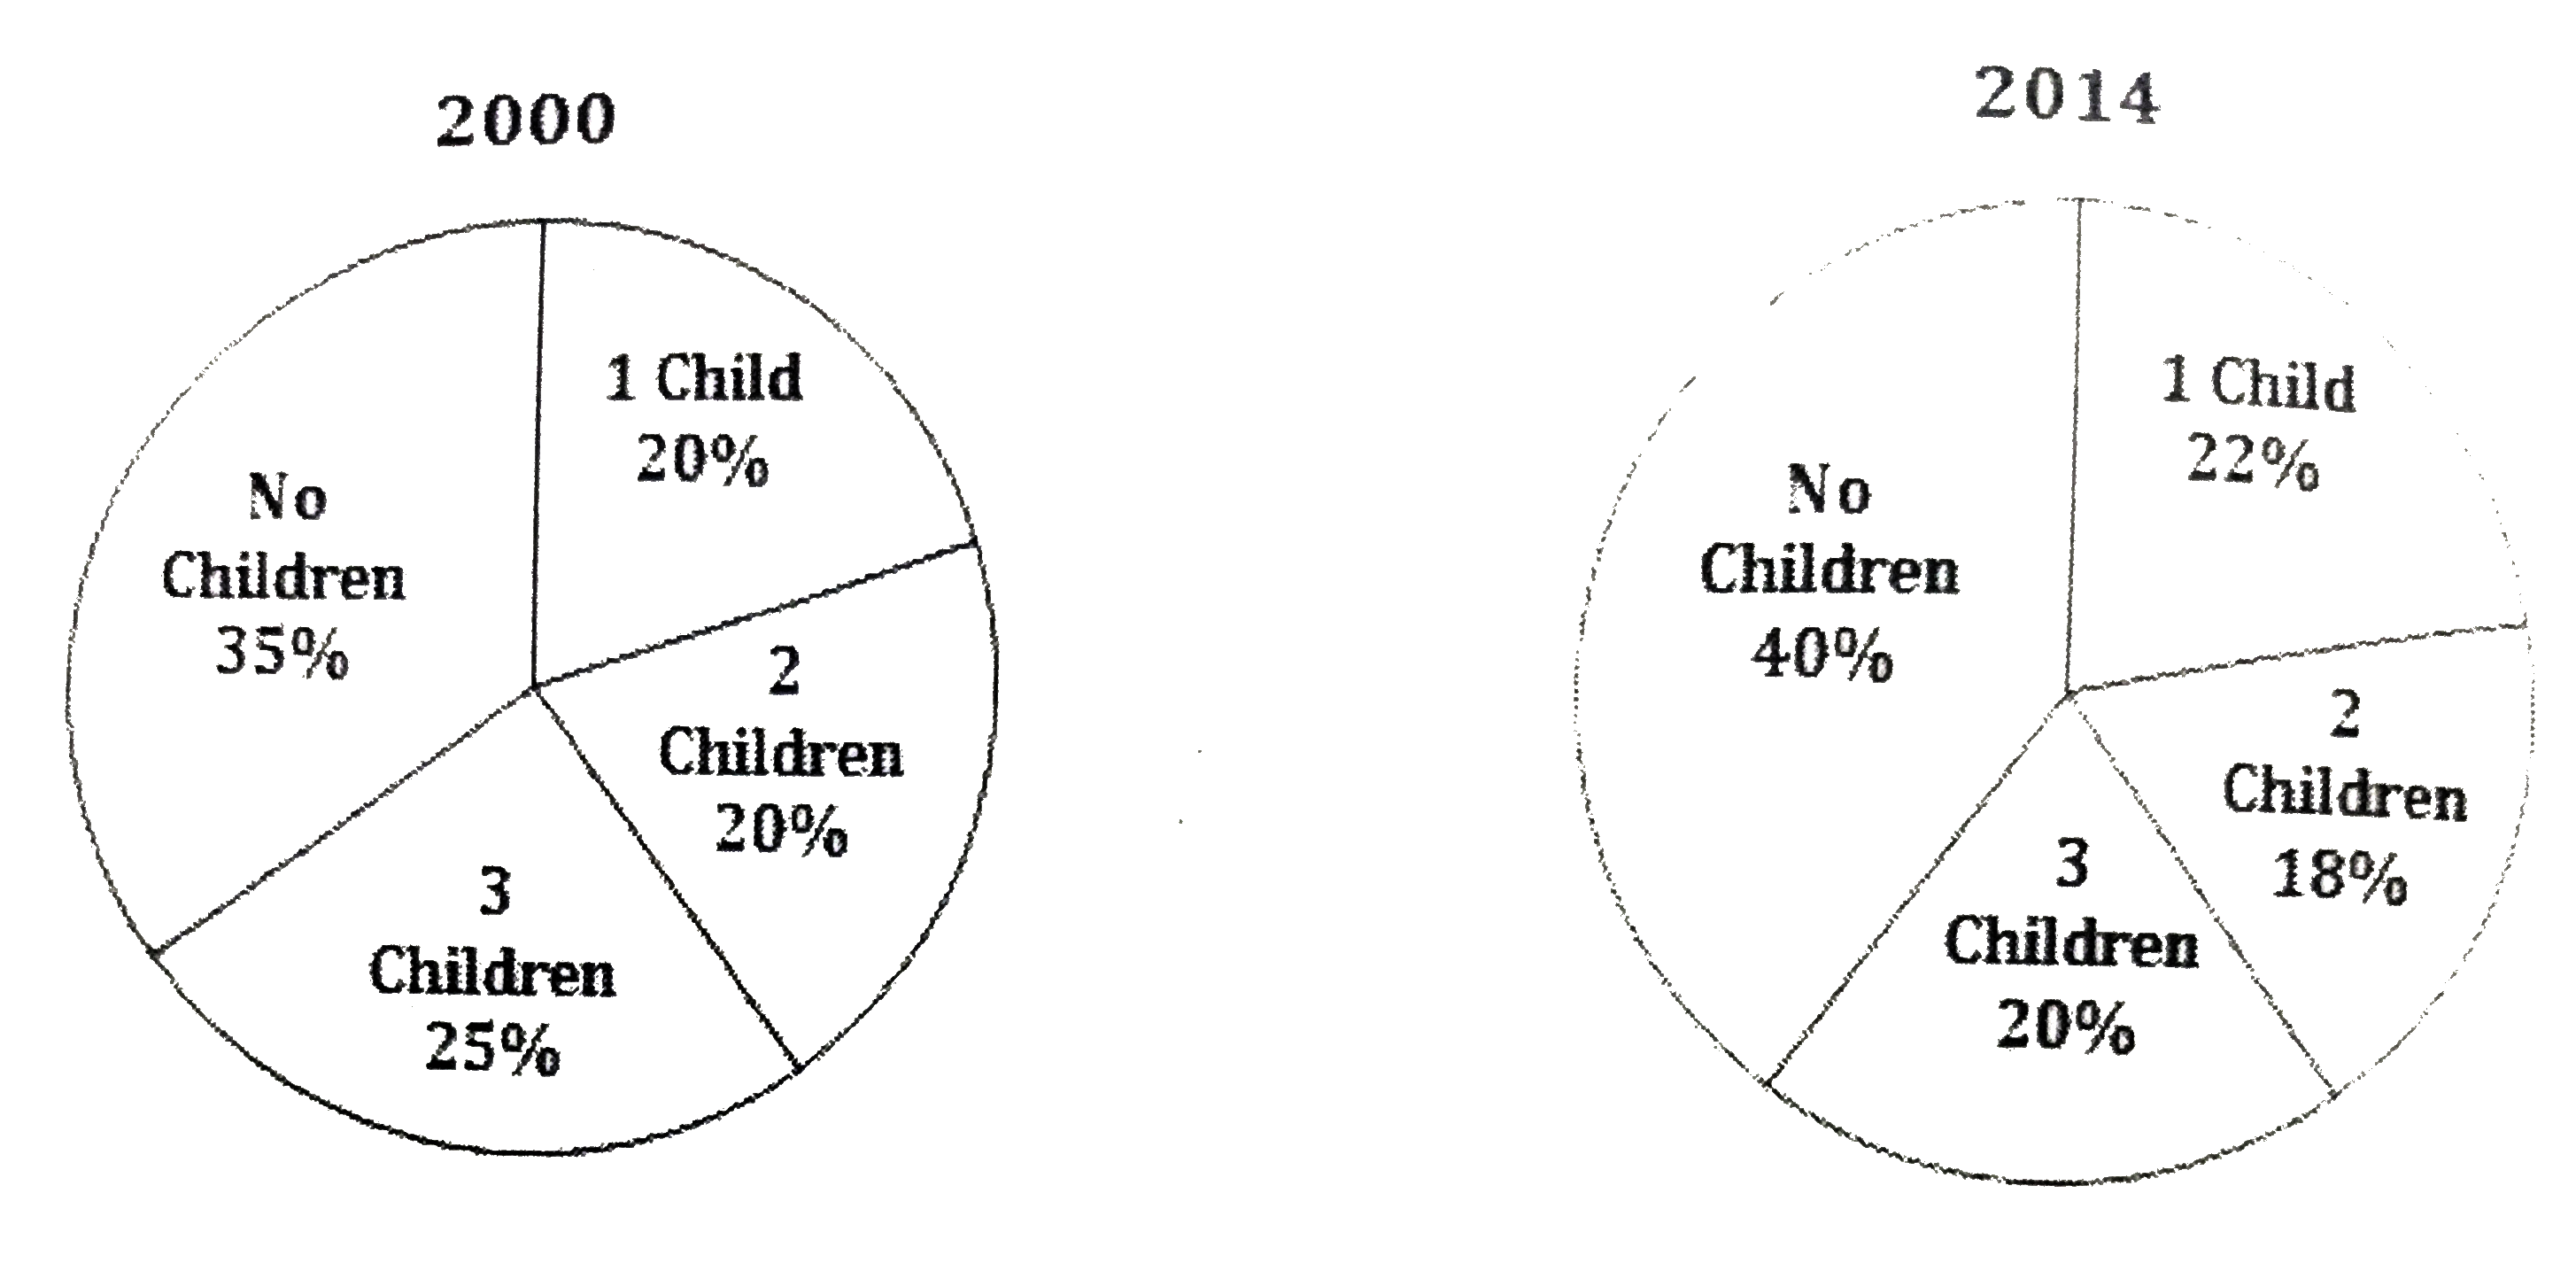
What is the total number of children in 2014?View SolutionThe following table gives the number of households in USA during 2000-2014.
The following charts give the distribution of households based on the numbers of children for the years 2000 and 2014.

The following charts give the distribution based on the number of childre for the year 2000 and 2014.
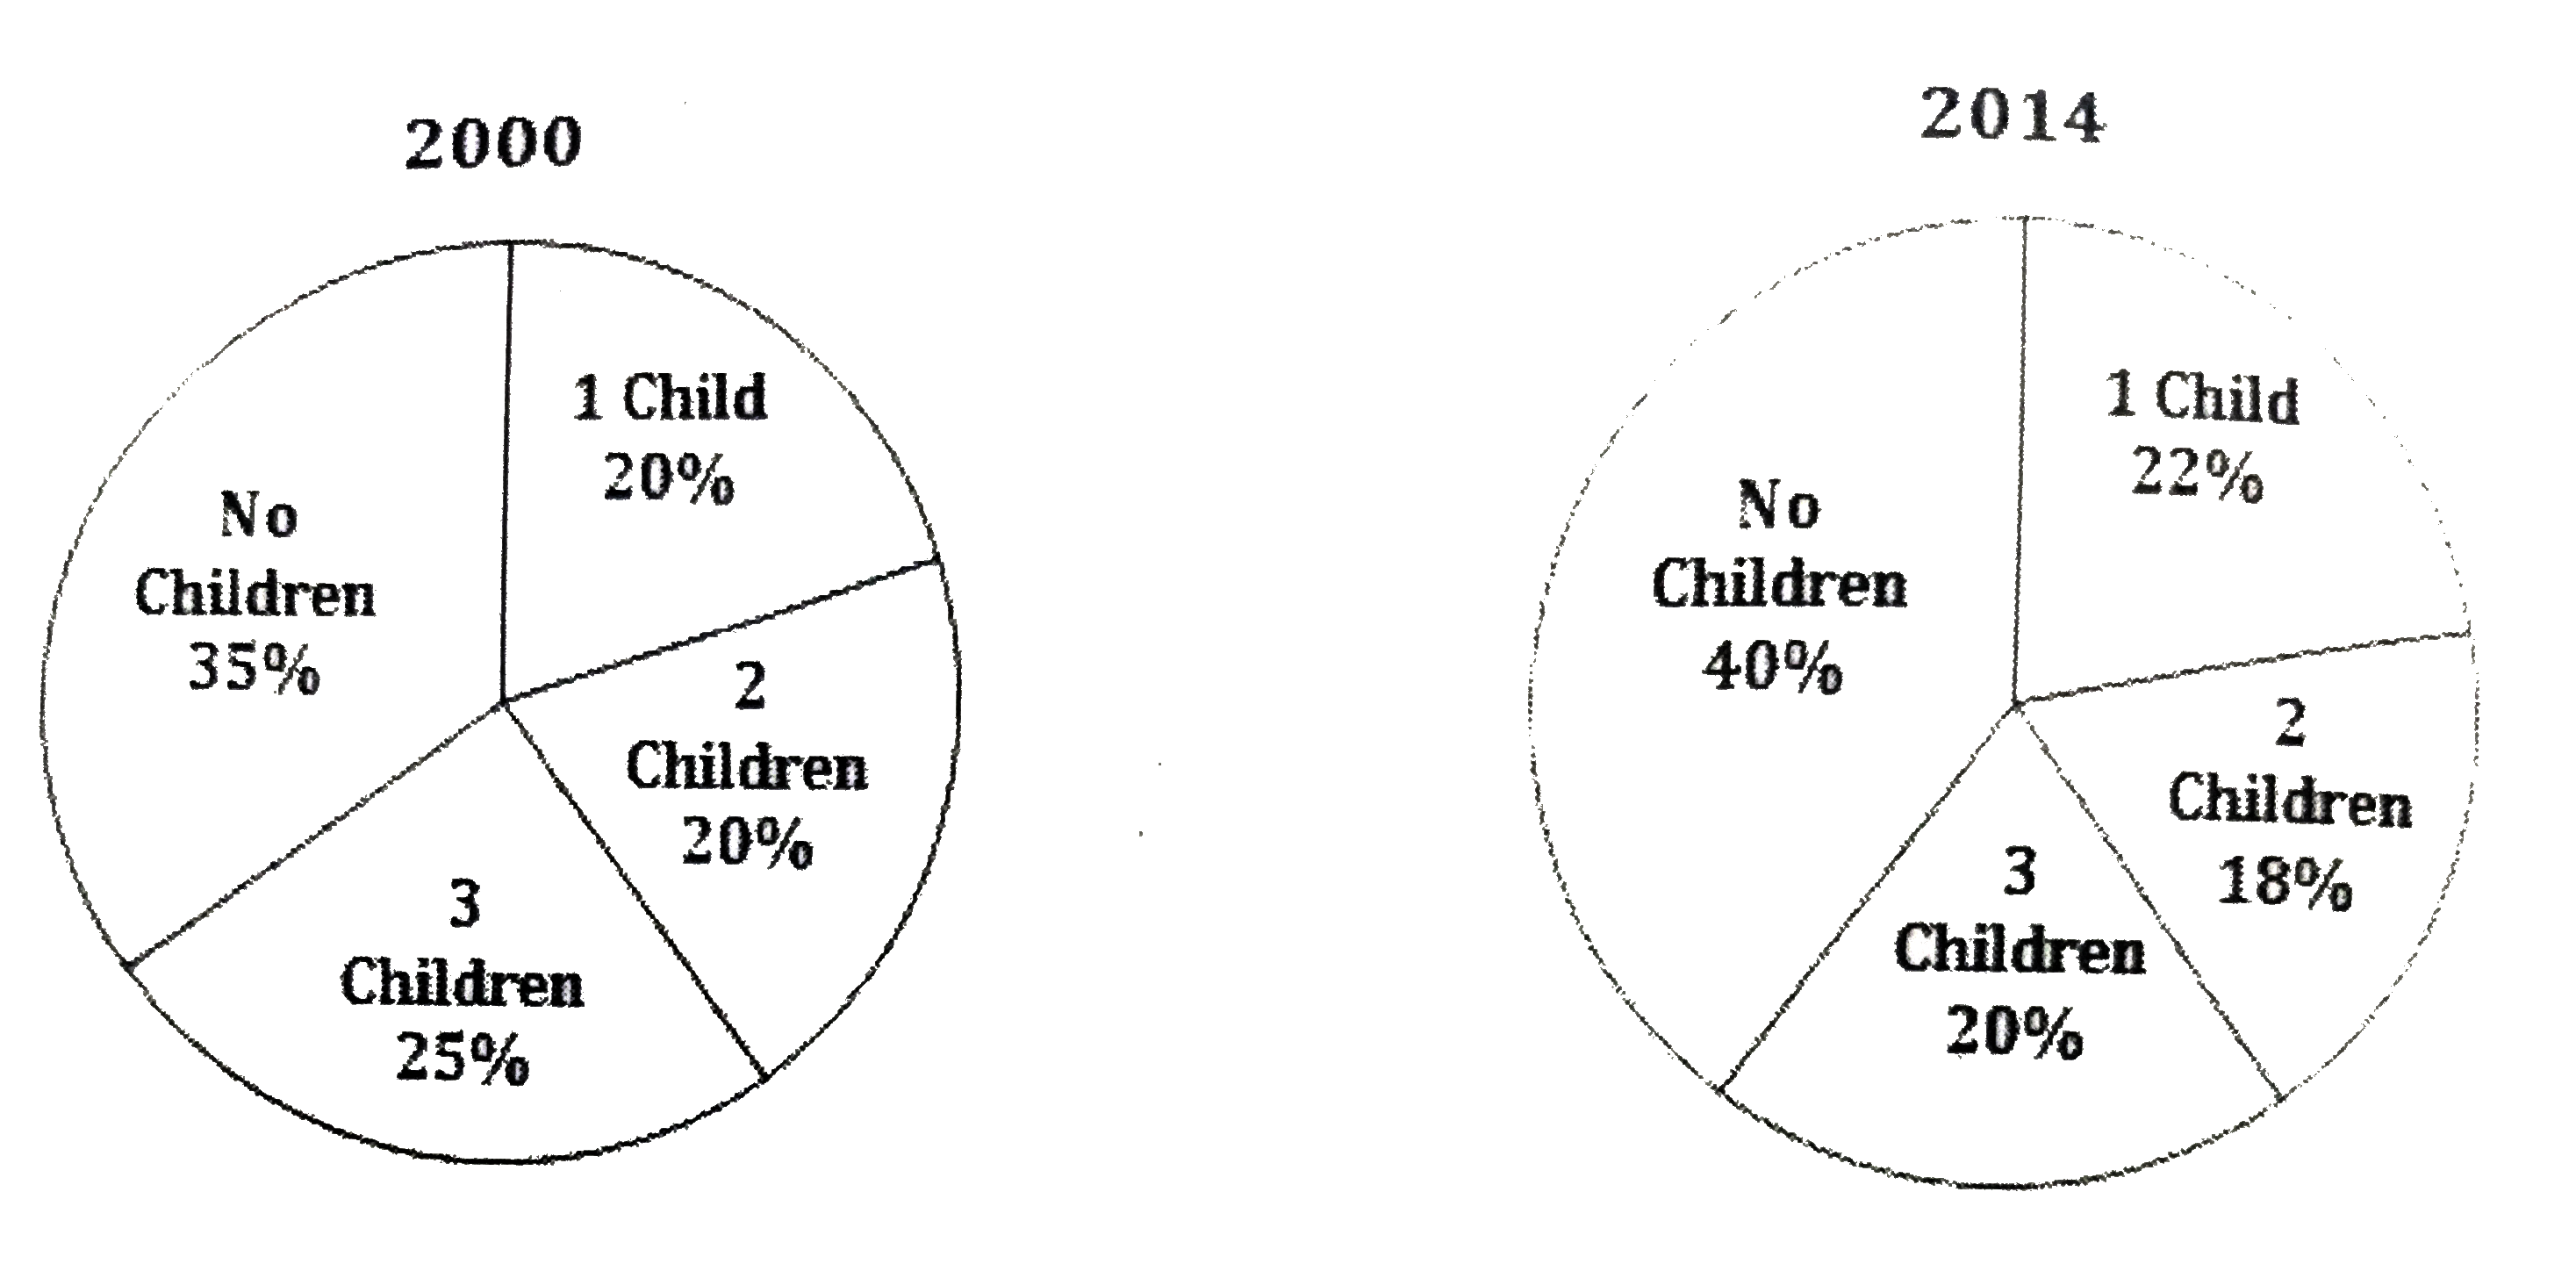
What was the approximate average annual percent increase in the number of households form 2000 to 2014 ?View Solution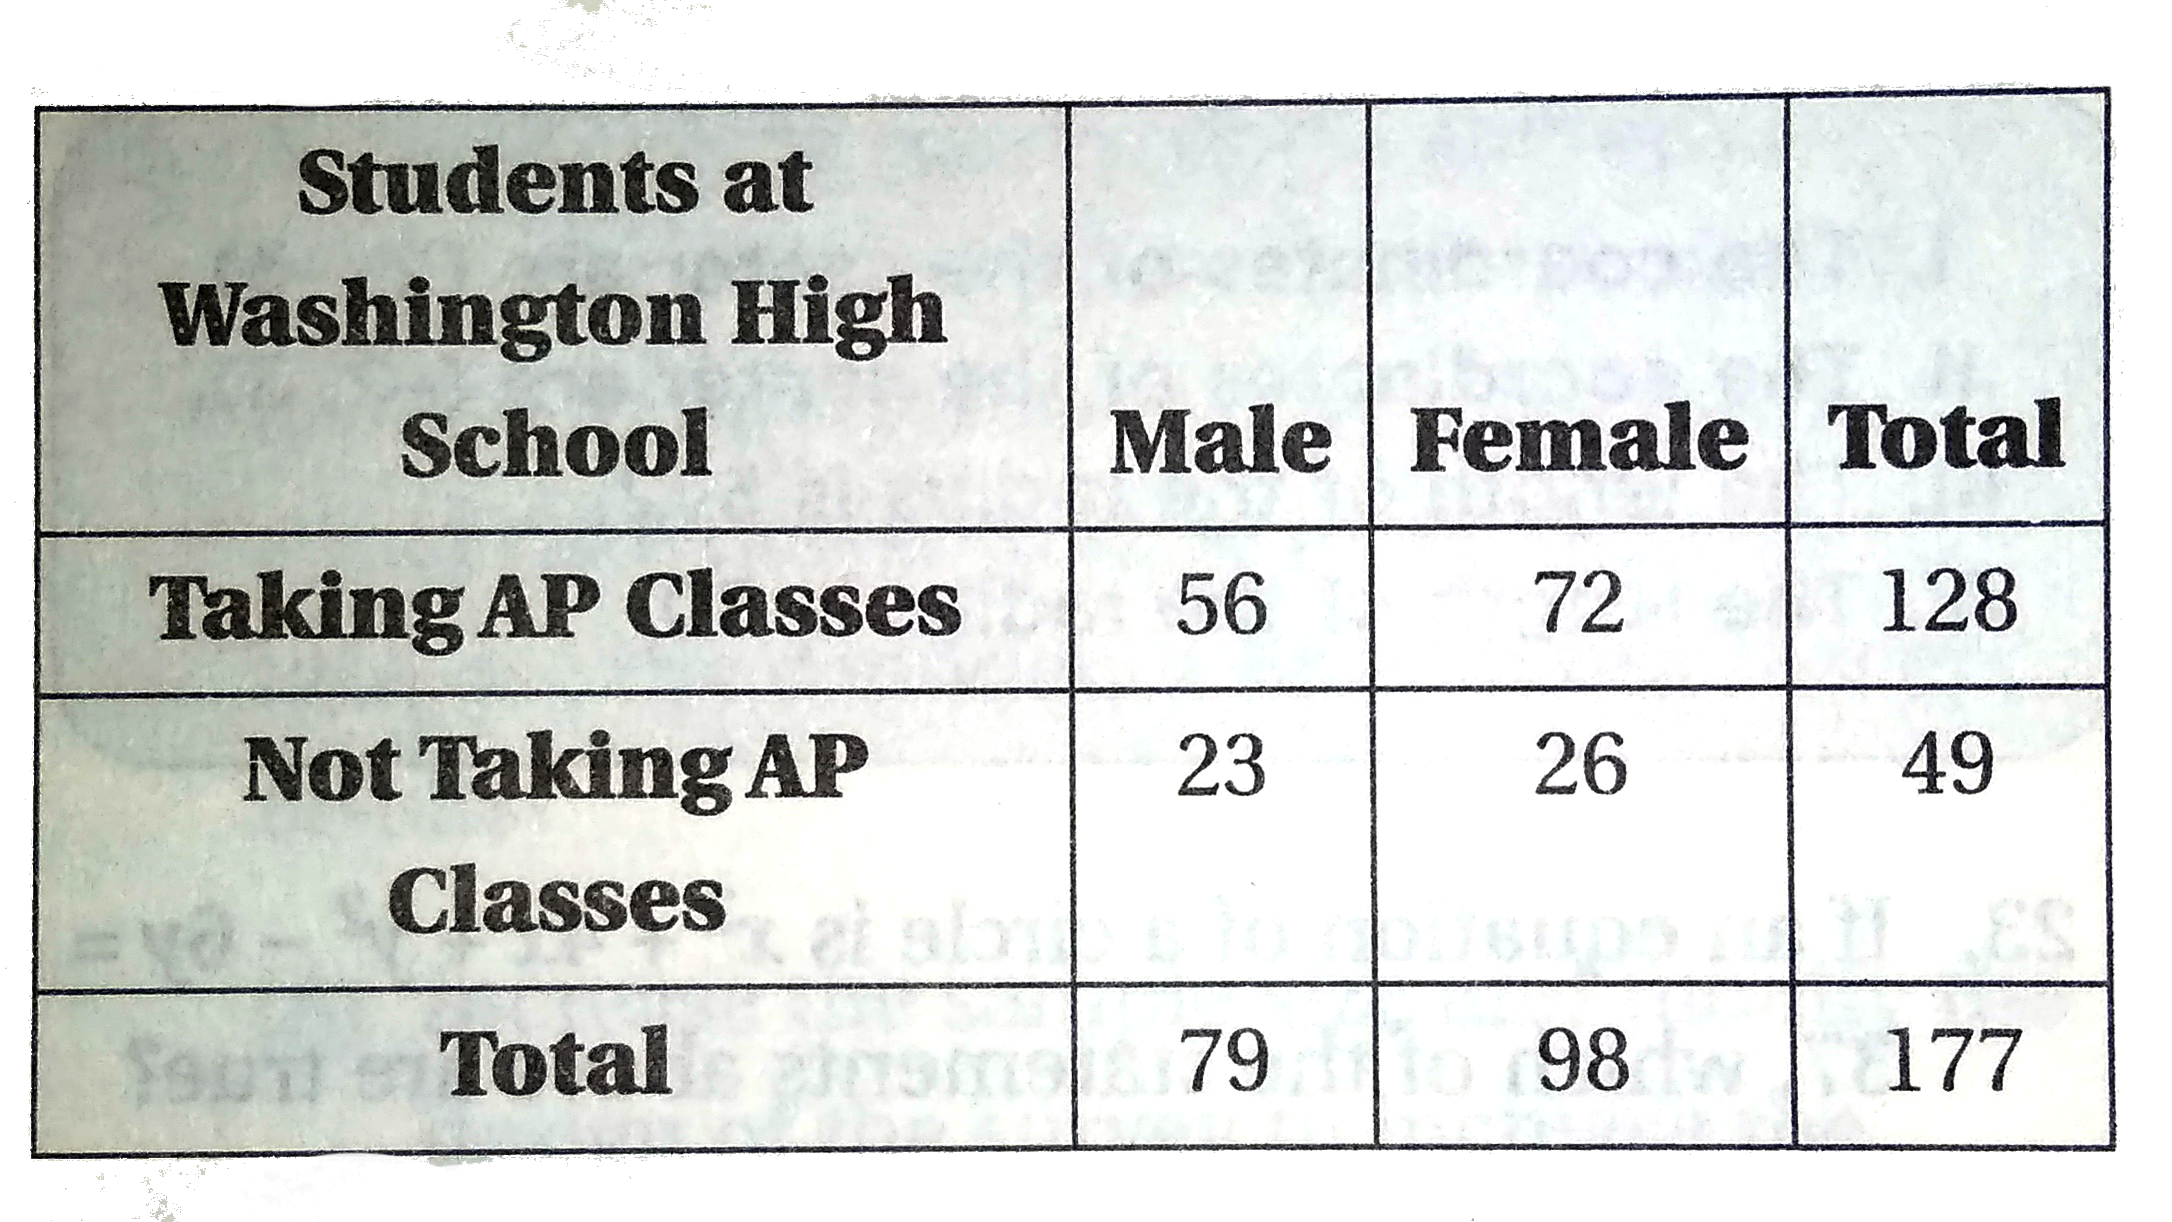
The table above gives the number of male and female students at Washington High School who are taking Advanced Placement (AP) classes and those who are not. What is the proportions of the total number of students at the school who are both male and NOT taking AP classes?View Solution
