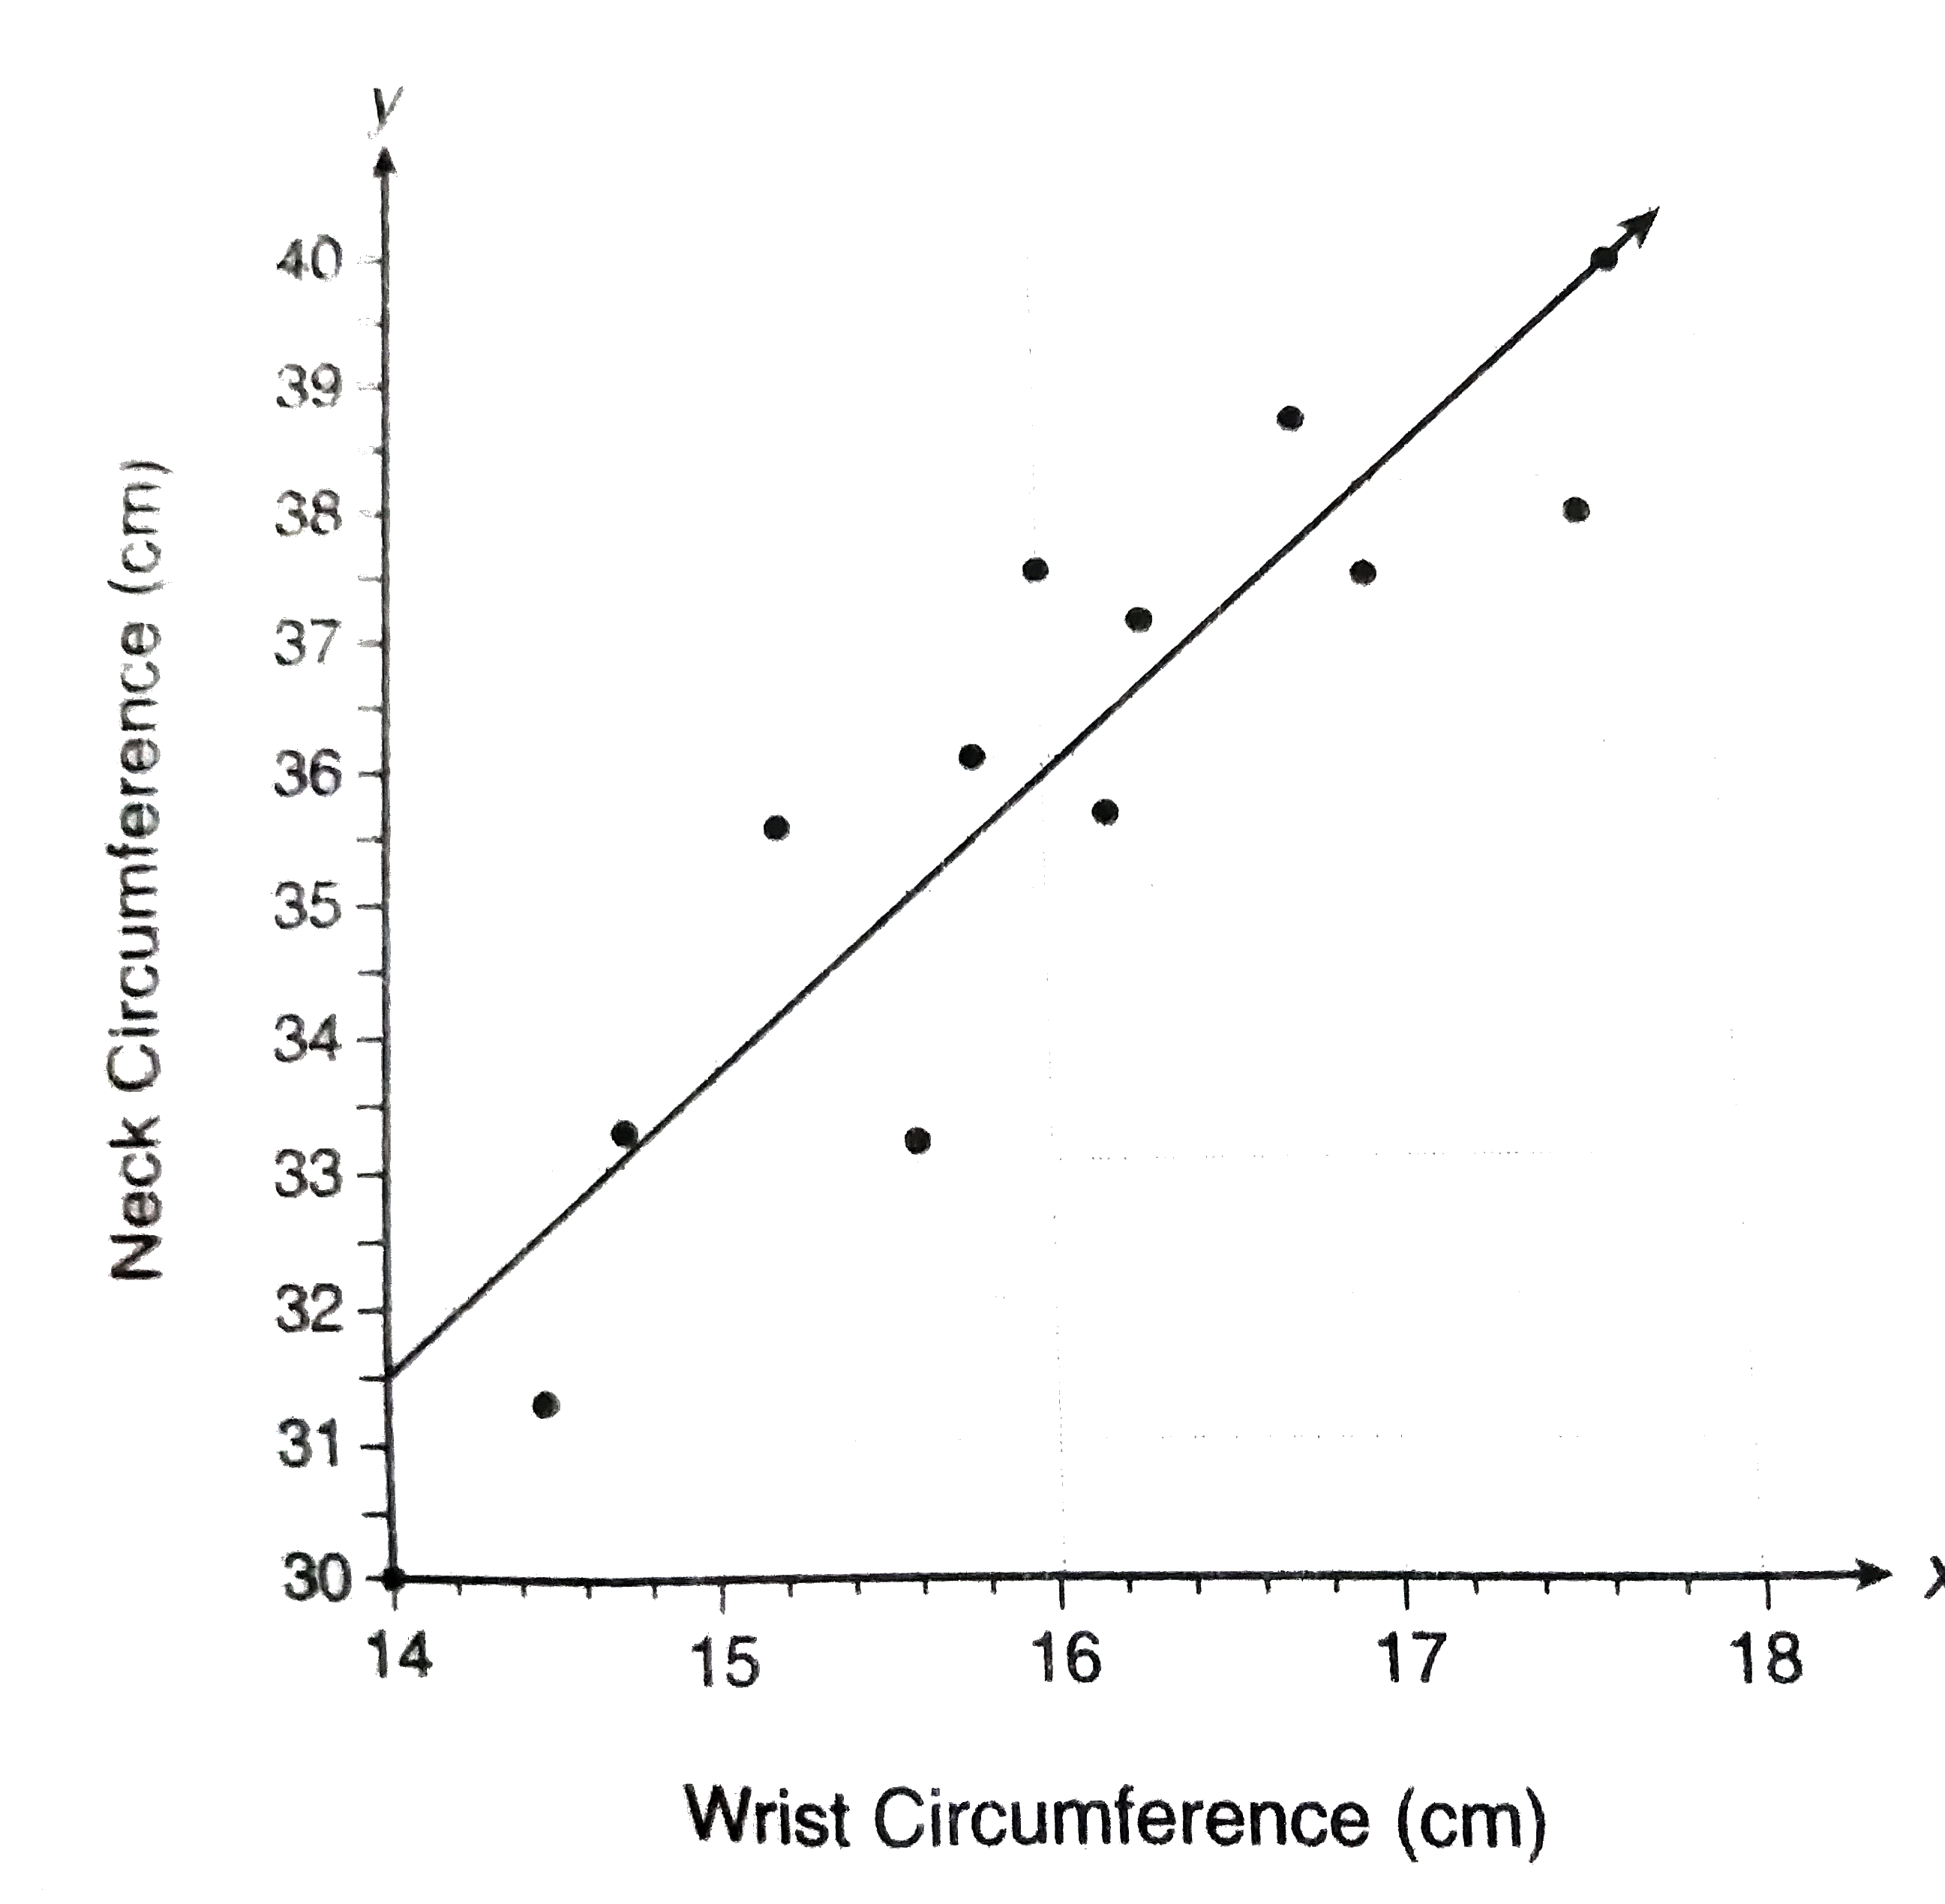
Question 1-3 refer to the above scatterplot, which shows wrist and neck cicumference measurements, in centimeters, for 12 people. The line of beat fit is drawn.
Q.What is the predicted neck circumference centimeters, for someone whose wrist circumference is 17.0cm?
The correct Answer is:37
Step by step video, text & image solution for Question 1-3 refer to the above scatterplot, which shows wrist and neck cicumference measurements, in centimeters, for 12 people. The line of beat fit is drawn. Q.What is the predicted neck circumference centimeters, for someone whose wrist circumference is 17.0cm? by Maths experts to help you in doubts & scoring excellent marks in Class 12 exams.
Topper's Solved these Questions
- BOOK - ENGLISH SATCHAPTER - PROBLEM SOLVING AND DATA ANALYSISEXERCISE - Multiple Choice128videos
PROBLEM SOLVING AND DATA ANALYSIS
- BOOK - ENGLISH SATCHAPTER - PROBLEM SOLVING AND DATA ANALYSISEXERCISE - EXERICSE80videos
PROBLEM SOLVING AND DATA ANALYSIS
- BOOK - ENGLISH SATCHAPTER - PROBLEMS IN CONTEXT EXERCISE - PRACTICE TEST10videos
PROBLEMS IN CONTEXT
Similar Questions
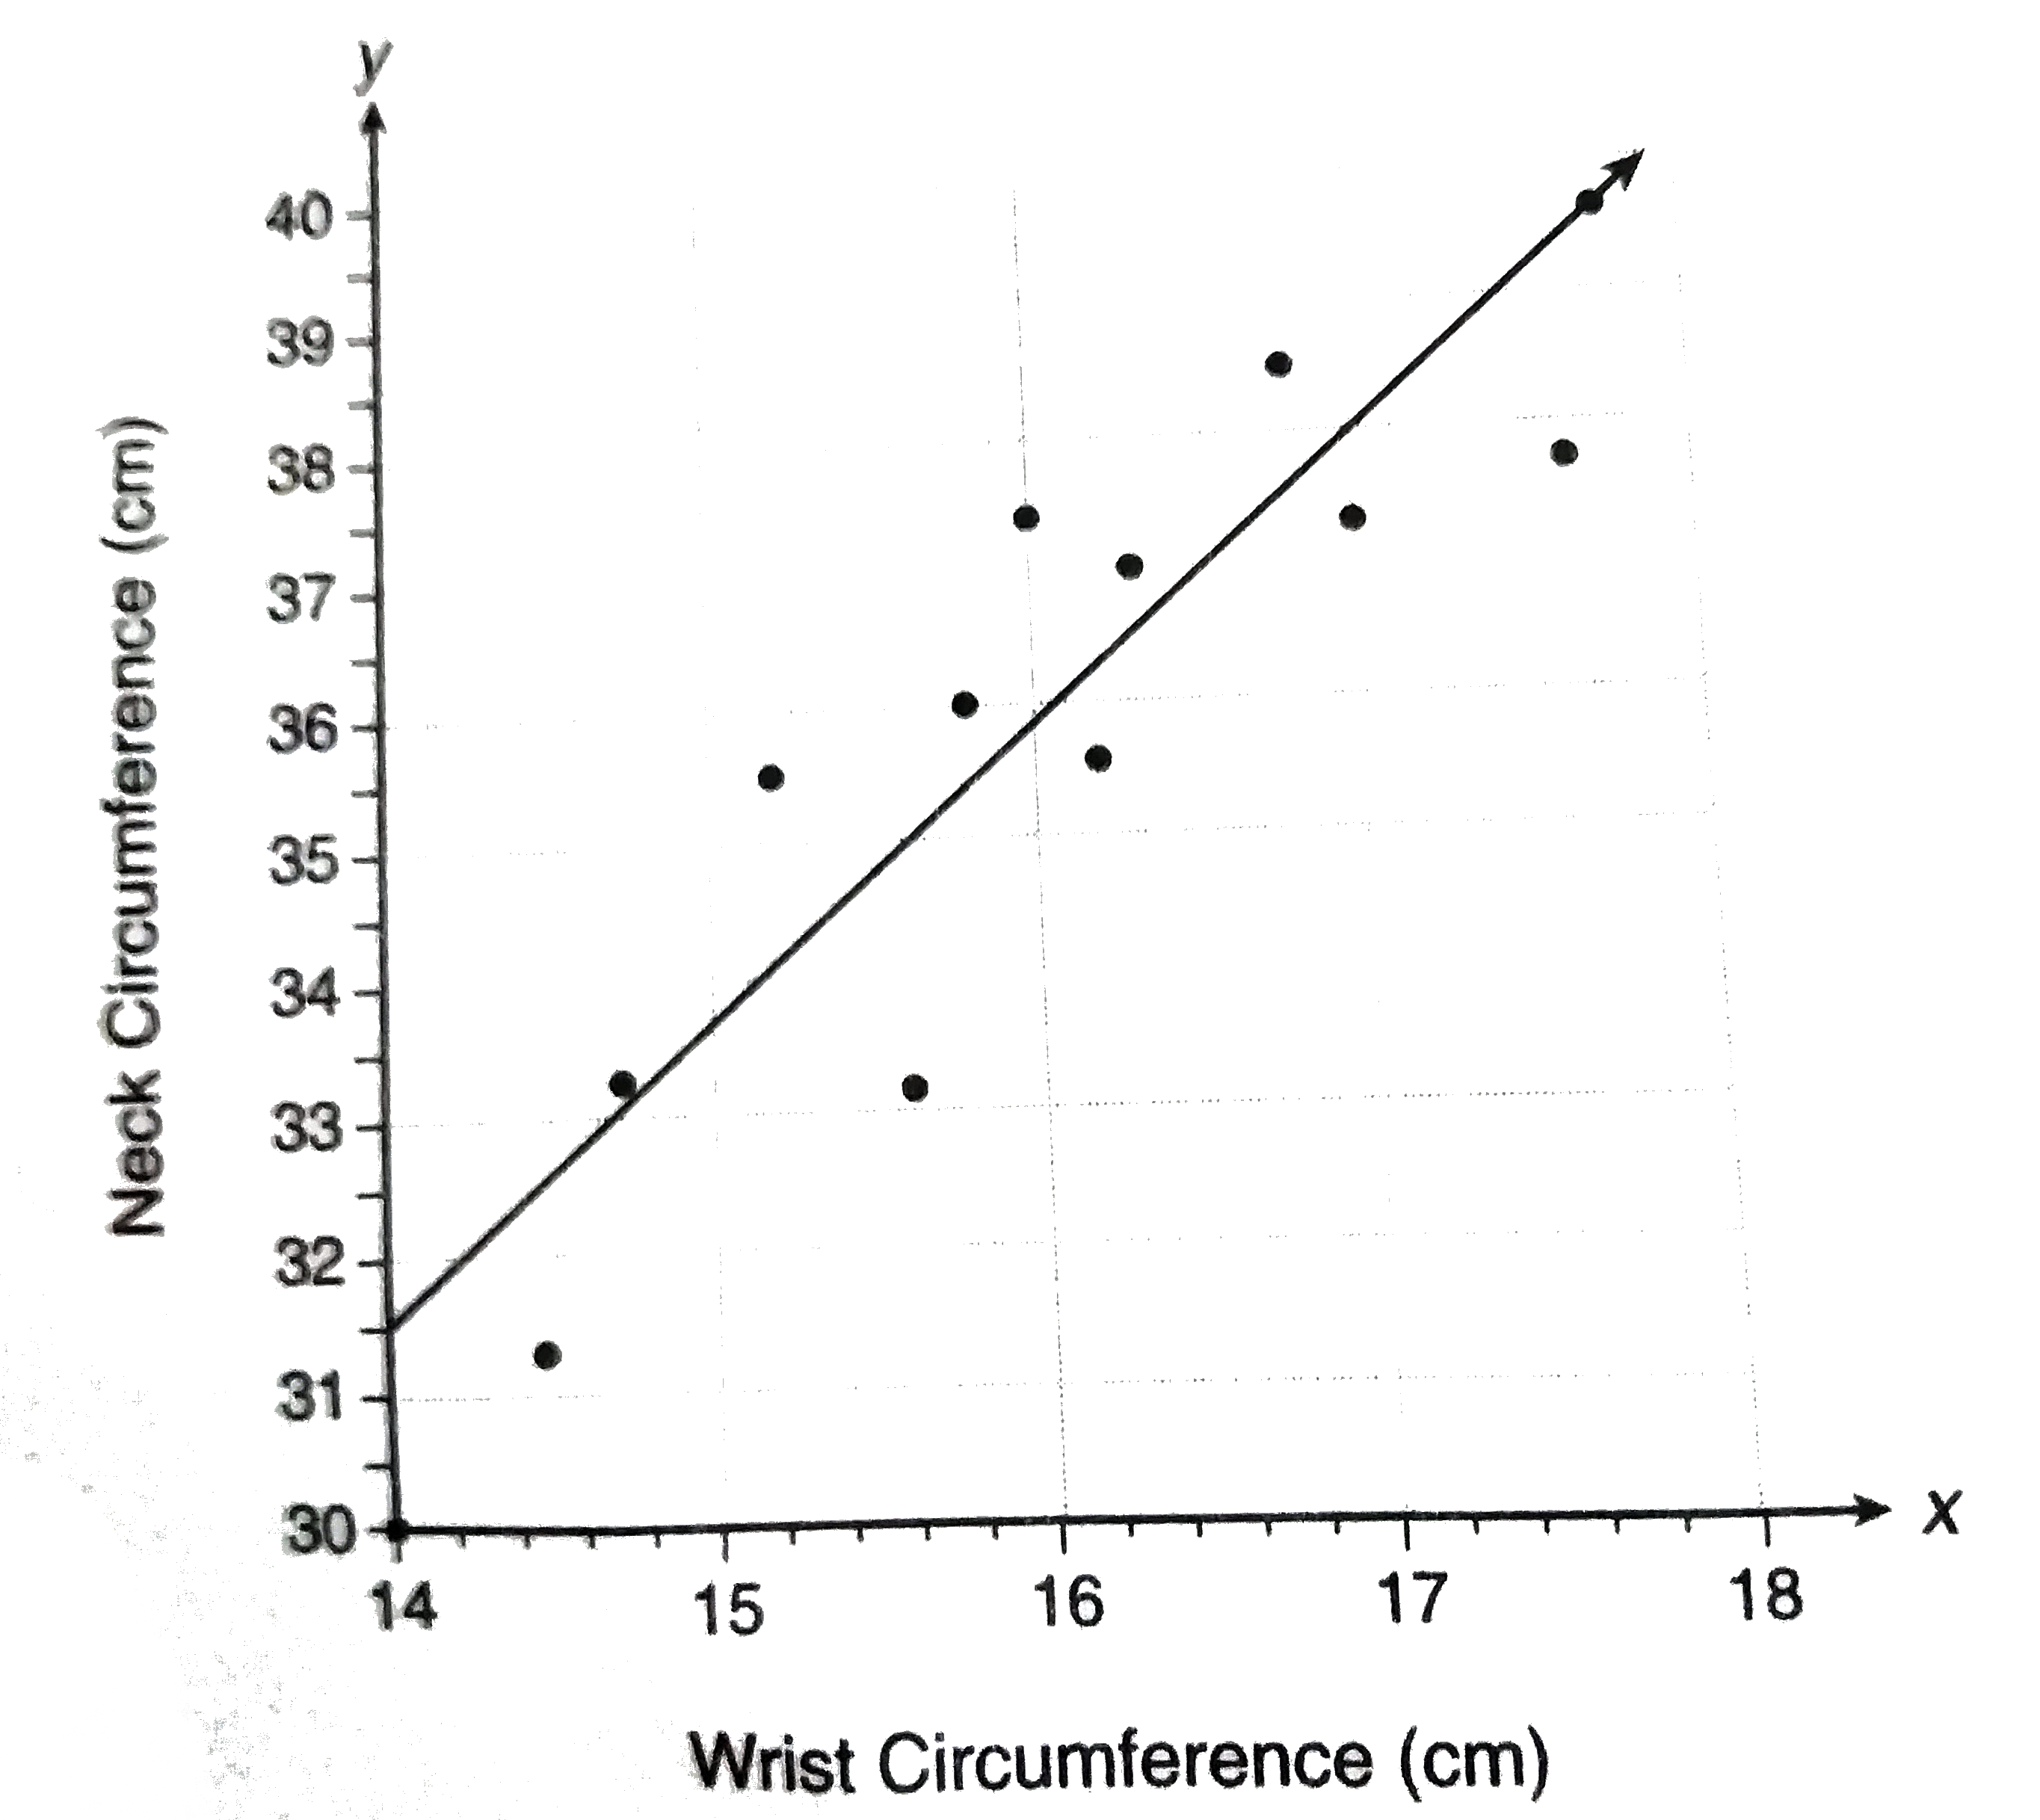
Question 1-3 refer to the above scatterplot, which shows wrist and neck cicumference measurements, in centimeters, for 12 people. The line of beat fit is drawn.
Q. What is the average increase in neck circumference per centimeter increase in wrist circumference, correct to the nearest tenth?View Solution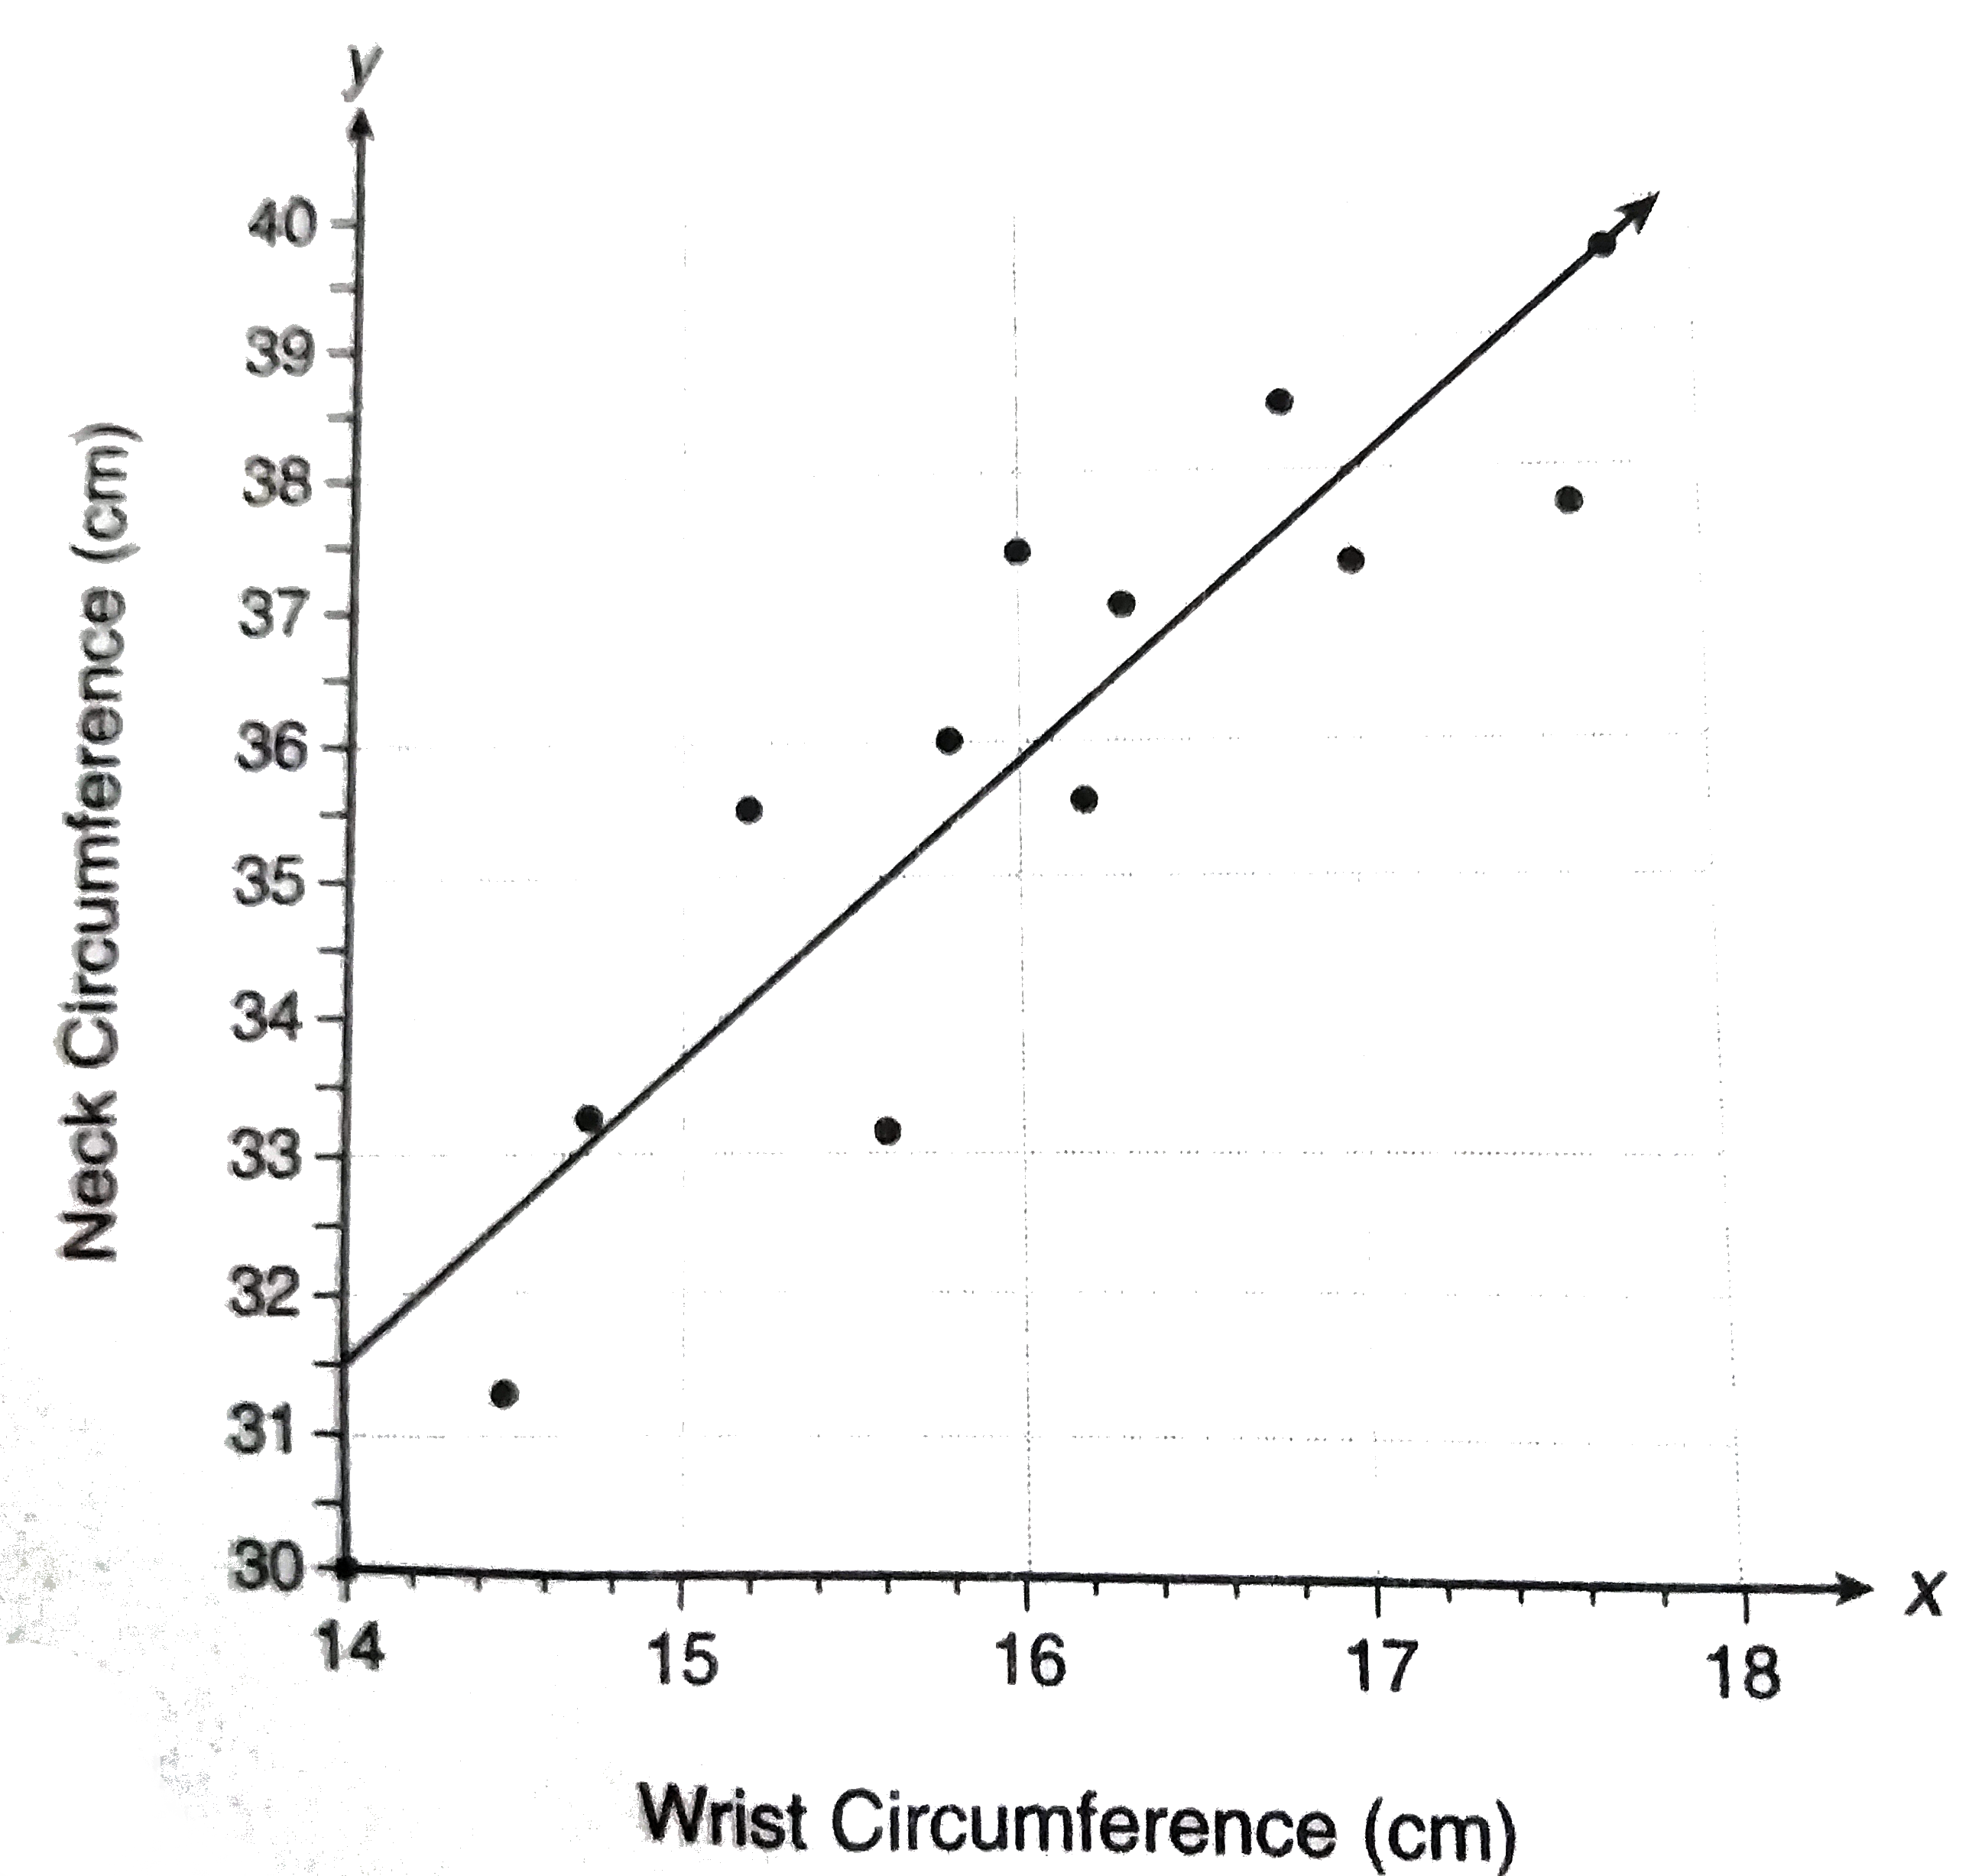
Question 1-3 refer to the above scatterplot, which shows wrist and neck cicumference measurements, in centimeters, for 12 people. The line of beat fit is drawn.
Q. How many of the 12 people have an actual neck circumference that differs by more than 1 centimeters from the neck circumference predicted by the line of best fit?View Solution
Knowledge Check
- Question 1 - Select One
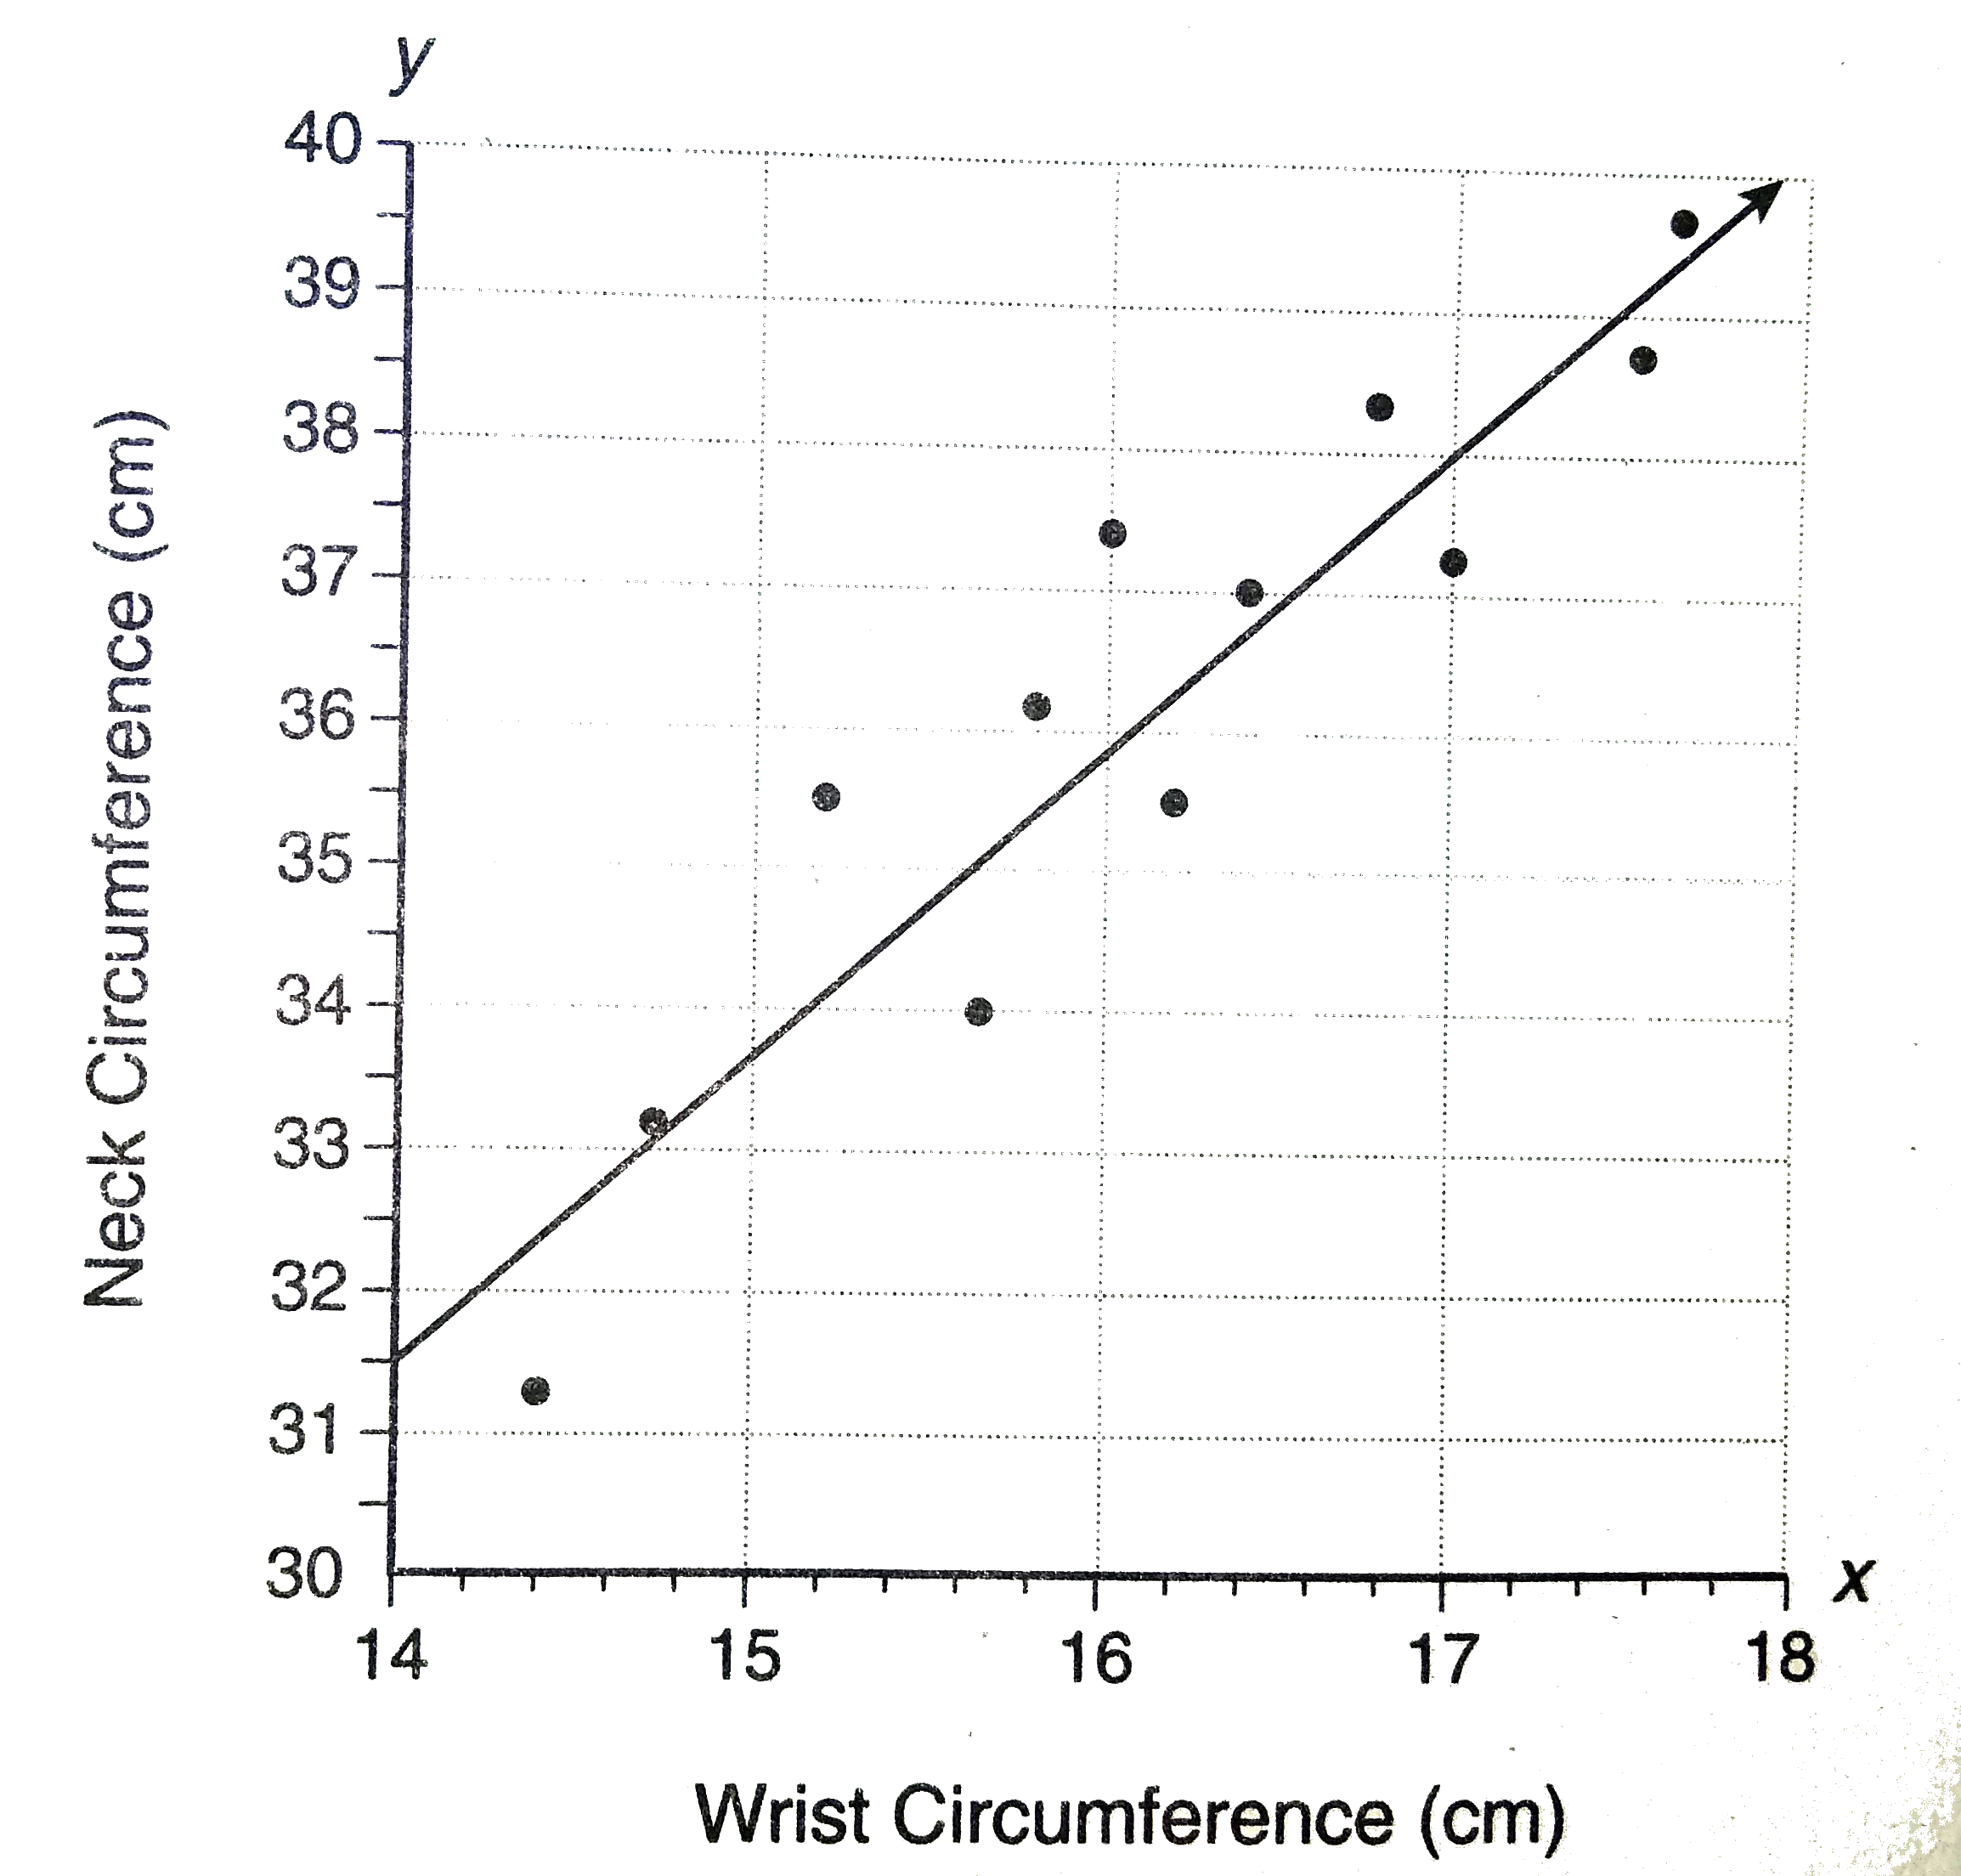
The scatterplot above summarizes the wrist and neck circumference measurements, in centimeters, for 12 people. The line of best fit is drawn. What proportion of the measurements satisfy the inequality |o−p|≤d, where o is the observed measurement, p is corresponding measurement predicted by the line of best fit, and d is 0.5cm?A16B14C13D12 - Question 2 - Select One
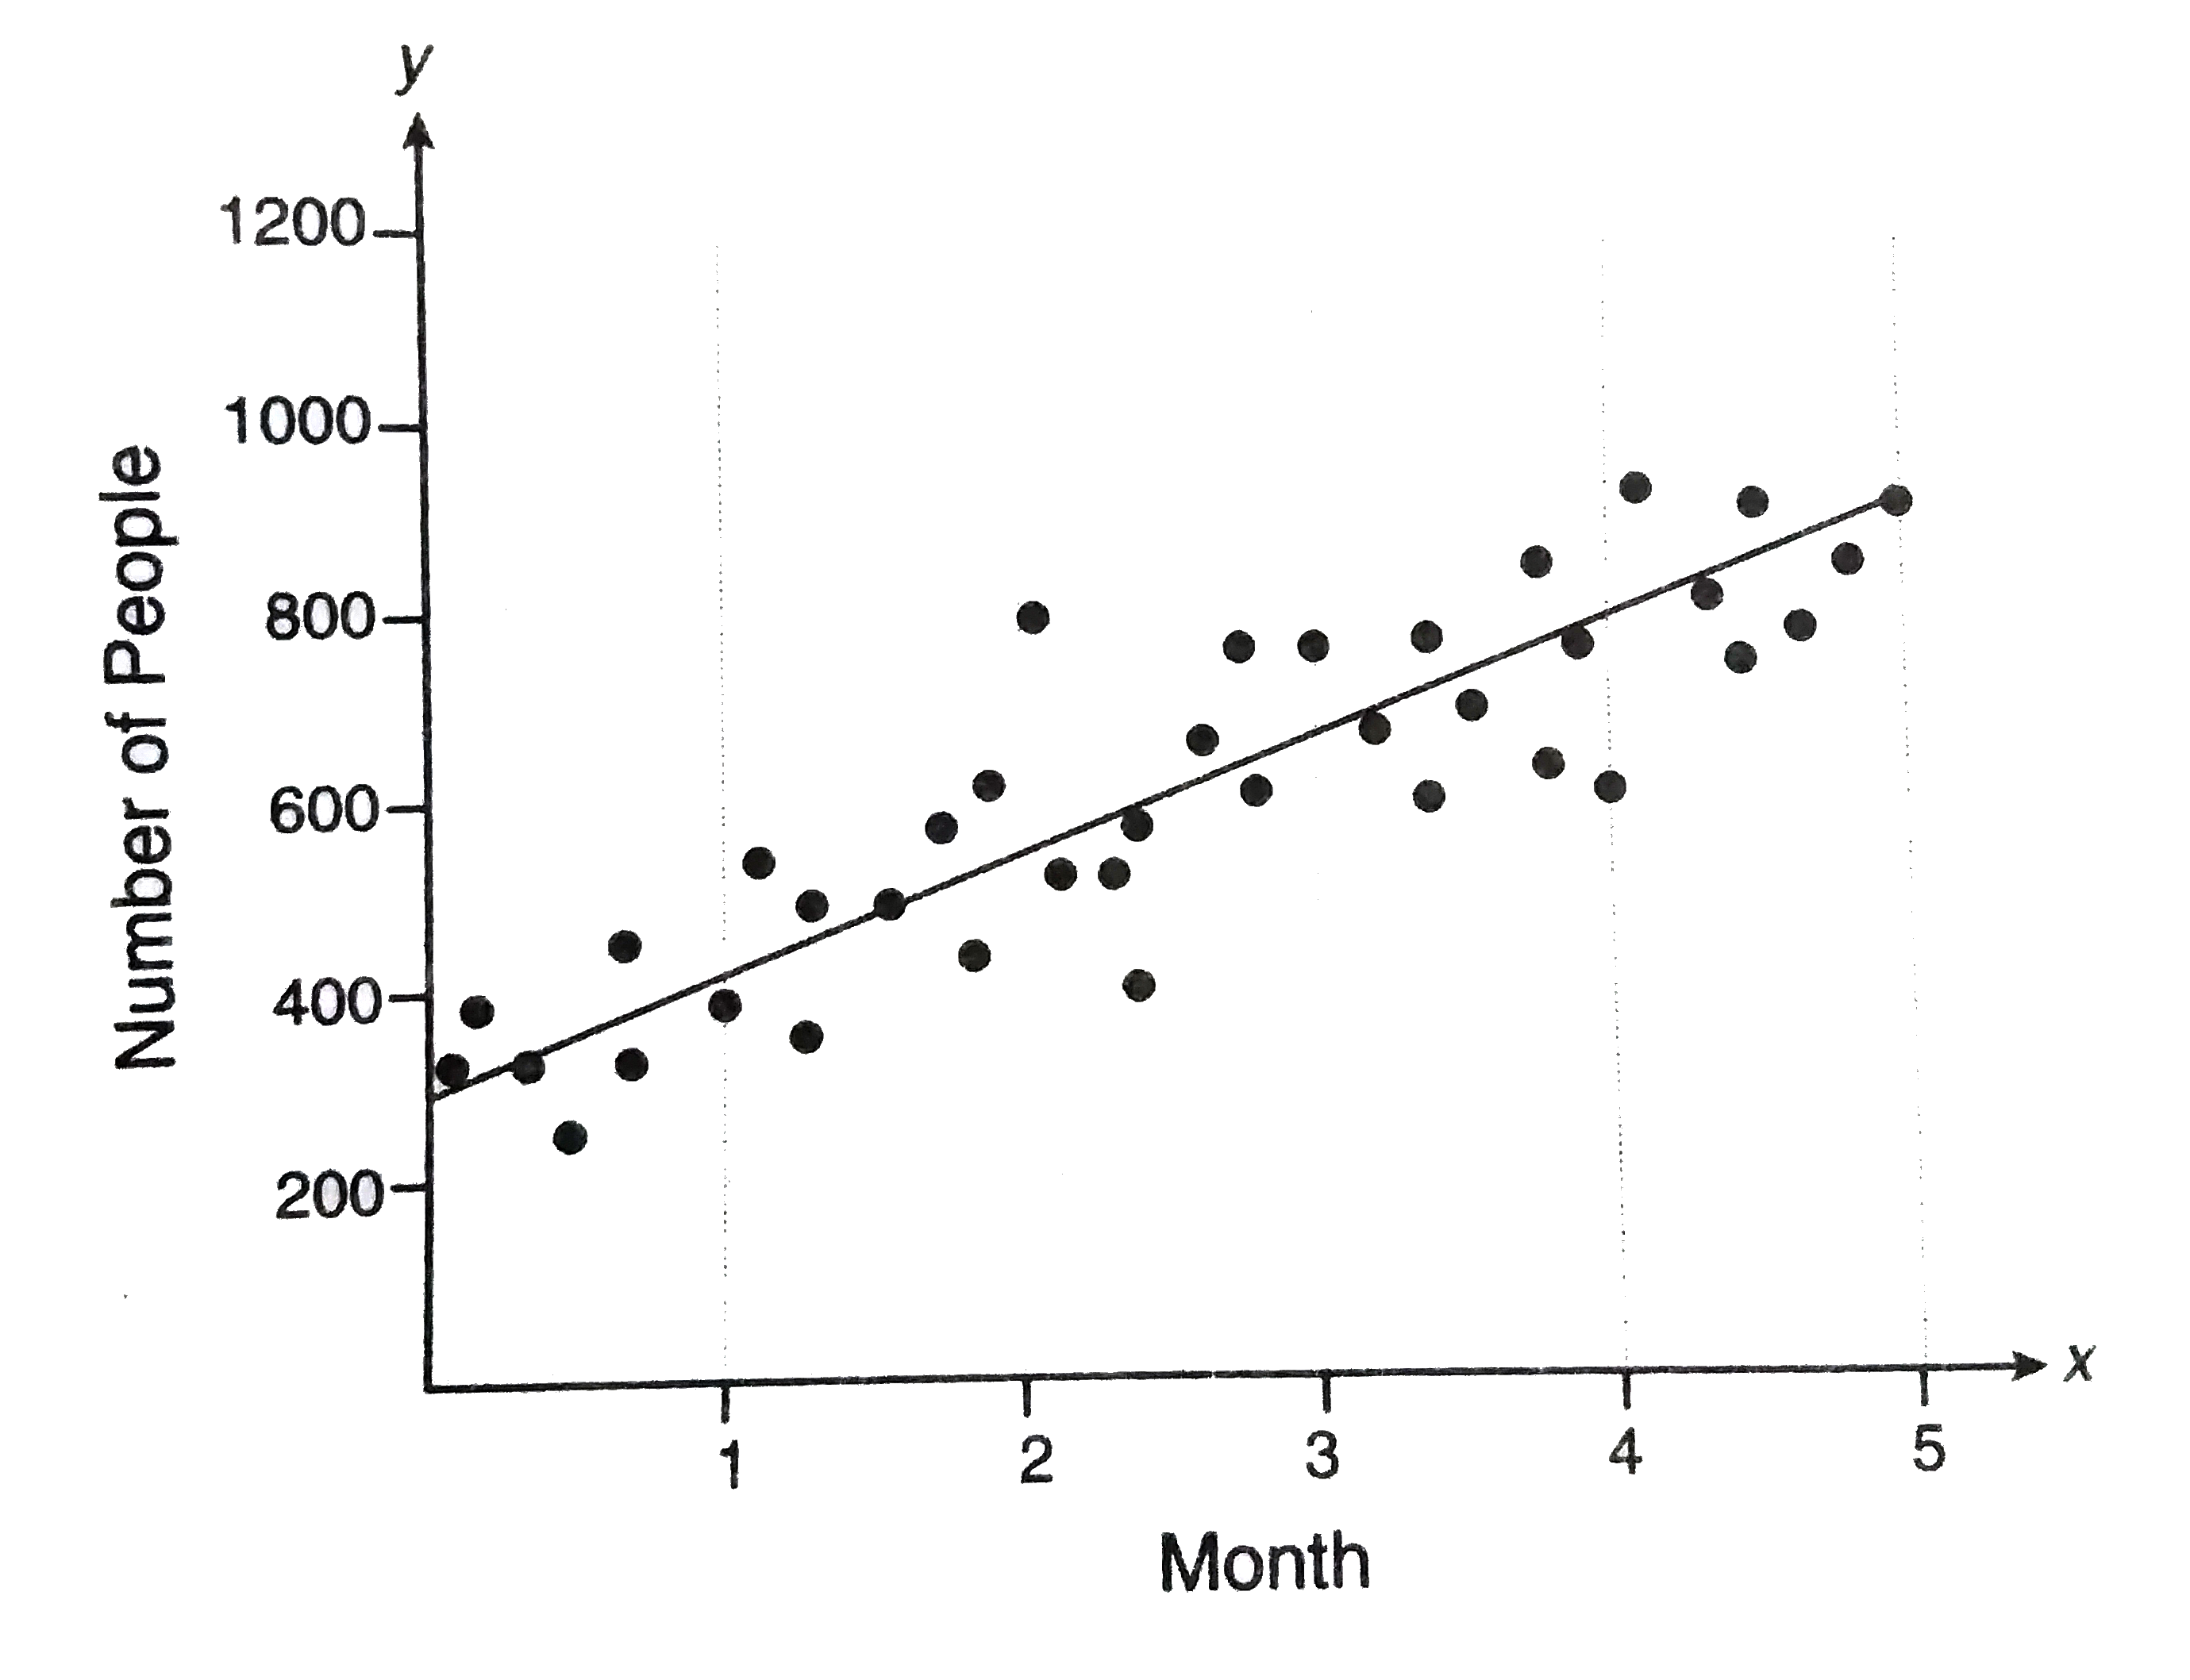
A new fitness class was started at several fitness clubs owned by the same company. The scatterplot shows the total number of people attending the class during the first five months in which the class was offered. The line of best fit is drawn.
Q. For month 4, the predicted number of people attending the class was approximately what percent greater than the actual number of people attending the class?A15%B20%C30%D36% - Question 3 - Select One
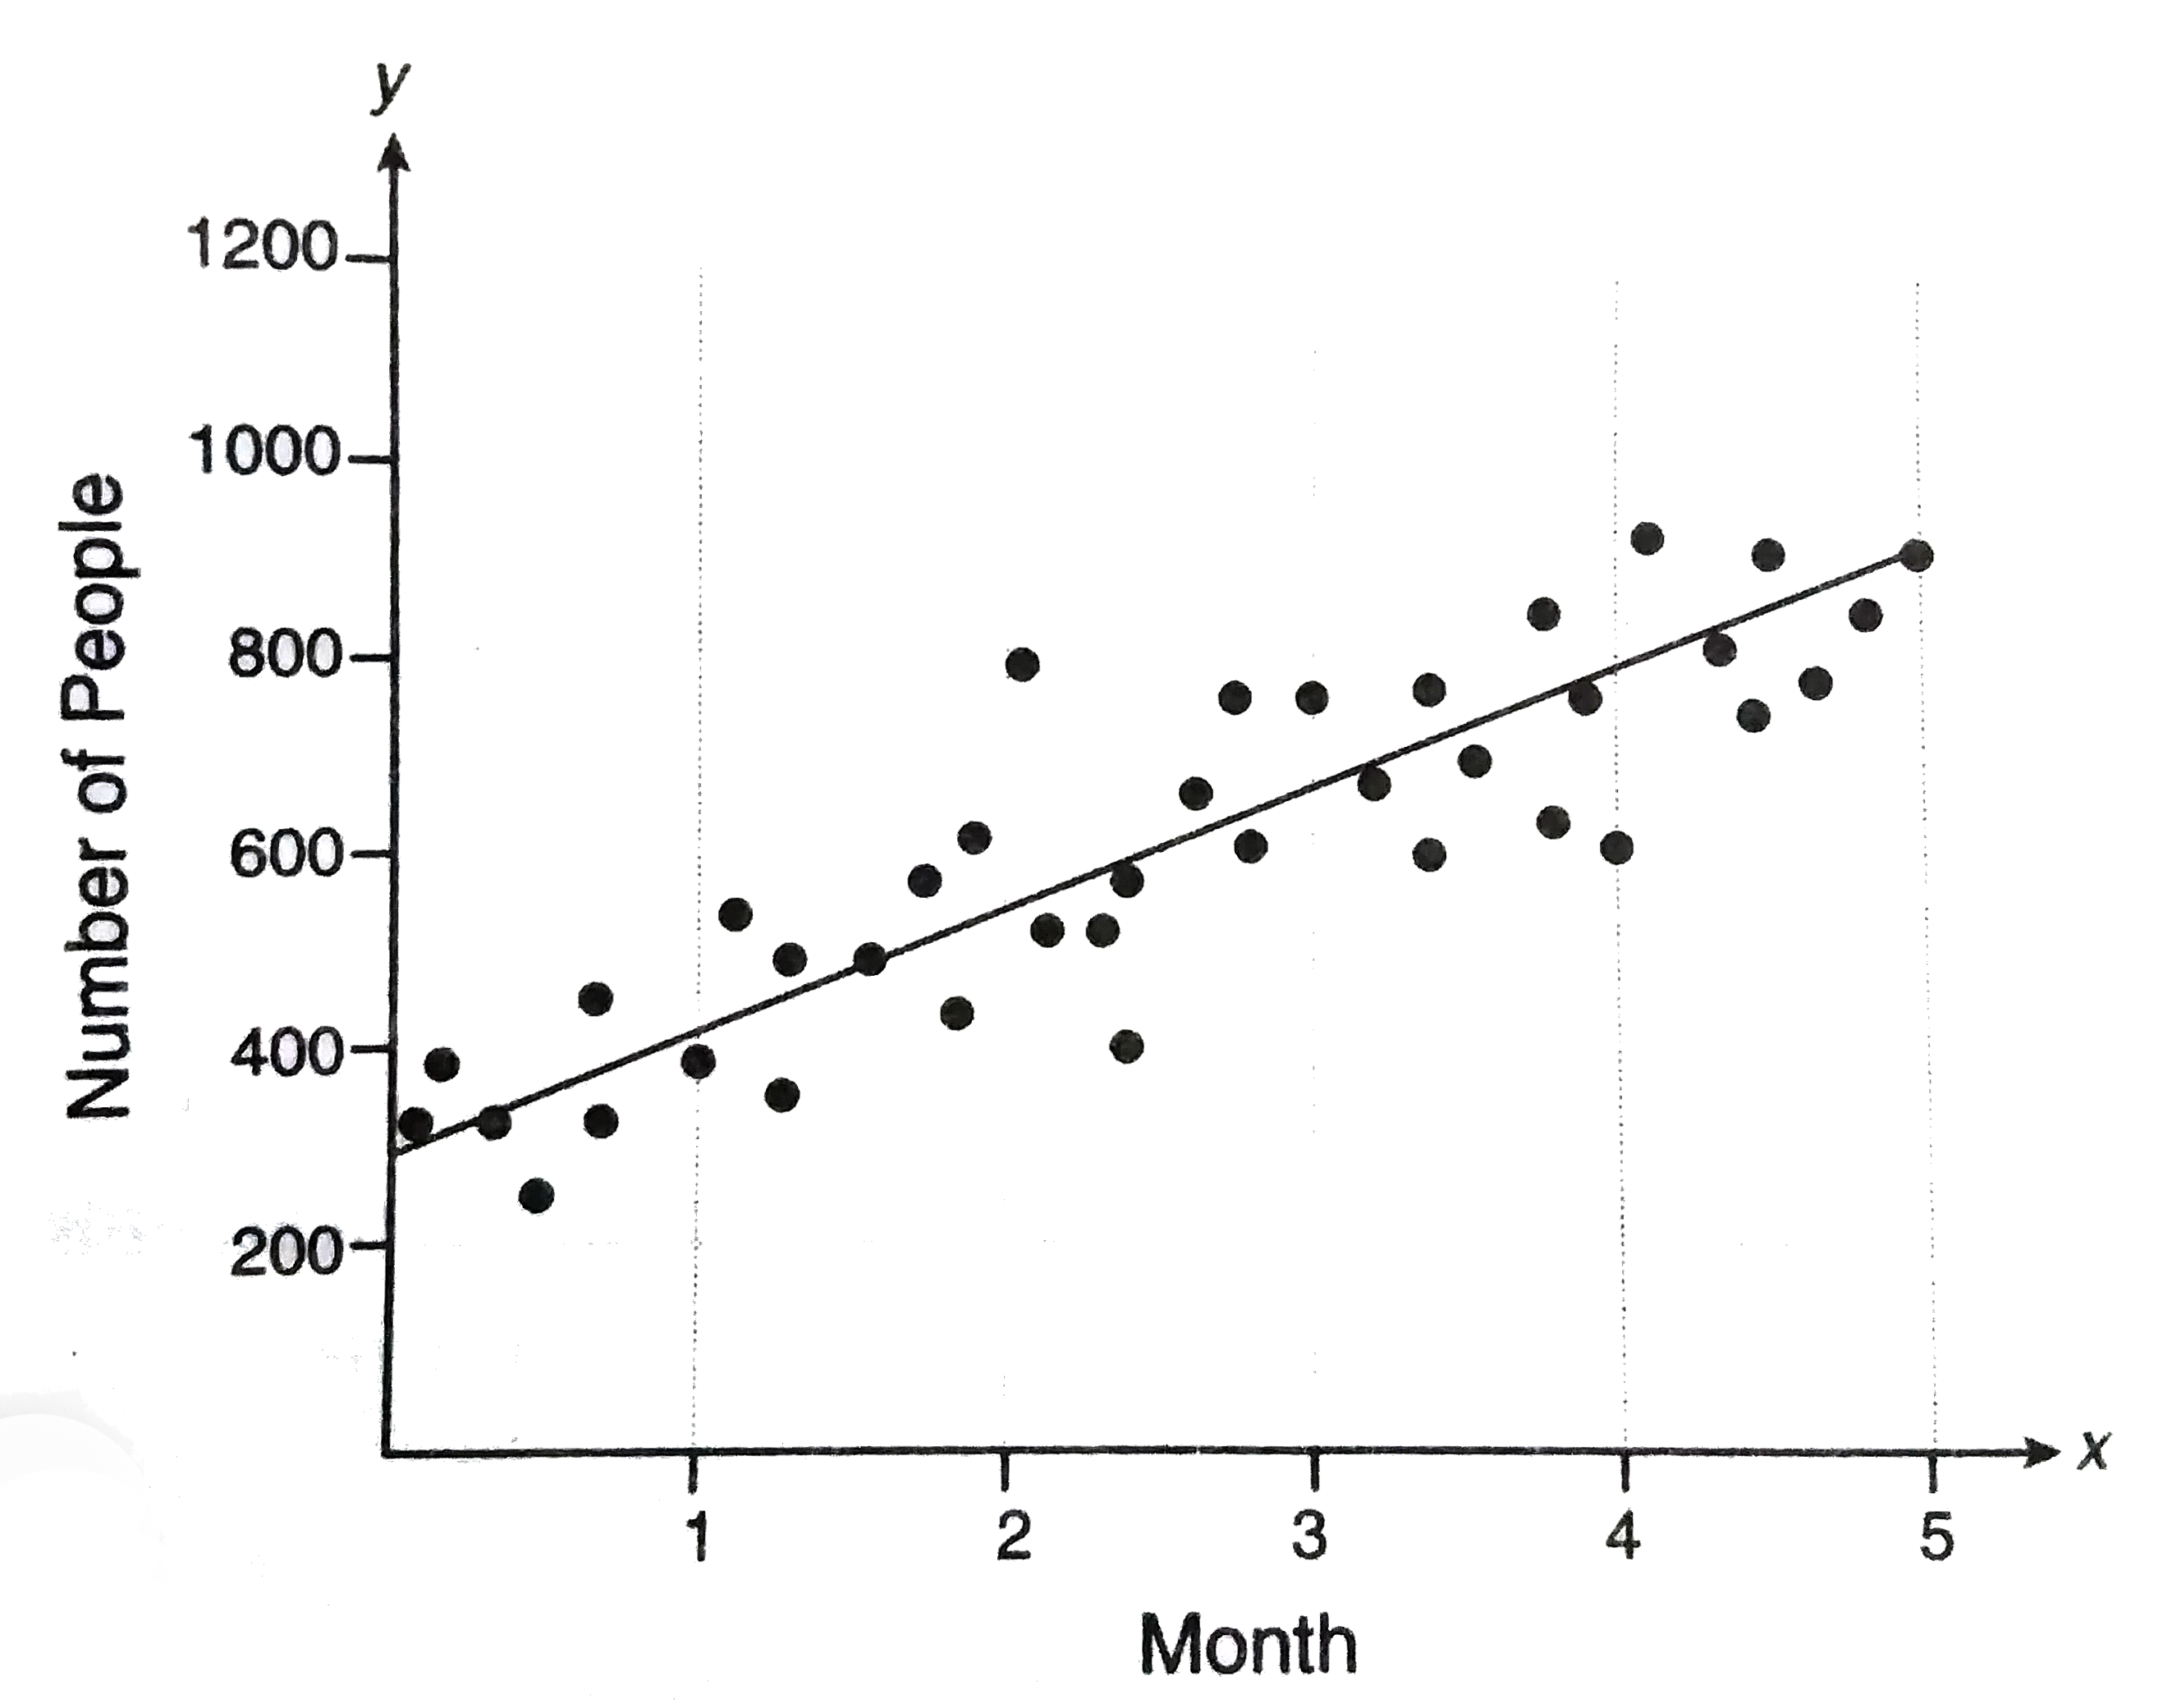
Question 5-7 refer to the scatterplot above.
A new fitness class was started at several fitness clubs owned by the same company. The scatterplot shows the total number of people attending the class during the first five months in which the class was offered. The line of best fit is drawn.
Q. At the beginning of which month did the actual number of people attending the class differ by the greatest amount from the number predicted by the line of best fit?AMonth 2BMonth 3CMonth 4DMonth 5
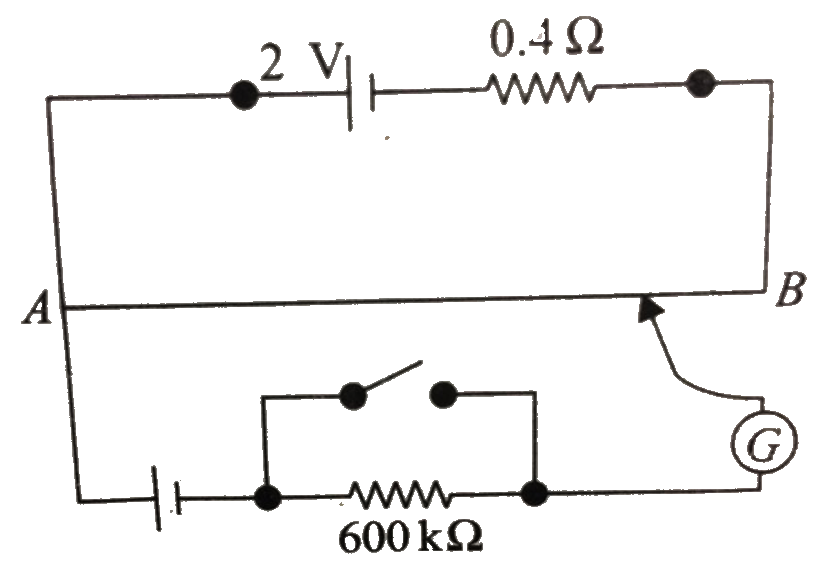
Figure 6.36 shows a potentiometer with a cell of emf 2.0V and internal resistance 0.4Ω maintaining a potential drop across the resistor wire AB. A standard cell that maintains a constant emf of 1.02V (for very moderate current up to emf μA) gives a balance point at 67.3cm length of the wire. To ensure very low current is drawn the standard cell, a very high resistance of 600kΩ is put in series with it, which is shorted close to the balance point. The standard cell is then replaced by a cell of unknown emf ε and the balance point found, similary, turns out to be at 82.3cm length of the wire.
a. What is the value of ε?
b.What purpose does the high resistance of 600kΩ have?
c. Is the balance point affected by this high resistance?
d. Is the balance point affected by internal resistance of the driver cell?
e. Would the method work in the above situation if the driver cell of the potentiometer had an emf of 1.0V instead of 2.0V?
f. Would the circuit work well for determining an extermely small emf, say of the order of a few mV (such as the typical emf of a thermocouple)? If not, how will you modify the circuit ?
 View Solution
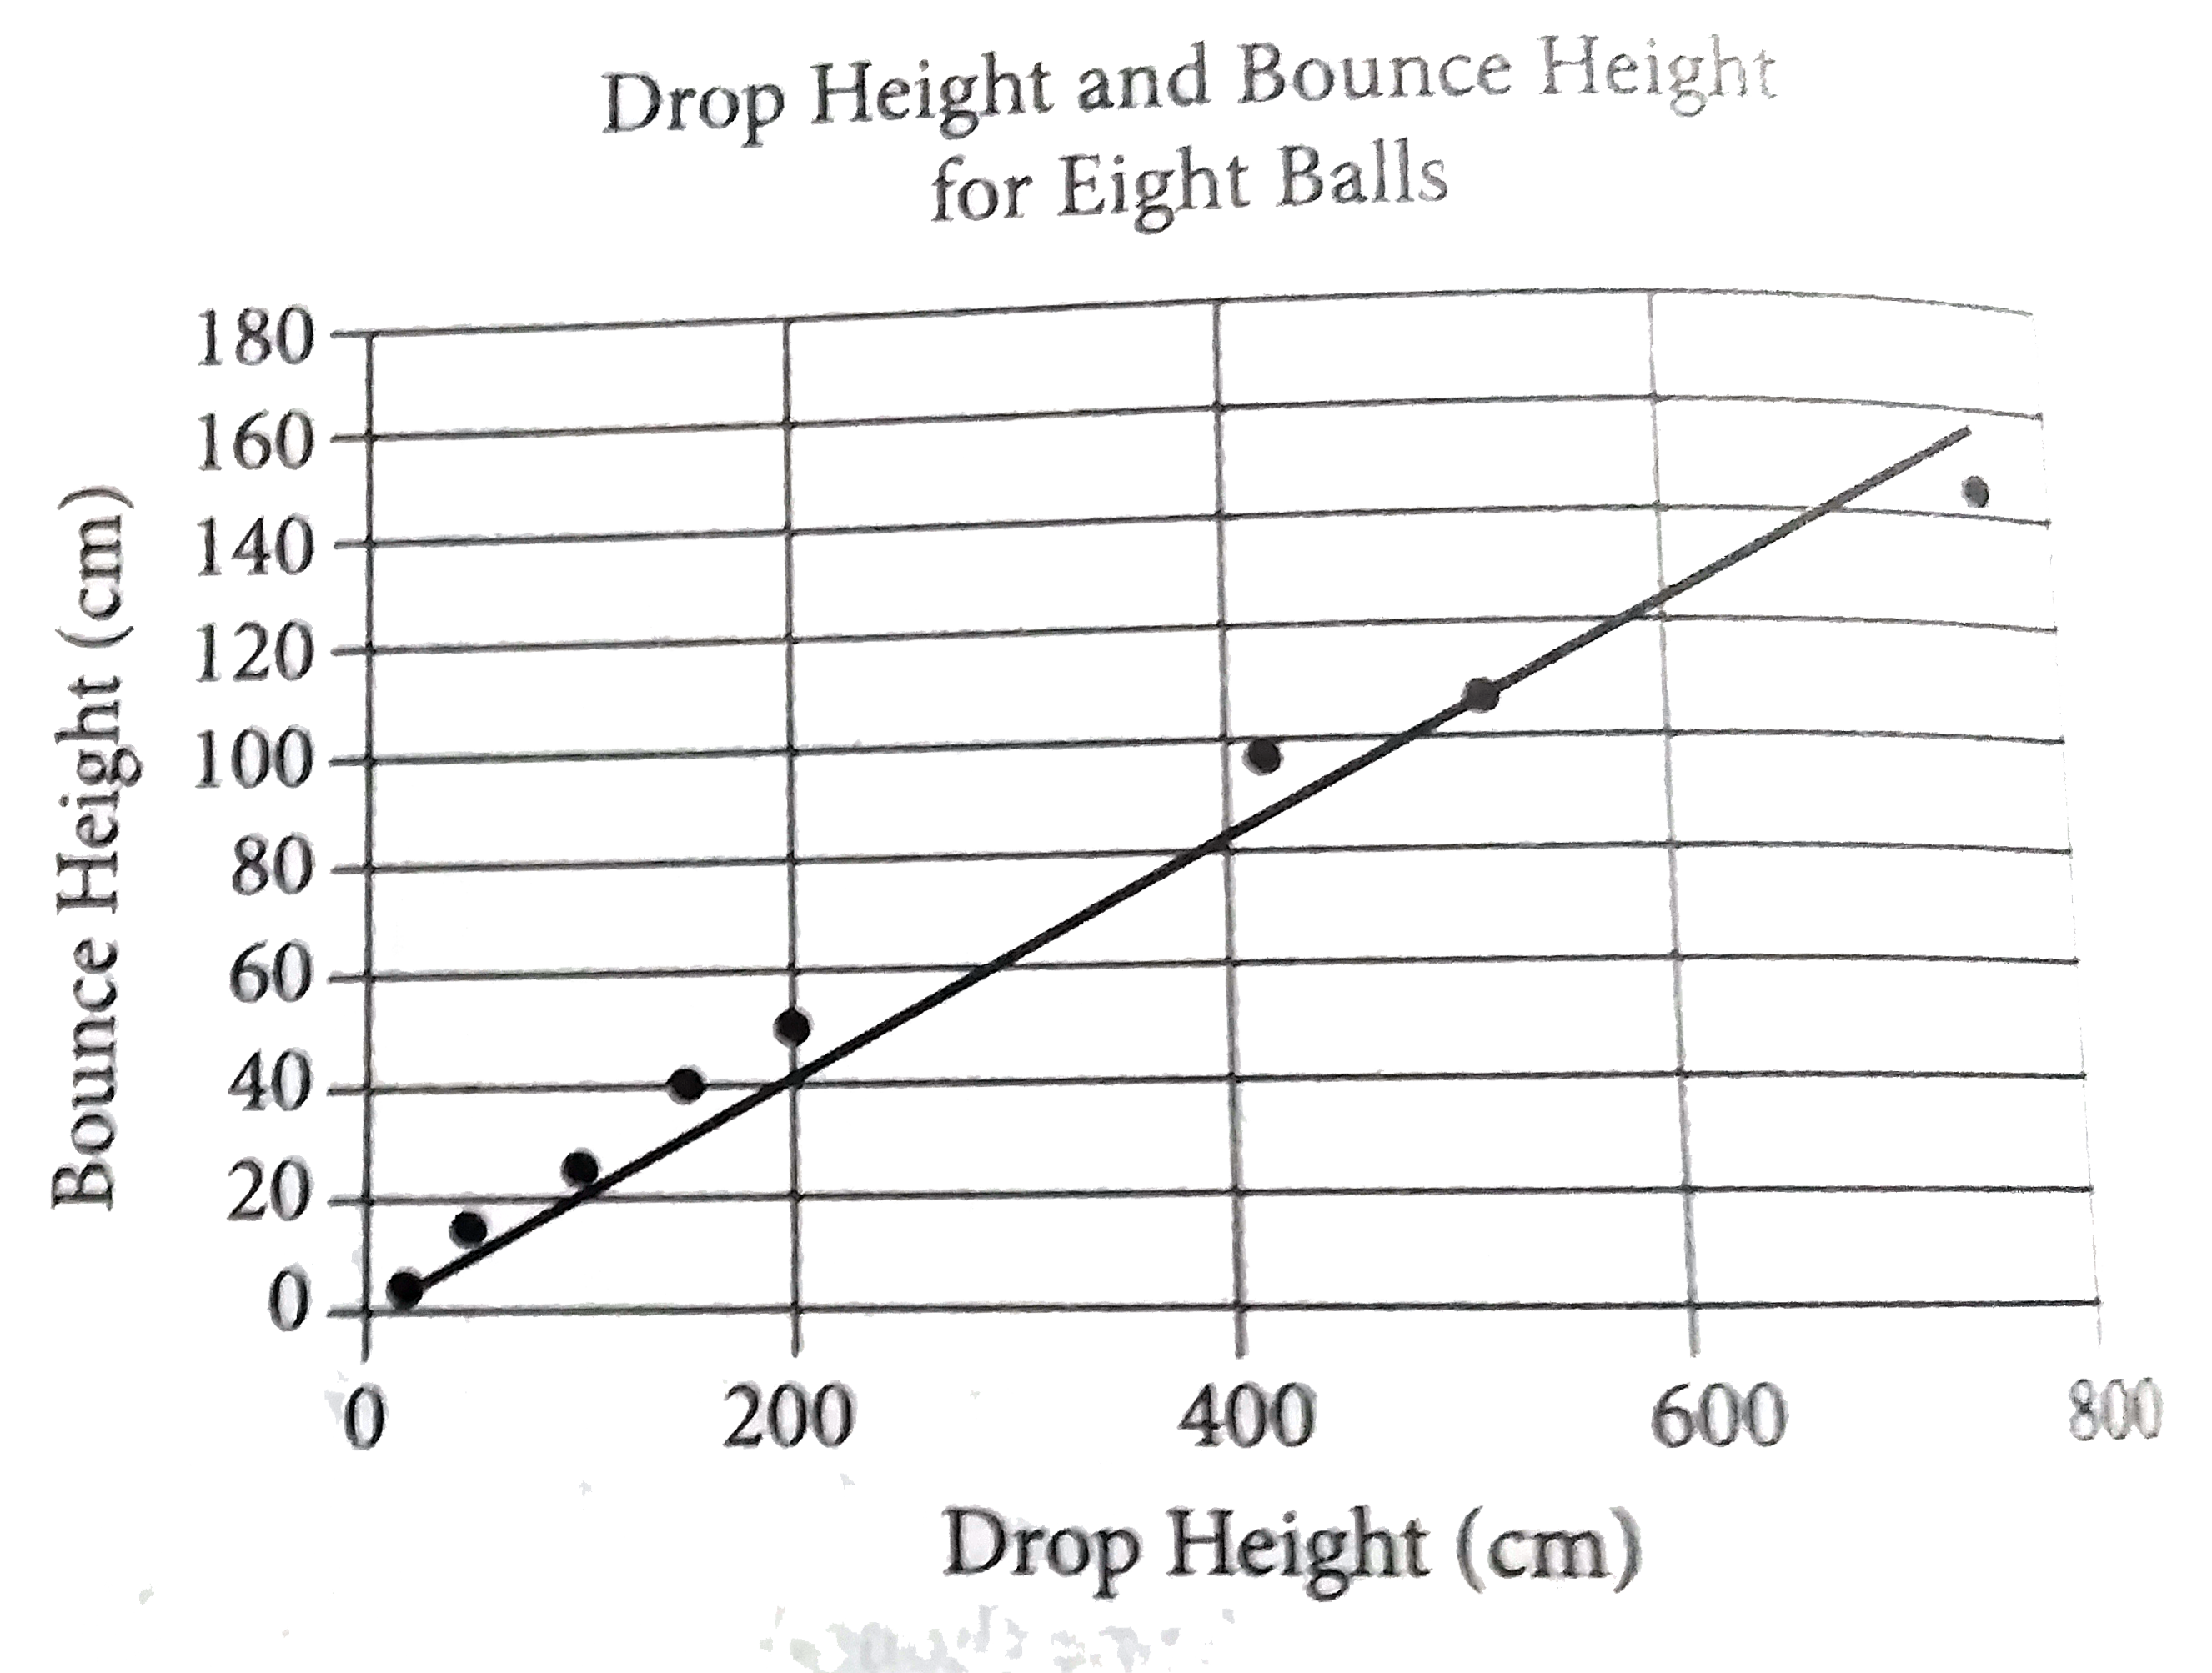
The scatterplot above shows the height in centimeters for both the drop and bounce of eight different balls of the same type. The line of best fit for the data is also shown. According to the lines of best fit, which of the following is closest to the predicted increase in bounce height, in centimeters, for every increase of 100 centimeters in drop height?View Solution
