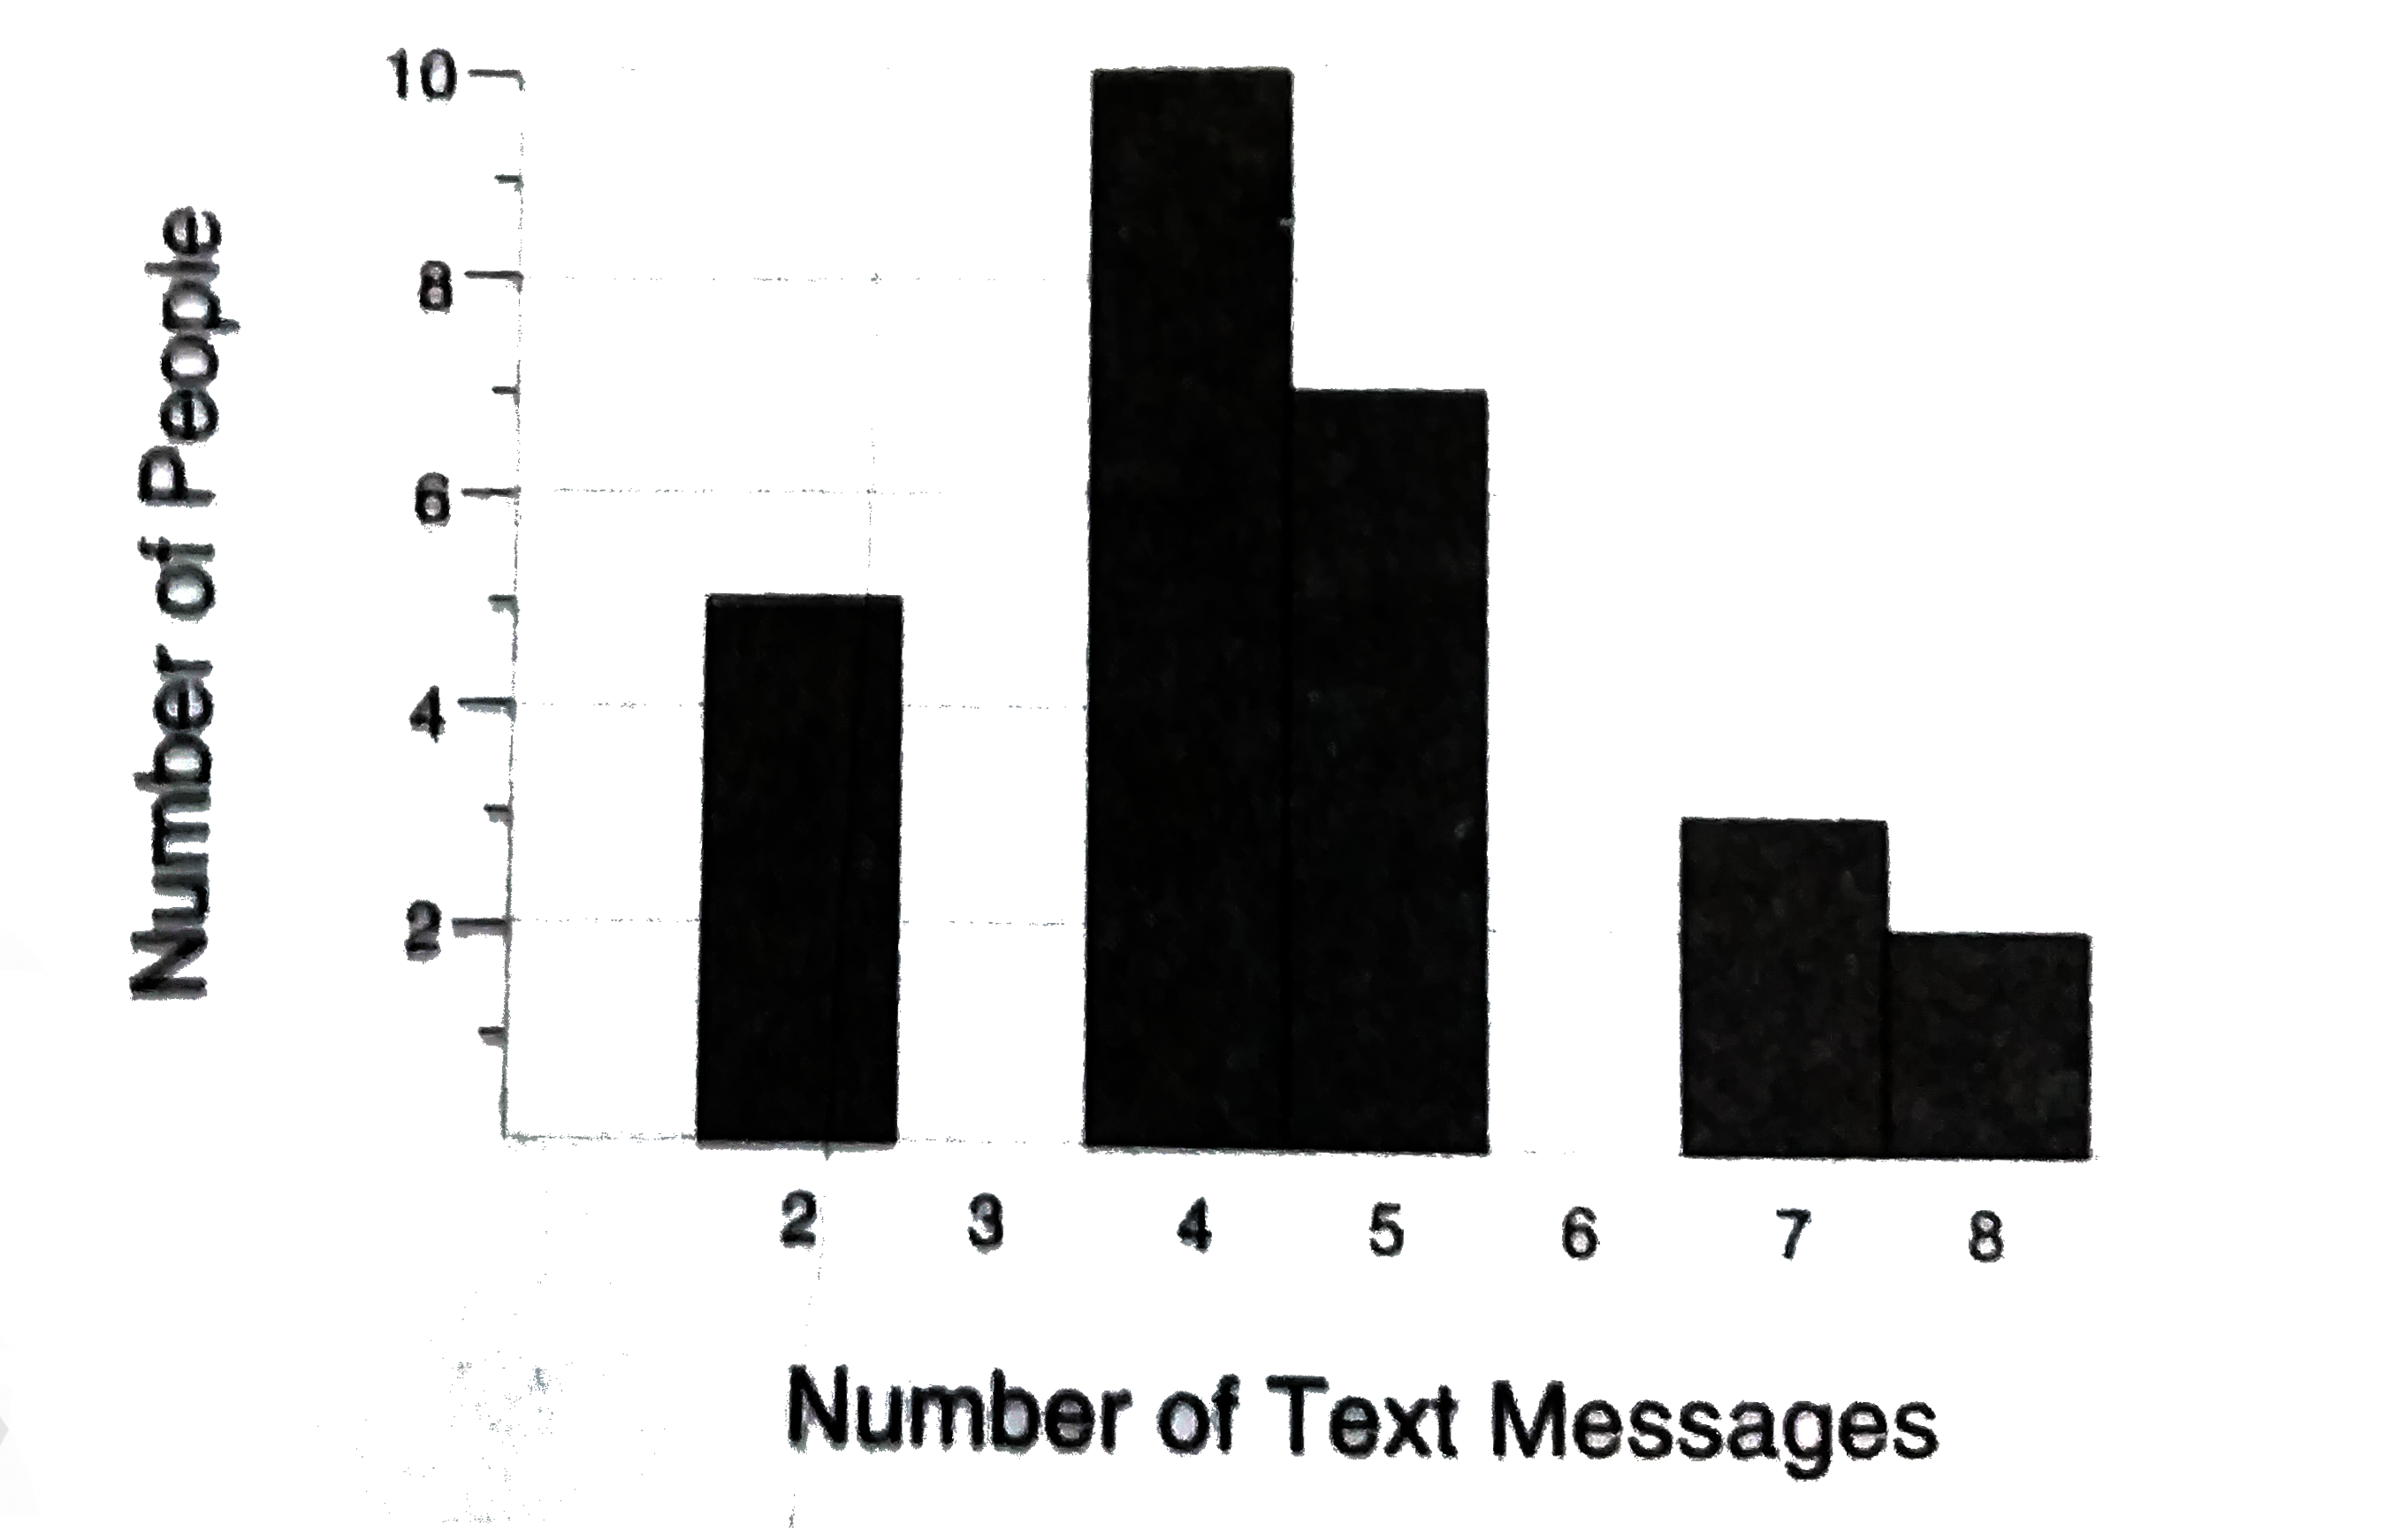
The histogram above shows the number of mobile text message sent by a randomly selected group of 27 people on a given day. The average number of text message sent per person is closest to what whole number?
The correct Answer is:5
Step by step video, text & image solution for The histogram above shows the number of mobile text message sent by a randomly selected group of 27 people on a given day. The average number of text message sent per person is closest to what whole number? by Maths experts to help you in doubts & scoring excellent marks in Class 12 exams.
Topper's Solved these Questions
- BOOK - ENGLISH SATCHAPTER - PROBLEM SOLVING AND DATA ANALYSISEXERCISE - Multiple Choice128videos
PROBLEM SOLVING AND DATA ANALYSIS
- BOOK - ENGLISH SATCHAPTER - PROBLEM SOLVING AND DATA ANALYSISEXERCISE - EXERICSE80videos
PROBLEM SOLVING AND DATA ANALYSIS
- BOOK - ENGLISH SATCHAPTER - PROBLEMS IN CONTEXT EXERCISE - PRACTICE TEST10videos
PROBLEMS IN CONTEXT
Similar Questions
The following histogram shows the number of literate females in the age group of 10 to 40 years in a town: 1. Write the age group in which the number of literate female is the highest. 2. What is the class width? 3. What is the lowest frequency? 4. What are the class marks of the classes? 5. In which age group literate females are the least?
View Solution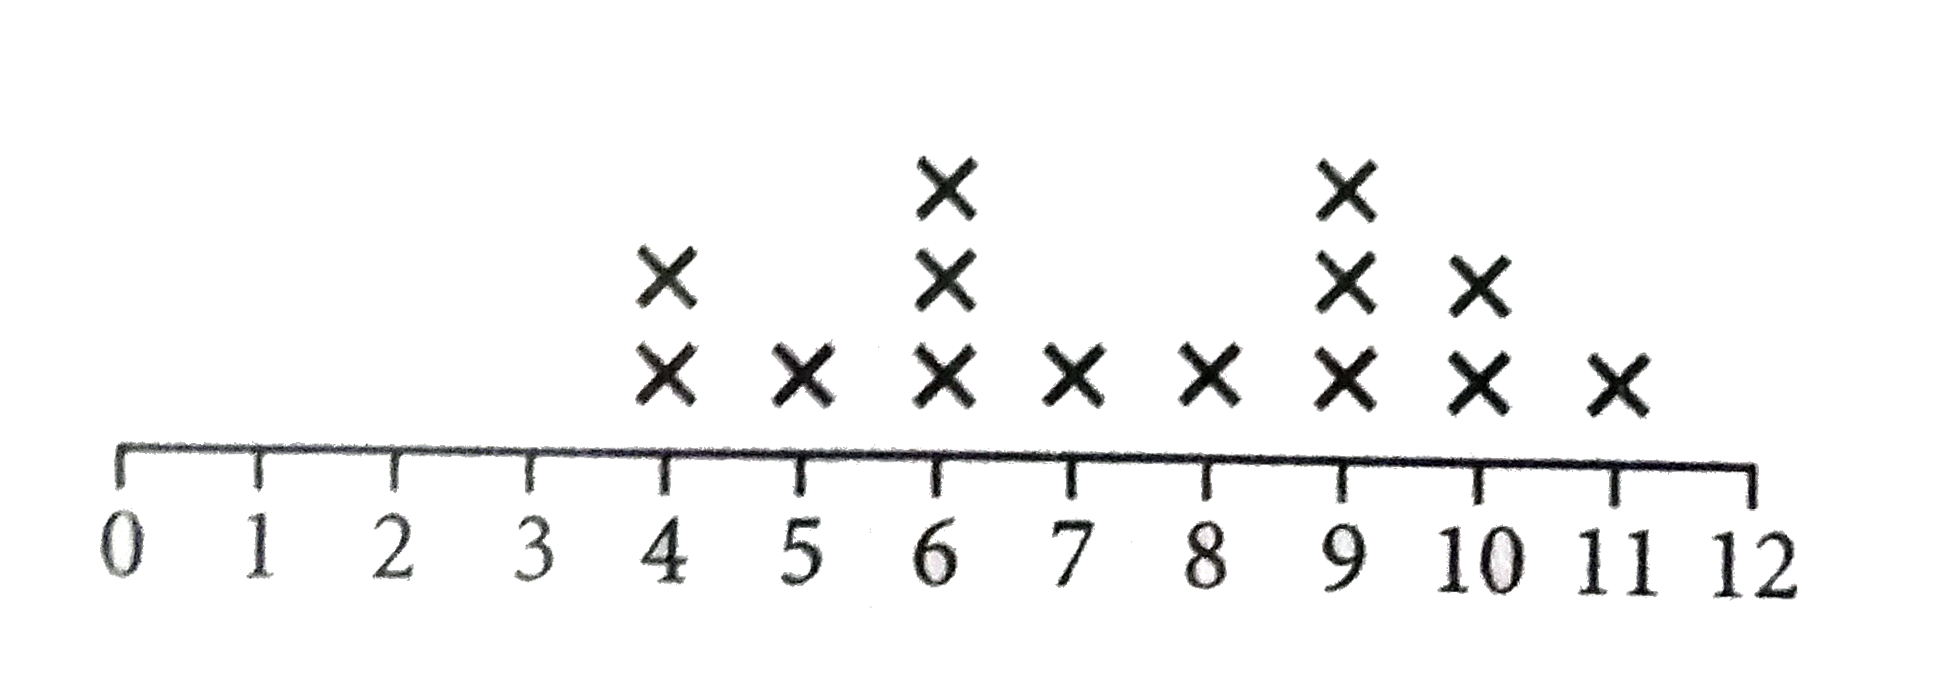
Brian and several of his work colleagues are on a kickball team together. The dot plot above shows the number of points his team scored during each of 14 games played so far this season. The league's record for highest average points scored per game during a season is 7.5. To break this record, a team's season average must be at least half a point higher. If Brian and his teammates are to set a new season record, how many points must they average during their final two games?View Solution
Knowledge Check
- Question 1 - Select One
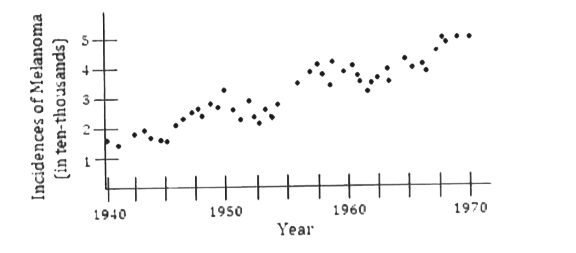
The scatterplot above shows the numbers of people diagnosed with melanoma, in ten - thousands, from 1940 to 1970. Based on the data shown in the figure, which of the following values is closest to the range of the number of incidences of melanoma between 1945 and 1950?A5000B10000C17000D36000 - Question 2 - Select One

The histogram above shows the result of a survey taken of 25 individuals who were polled about how many weeks of vacation per year they receive. Which of the following is closest to the average (arithmetic mean) number of weeks of vacation per individual?A2B3C4D5 - Question 3 - Select One
The graph below shows the number of students who were present on Thursday from each of the 5 groups in Ms. Meagan's class. What is the probability that a student selected at random from the class on Thrusday is in Group 4?
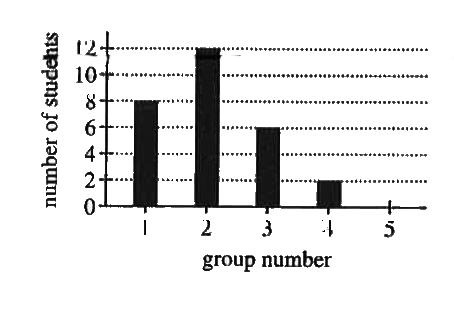 A128B114C15D14
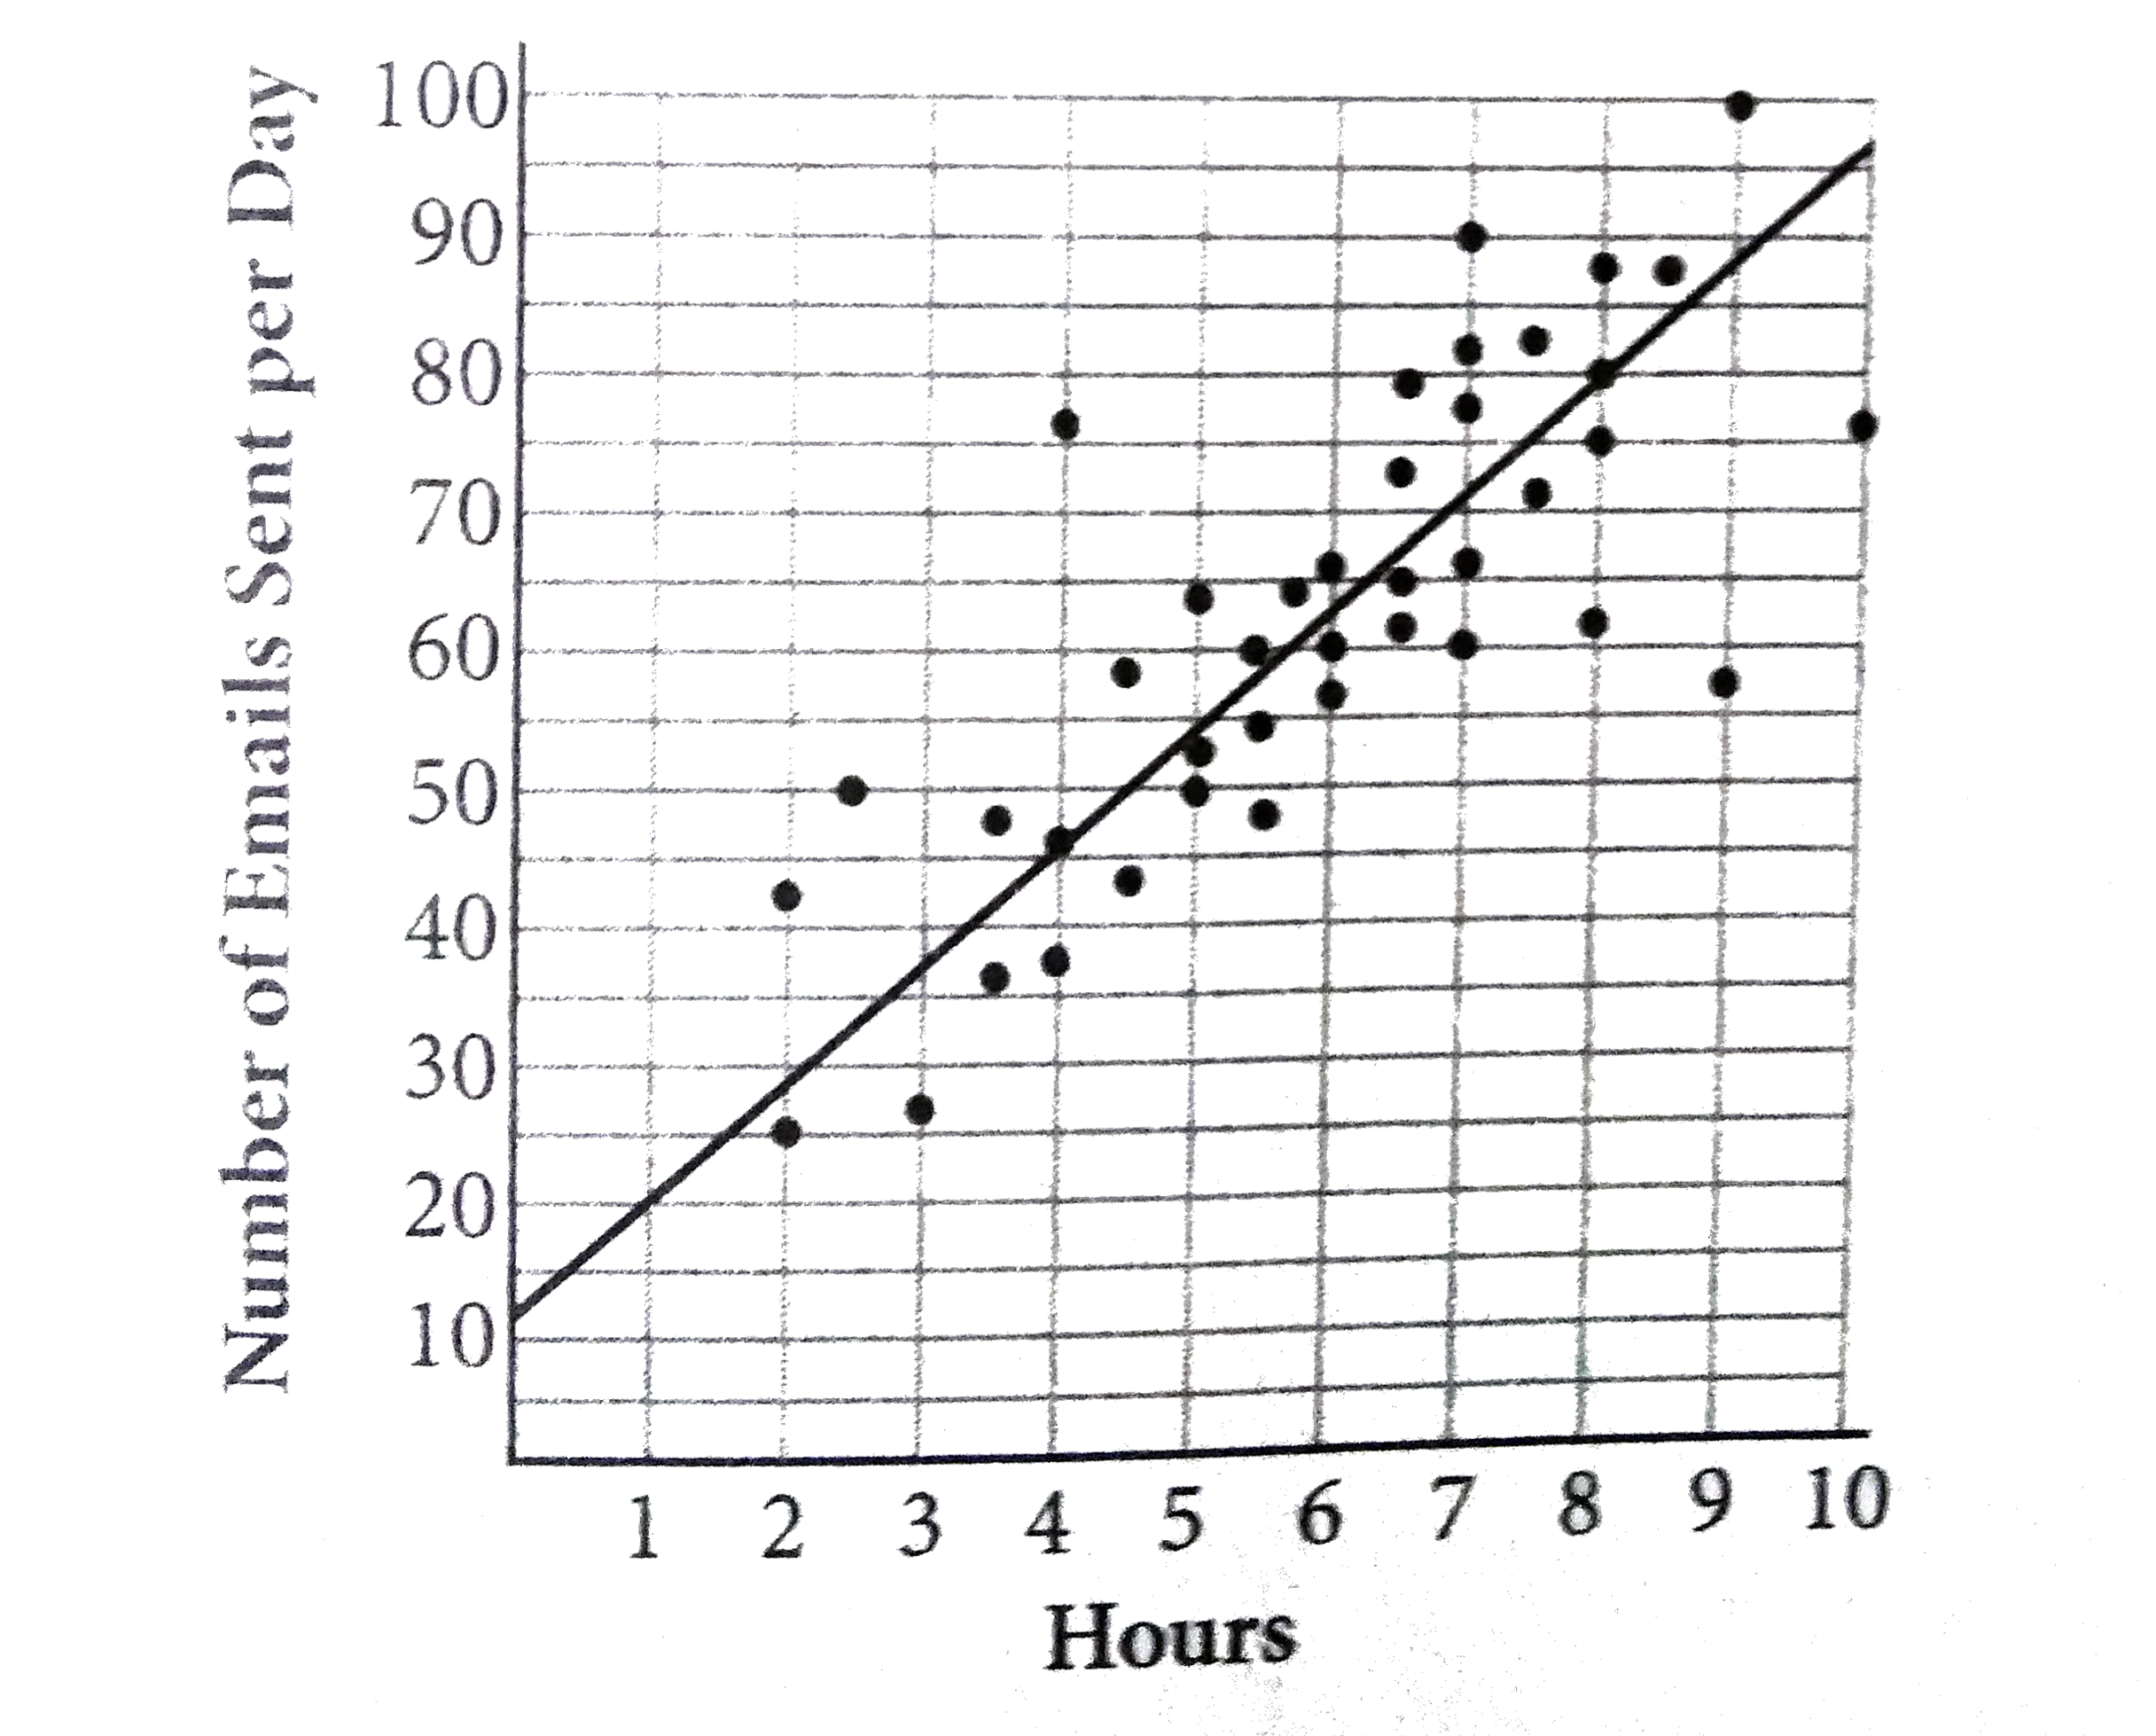
The figure above shows the number of emails sent per day plotted against the number of hours an adult works on a computer per day. Which of the following best estimates the average rate of change in the number of emails sent compared to the number of hours working on a computer?View SolutionExmine the given graph carefully.
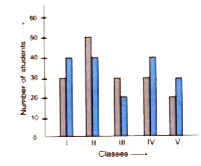
In the graph show above represents the number of girls in a particular class and represents the number of boys in the same class.
Read and answer the following questions.
(i) Which class has the least number of students ?
(ii) Which class has maximum number of students ?
(iii) What is the ratio between the number of girls and the number of boys of class V.View SolutionGiven below (figure) is the bar graph indicating the marks obtained out of 50 in mathematics paper by 100 students. Read the bar graph and answer the following questions: It is decided to distribute work books on mathematics to the students obtaining less then 20 marks, giving one workbook to each of such students. If a work book costs Rs.5, what sum is required to buy the work books? Every student belonging to the highest mark group is entitled to get a prize of Rs. 10. How much amount of money is required for distributing the prize money? Every student belonging to the lowest mark-group has to solve 5 problems per day. How many problems, in all, will be solved by the students of this group per day? State whether true or false. 17% students have obtained marks ranging from 40 to 49. 59 students have obtained marks ranging from 10 to 29. What is the number of students getting less than 20 marks? What is the number of students getting more than 29 marks? What is the number of students getting marks between 9 to 40? What is the number of students belonging to the highest mark group? What is the number of students obtaining more than 19 marks?
View SolutionA biologist was interested in the number of times a field cricket chirps each minute on a sunny day. He randomly selected 100 field crickets from a garden, and found that the mean number of chirps per minute was 112, and the margin of error for this estimate was 6 chirps. The bilogist would like to repeat the procedure and attempt to reduce the margin of error. Which of the following samples would most likely result in a smaller margin of error for the estimated mean number of times a field cricket chirps each minute on a sunny day?
View Solution
The frequency chart above shows number of absences for employees for a small business in a given year. The total number of employees was 43 . The following year , the employees are the same , and two employees are picked at random for an interview . What is the probability that both employees were absent between 11 and 14 times the previous year ?View Solution

