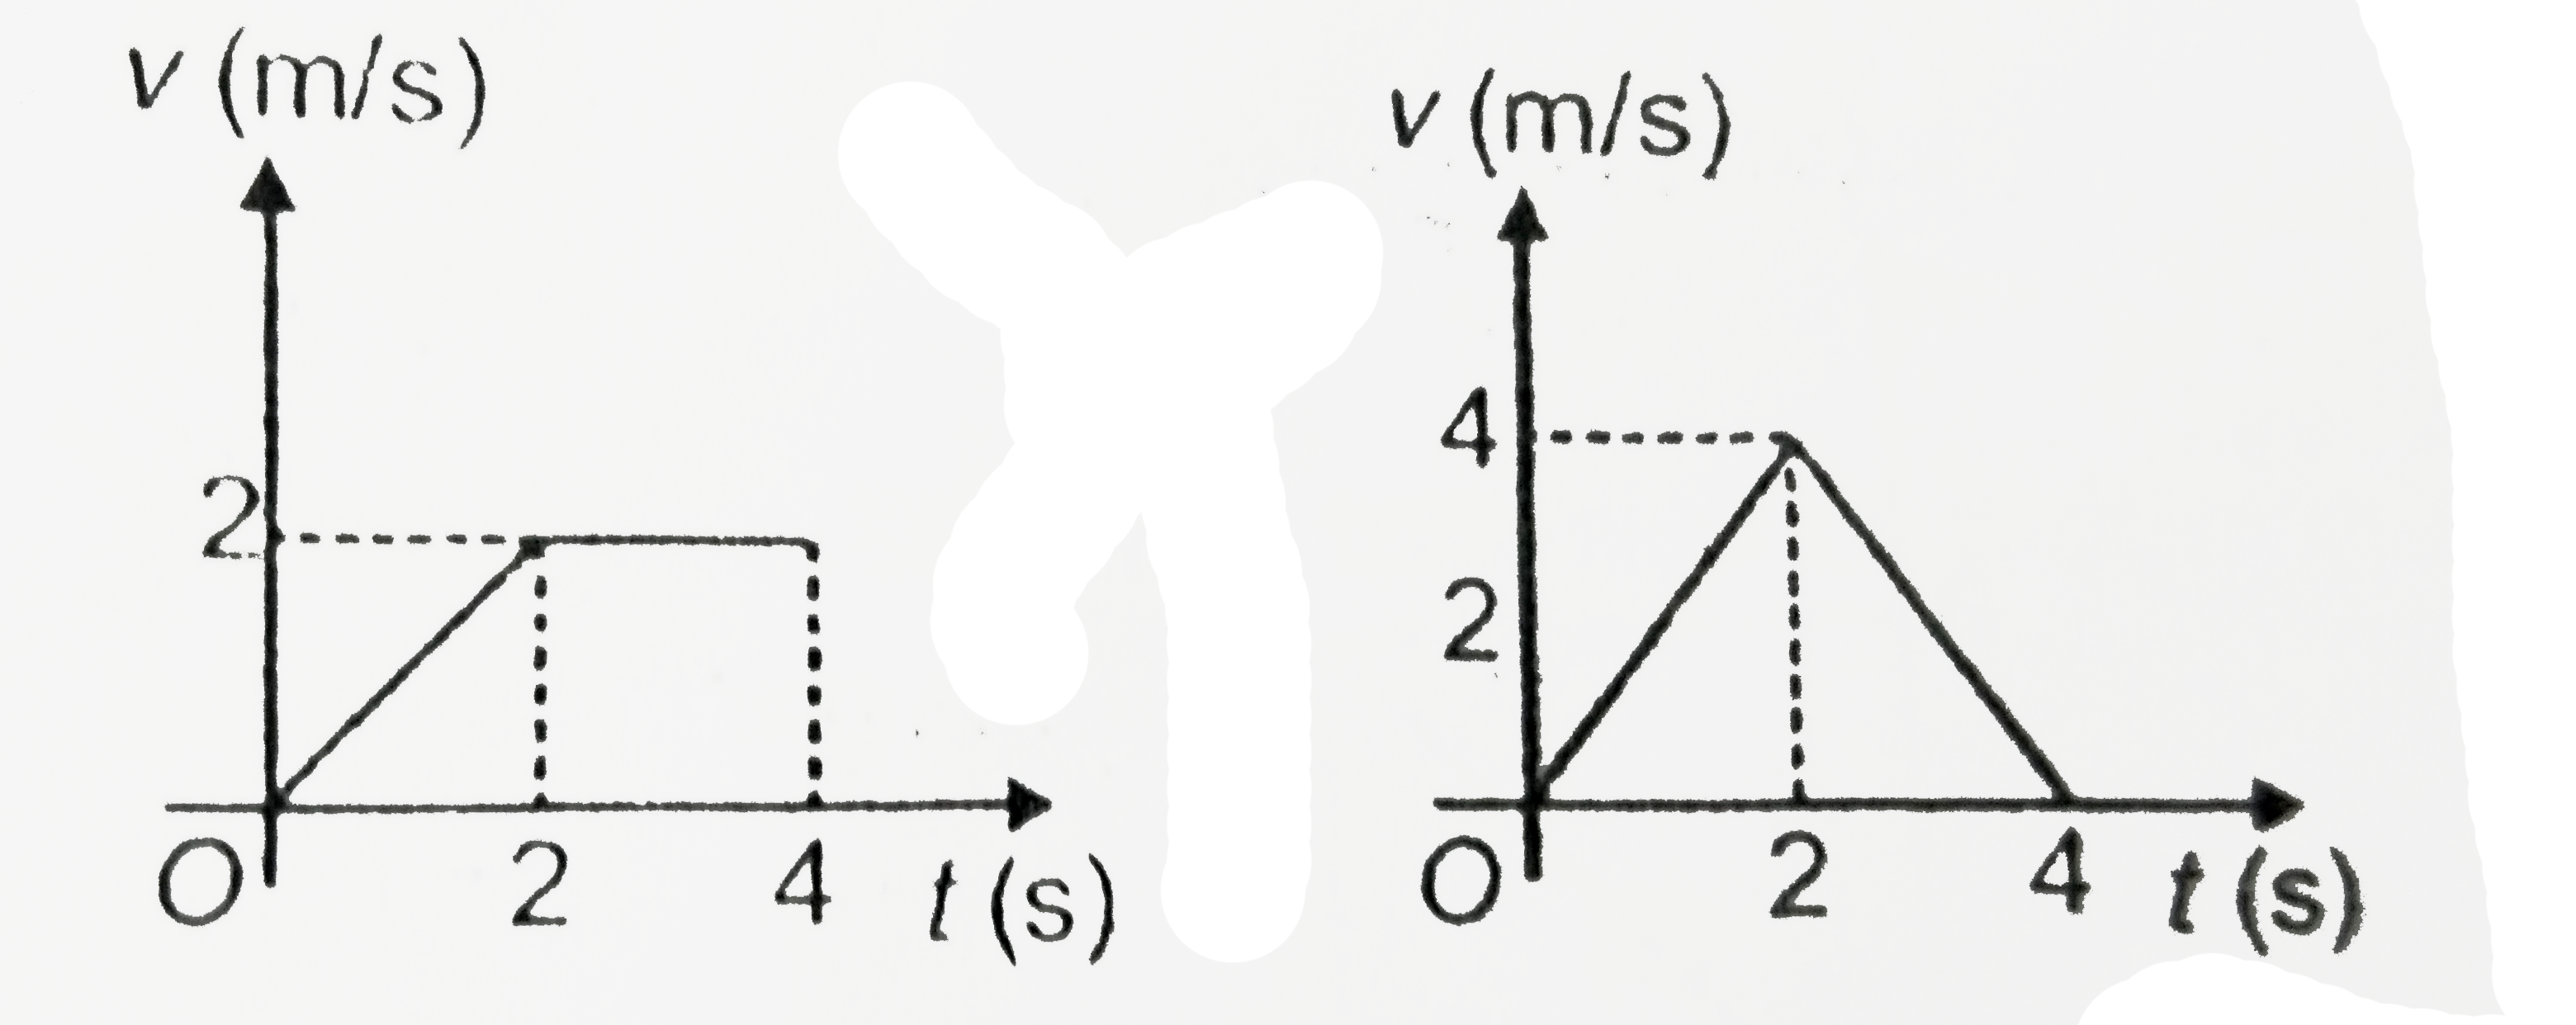
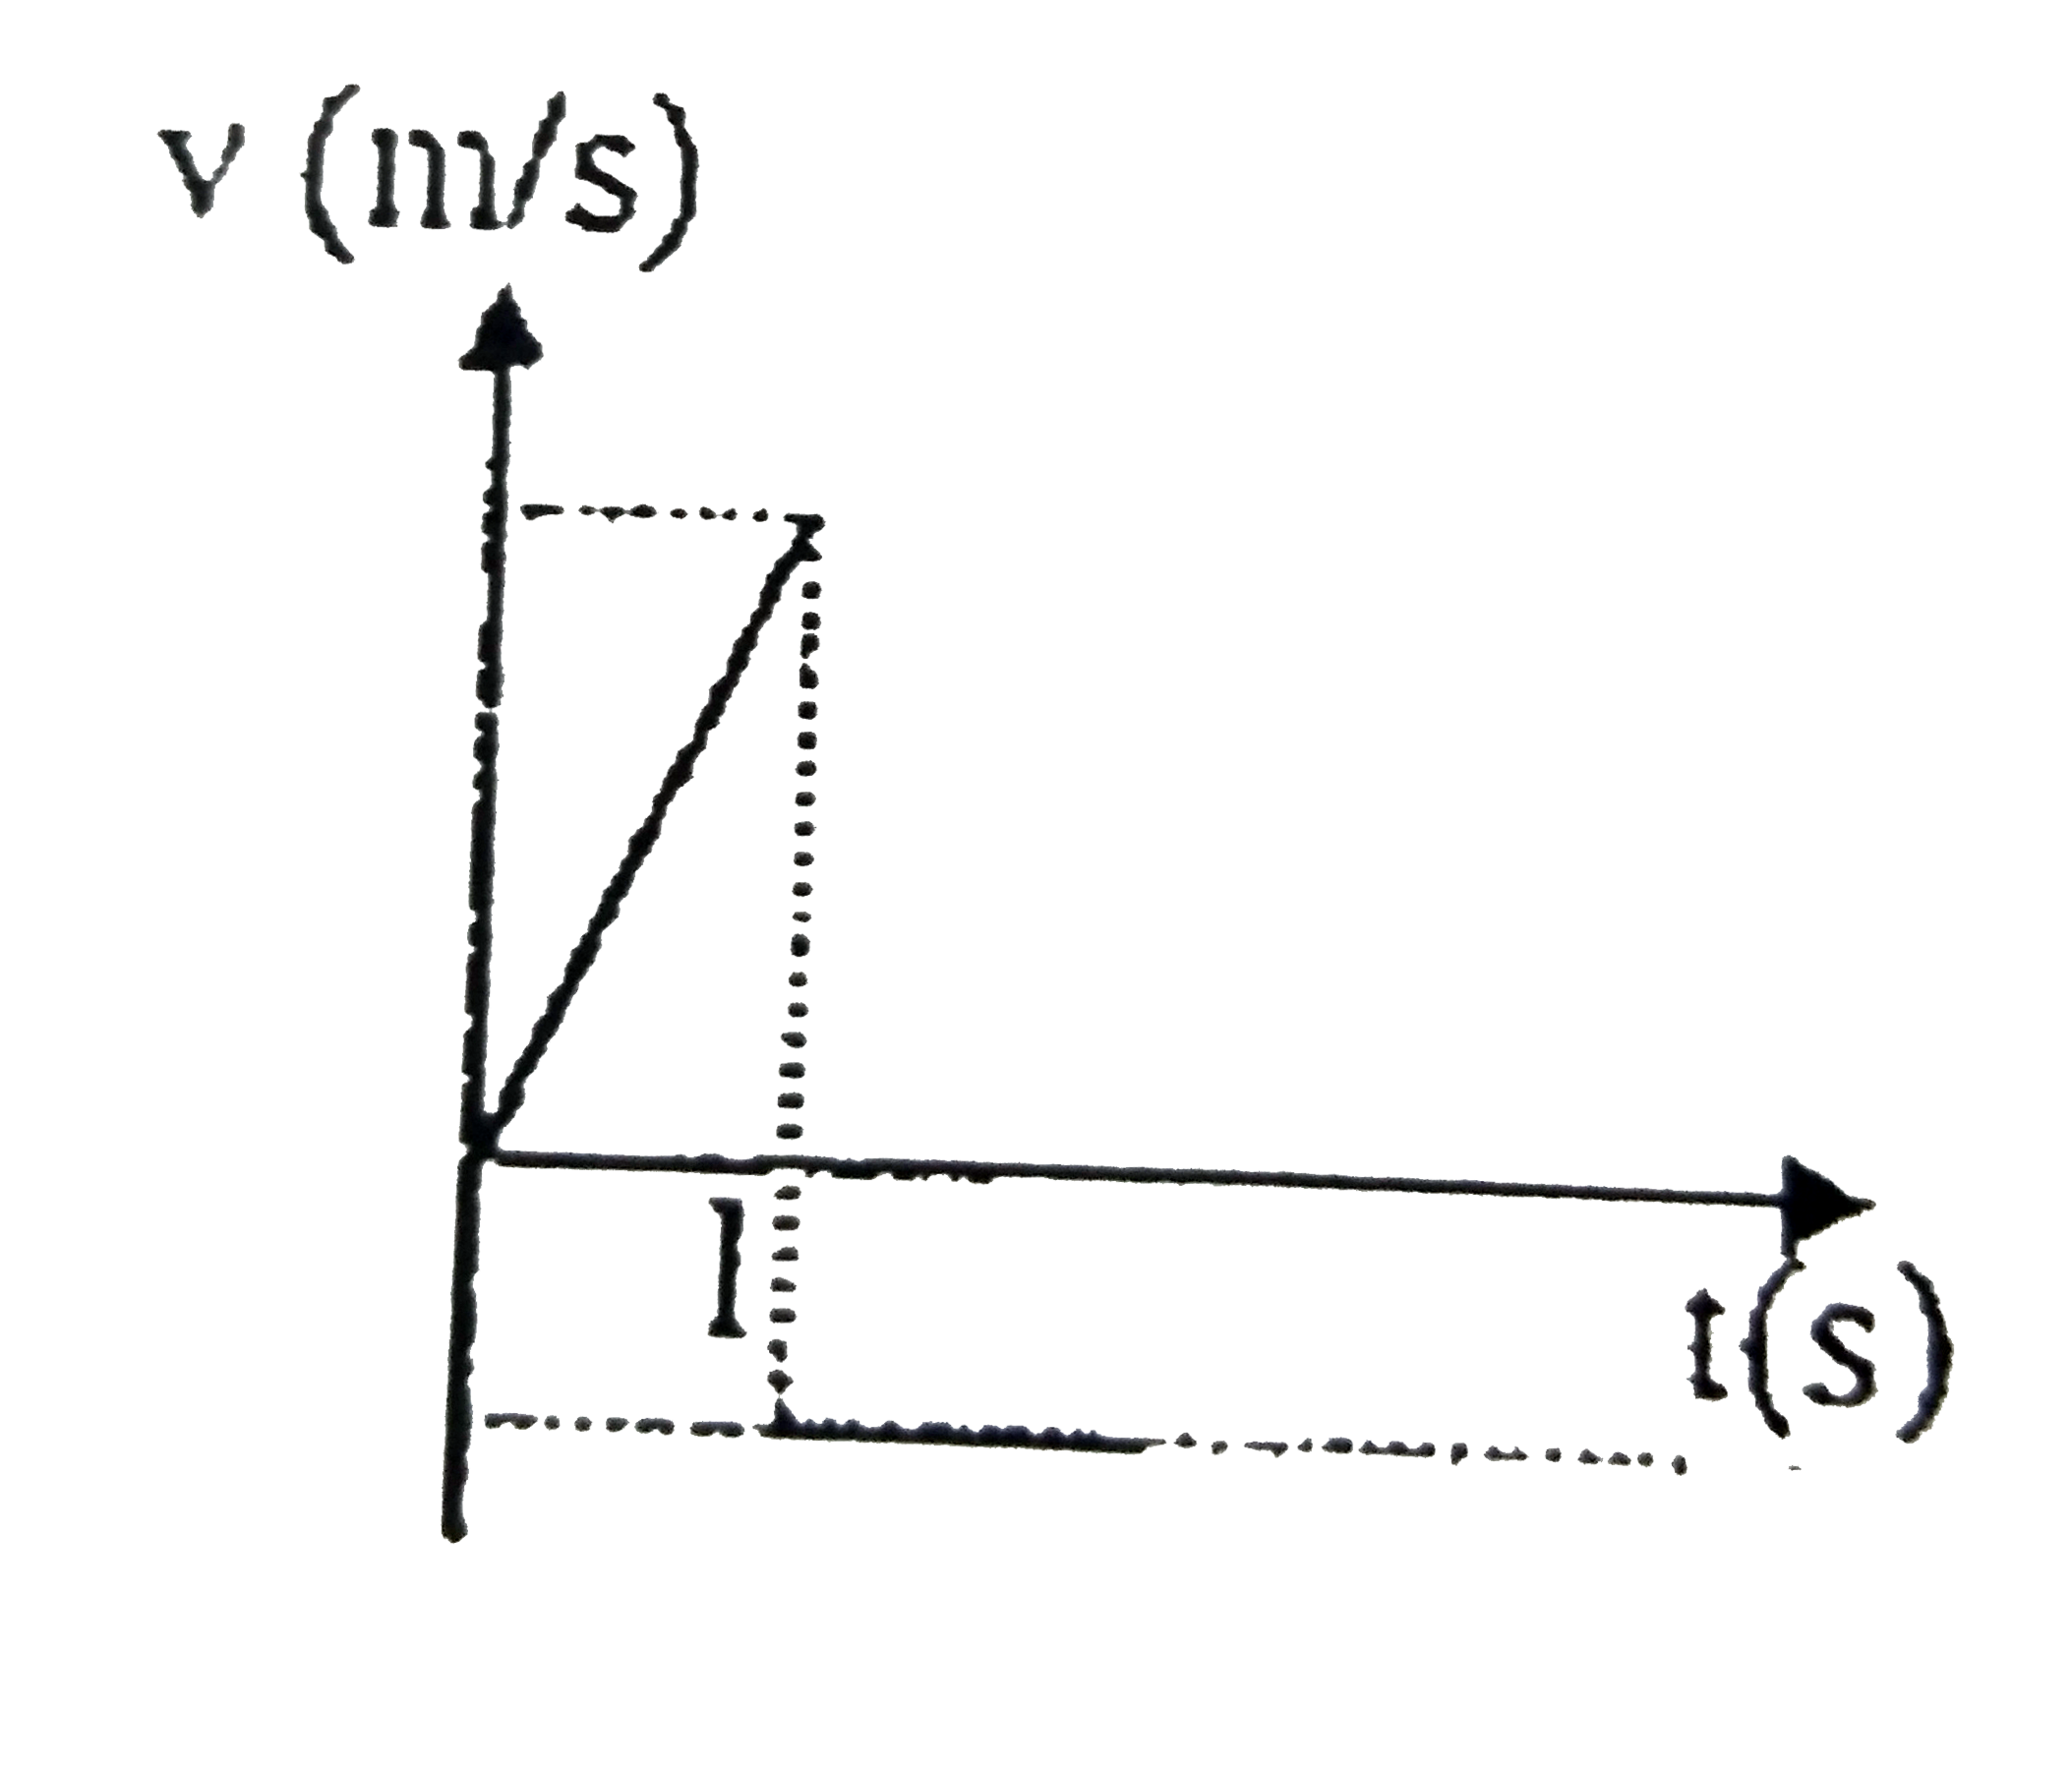
The velocity versus time of two particles moving along x-axis varies as shown in the following two plots. Then
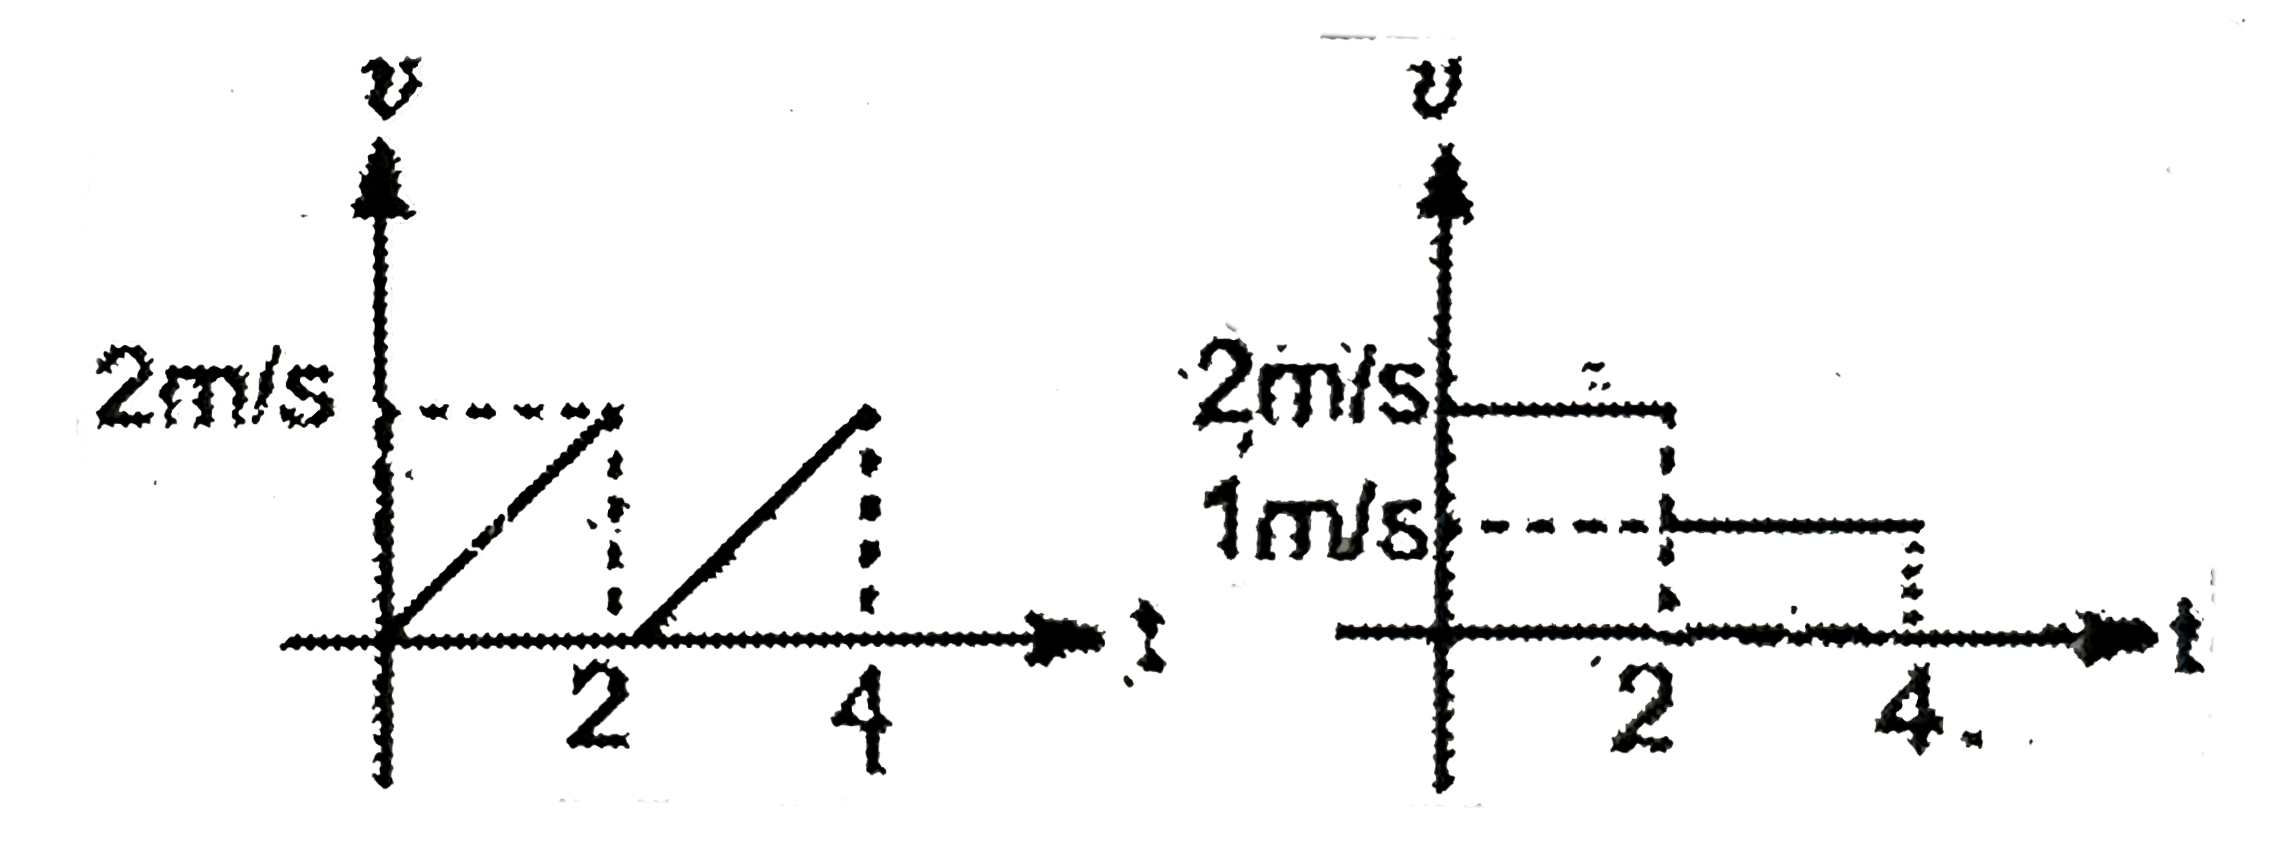
maximum separation between the two particles is 2m
maximum separation between the two particles is 2.5 m
maximum separation between occurs after time · t=2sec
maximum separation between occurs after time t=3sec
The correct Answer is:B, D
Topper's Solved these Questions
Similar Questions
Knowledge Check
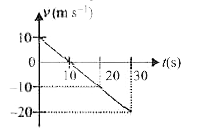
The velocity time plot for a particle moving on straight line is shown in the figure.
 AThe particle has a constant accelerationBThe particle has nevedr turned aroundCThe paeticle has zero displacement.DThe average speed in the interval 0 to 10 s is the same as the average speed in the interval 10 s to 20s.
The velocity- time plot for a particle moving on a straight line is shown in the figure
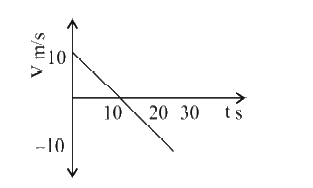 Athe particle has a non uniform accelerationBthe particle has never turned aroundCthe particle has zero displacementDthe average speed in the interval 0 to 10 s is the same as the average speed in the interval 10 s to 20 s
The velocity (υ) of a particle moving along X-axis varies with its position x as shown in figure. The acceleration (a) of particle varies with position (x) as
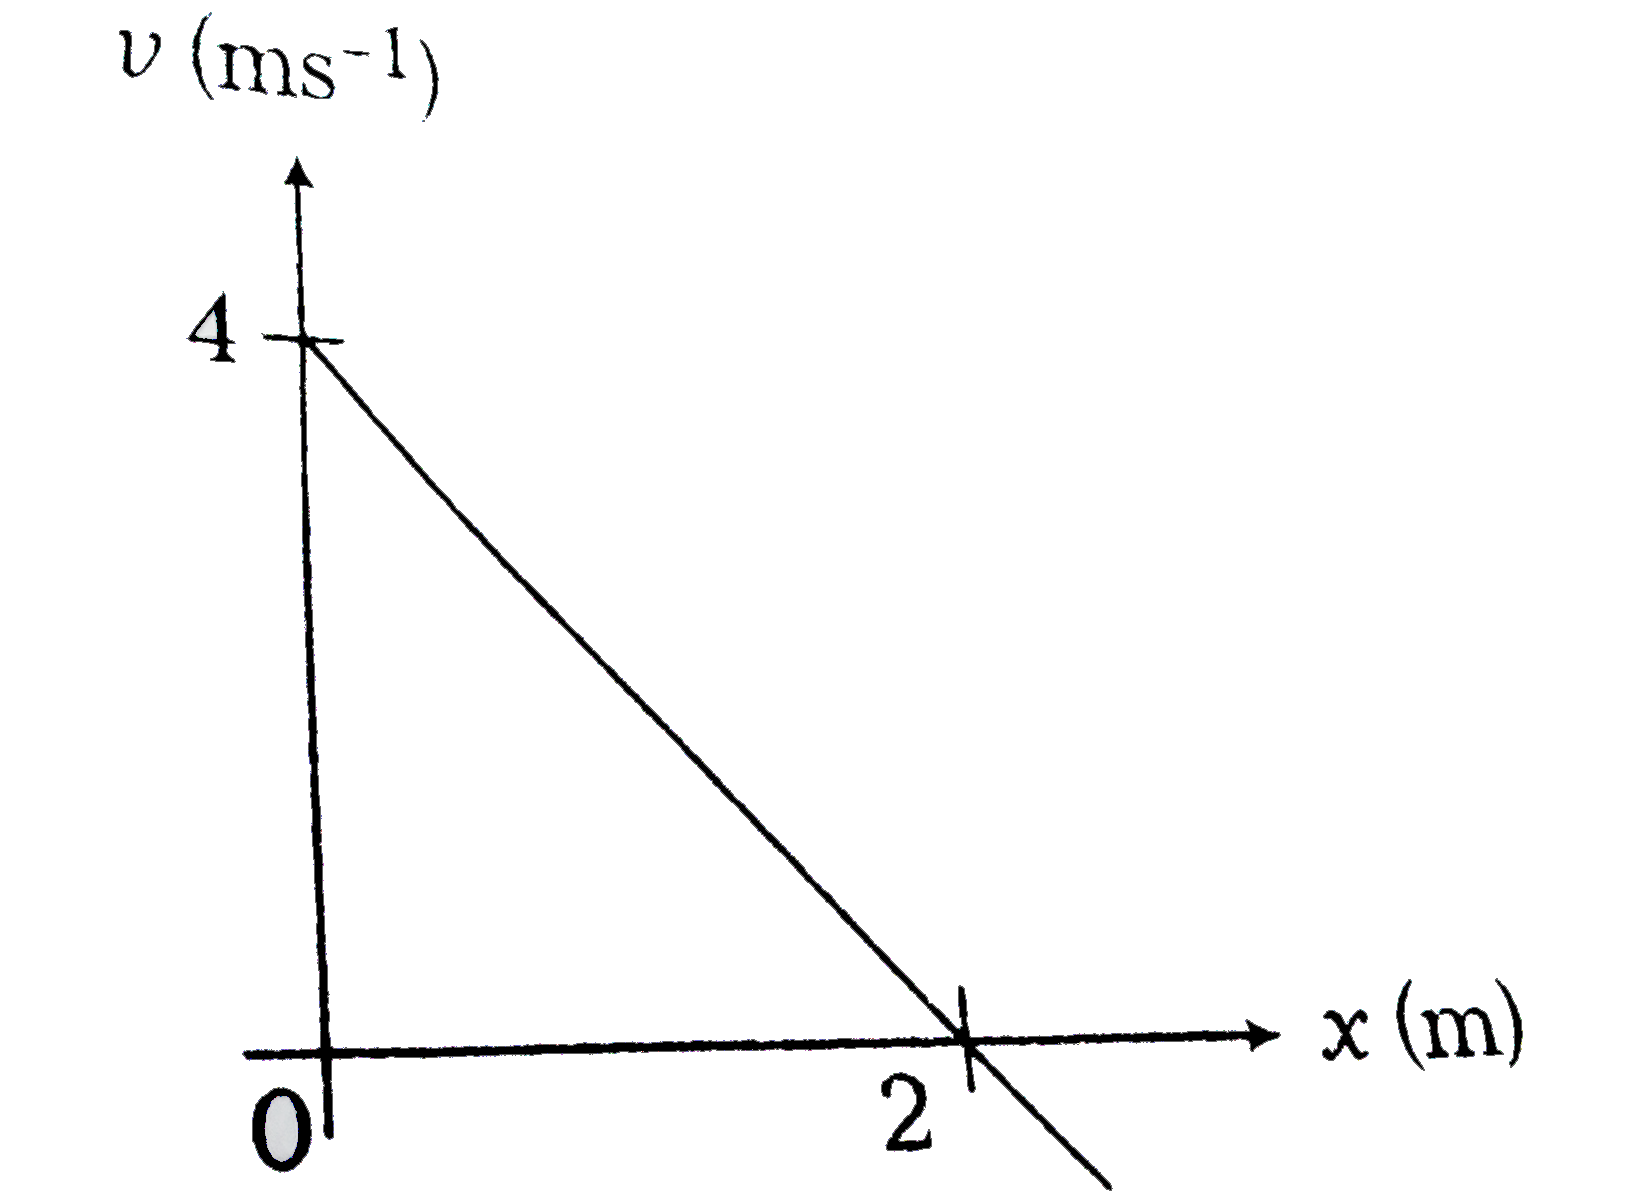 Aa2=x+3Ba=2x2+4C2a=3x+5Da=4x−8
The velocity time plot for a particle moving on straight line is shown in the figure.

View SolutionThe velocity time plot for a particle moving on straight line is shown in the figure.

View SolutionThe velocity (υ) of a particle moving along X-axis varies with its position x as shown in figure. The acceleration (a) of particle varies with position (x) as

View SolutionThe velocity time graph for a particle moving along x-axis is shown in the figure. The corresponding displacement time graph is correctly shown by
View SolutionThe velocity-time plot for a particle moving on a straight line is shown in figure.
View Solution

