Column A gives a list of possible set of parameters measured in some experiments . The variations of the parameters in the form of graphs are shown in column B.
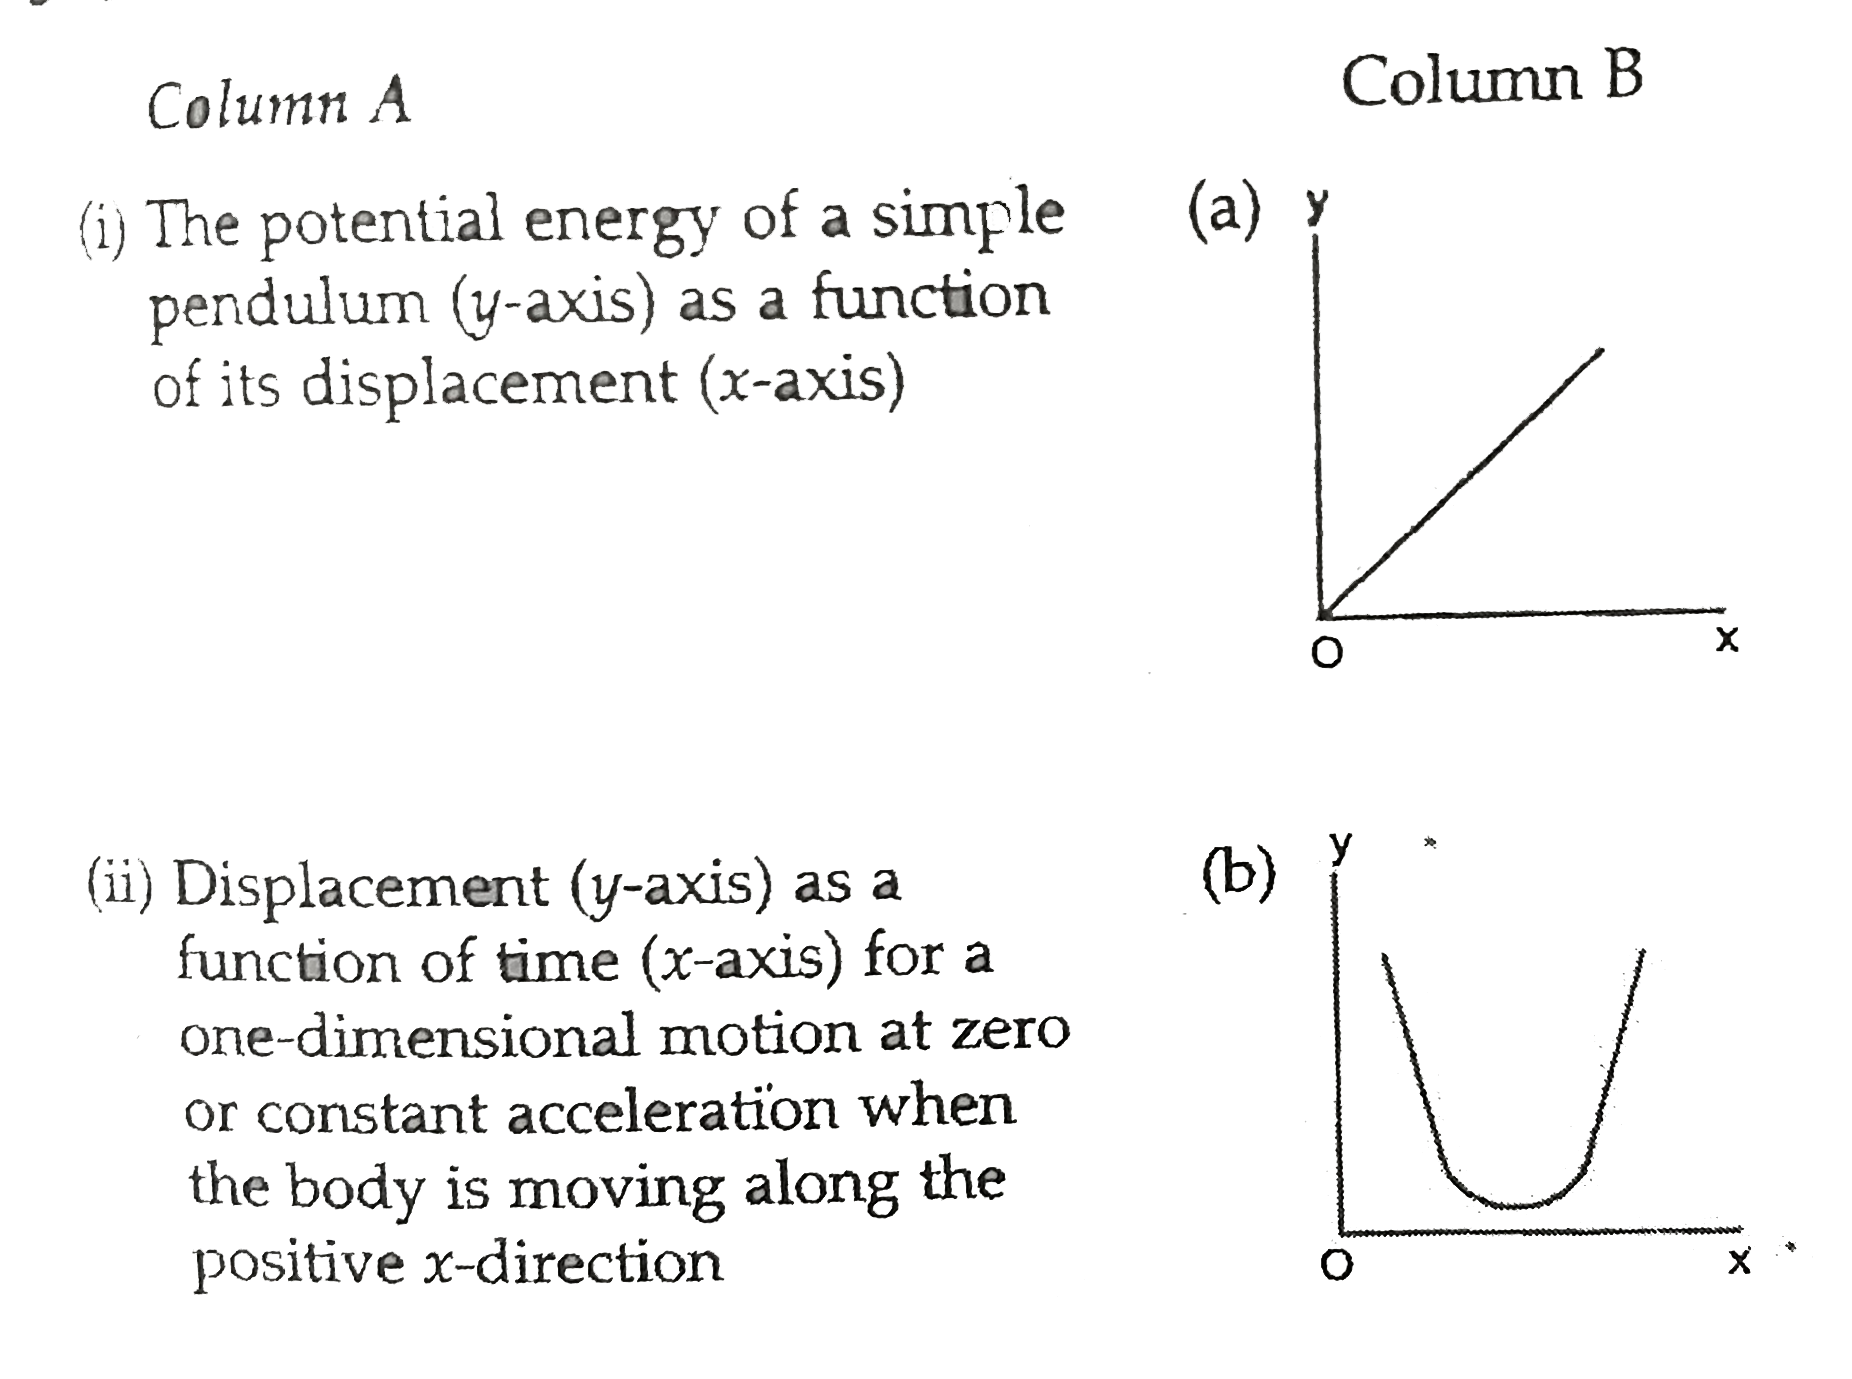
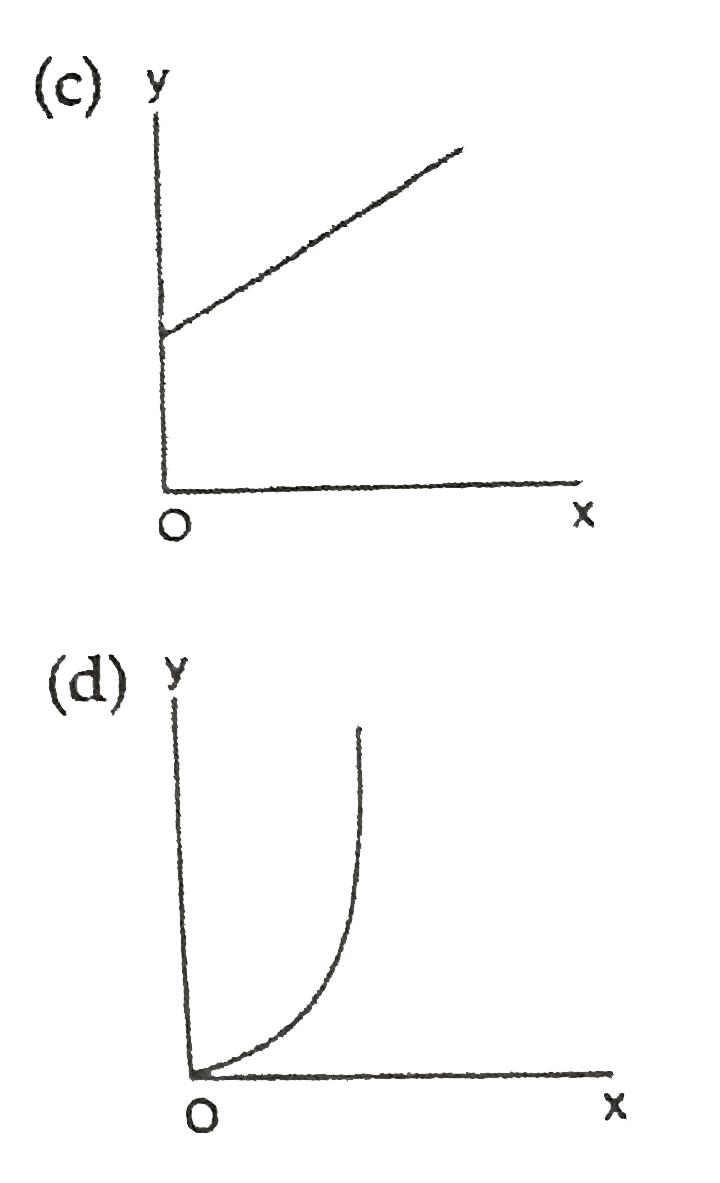
The correct Answer is:(##DRMMECPHYC09PTP5_E01022_A01##)
Topper's Solved these Questions
Similar Questions
Column I gives a list of possible set of parameters measured in some expreriments. The variations of the parameers in the form of graphs are shown in Column II. Match the set of parameters given in Column I with the graphs given in Column II.
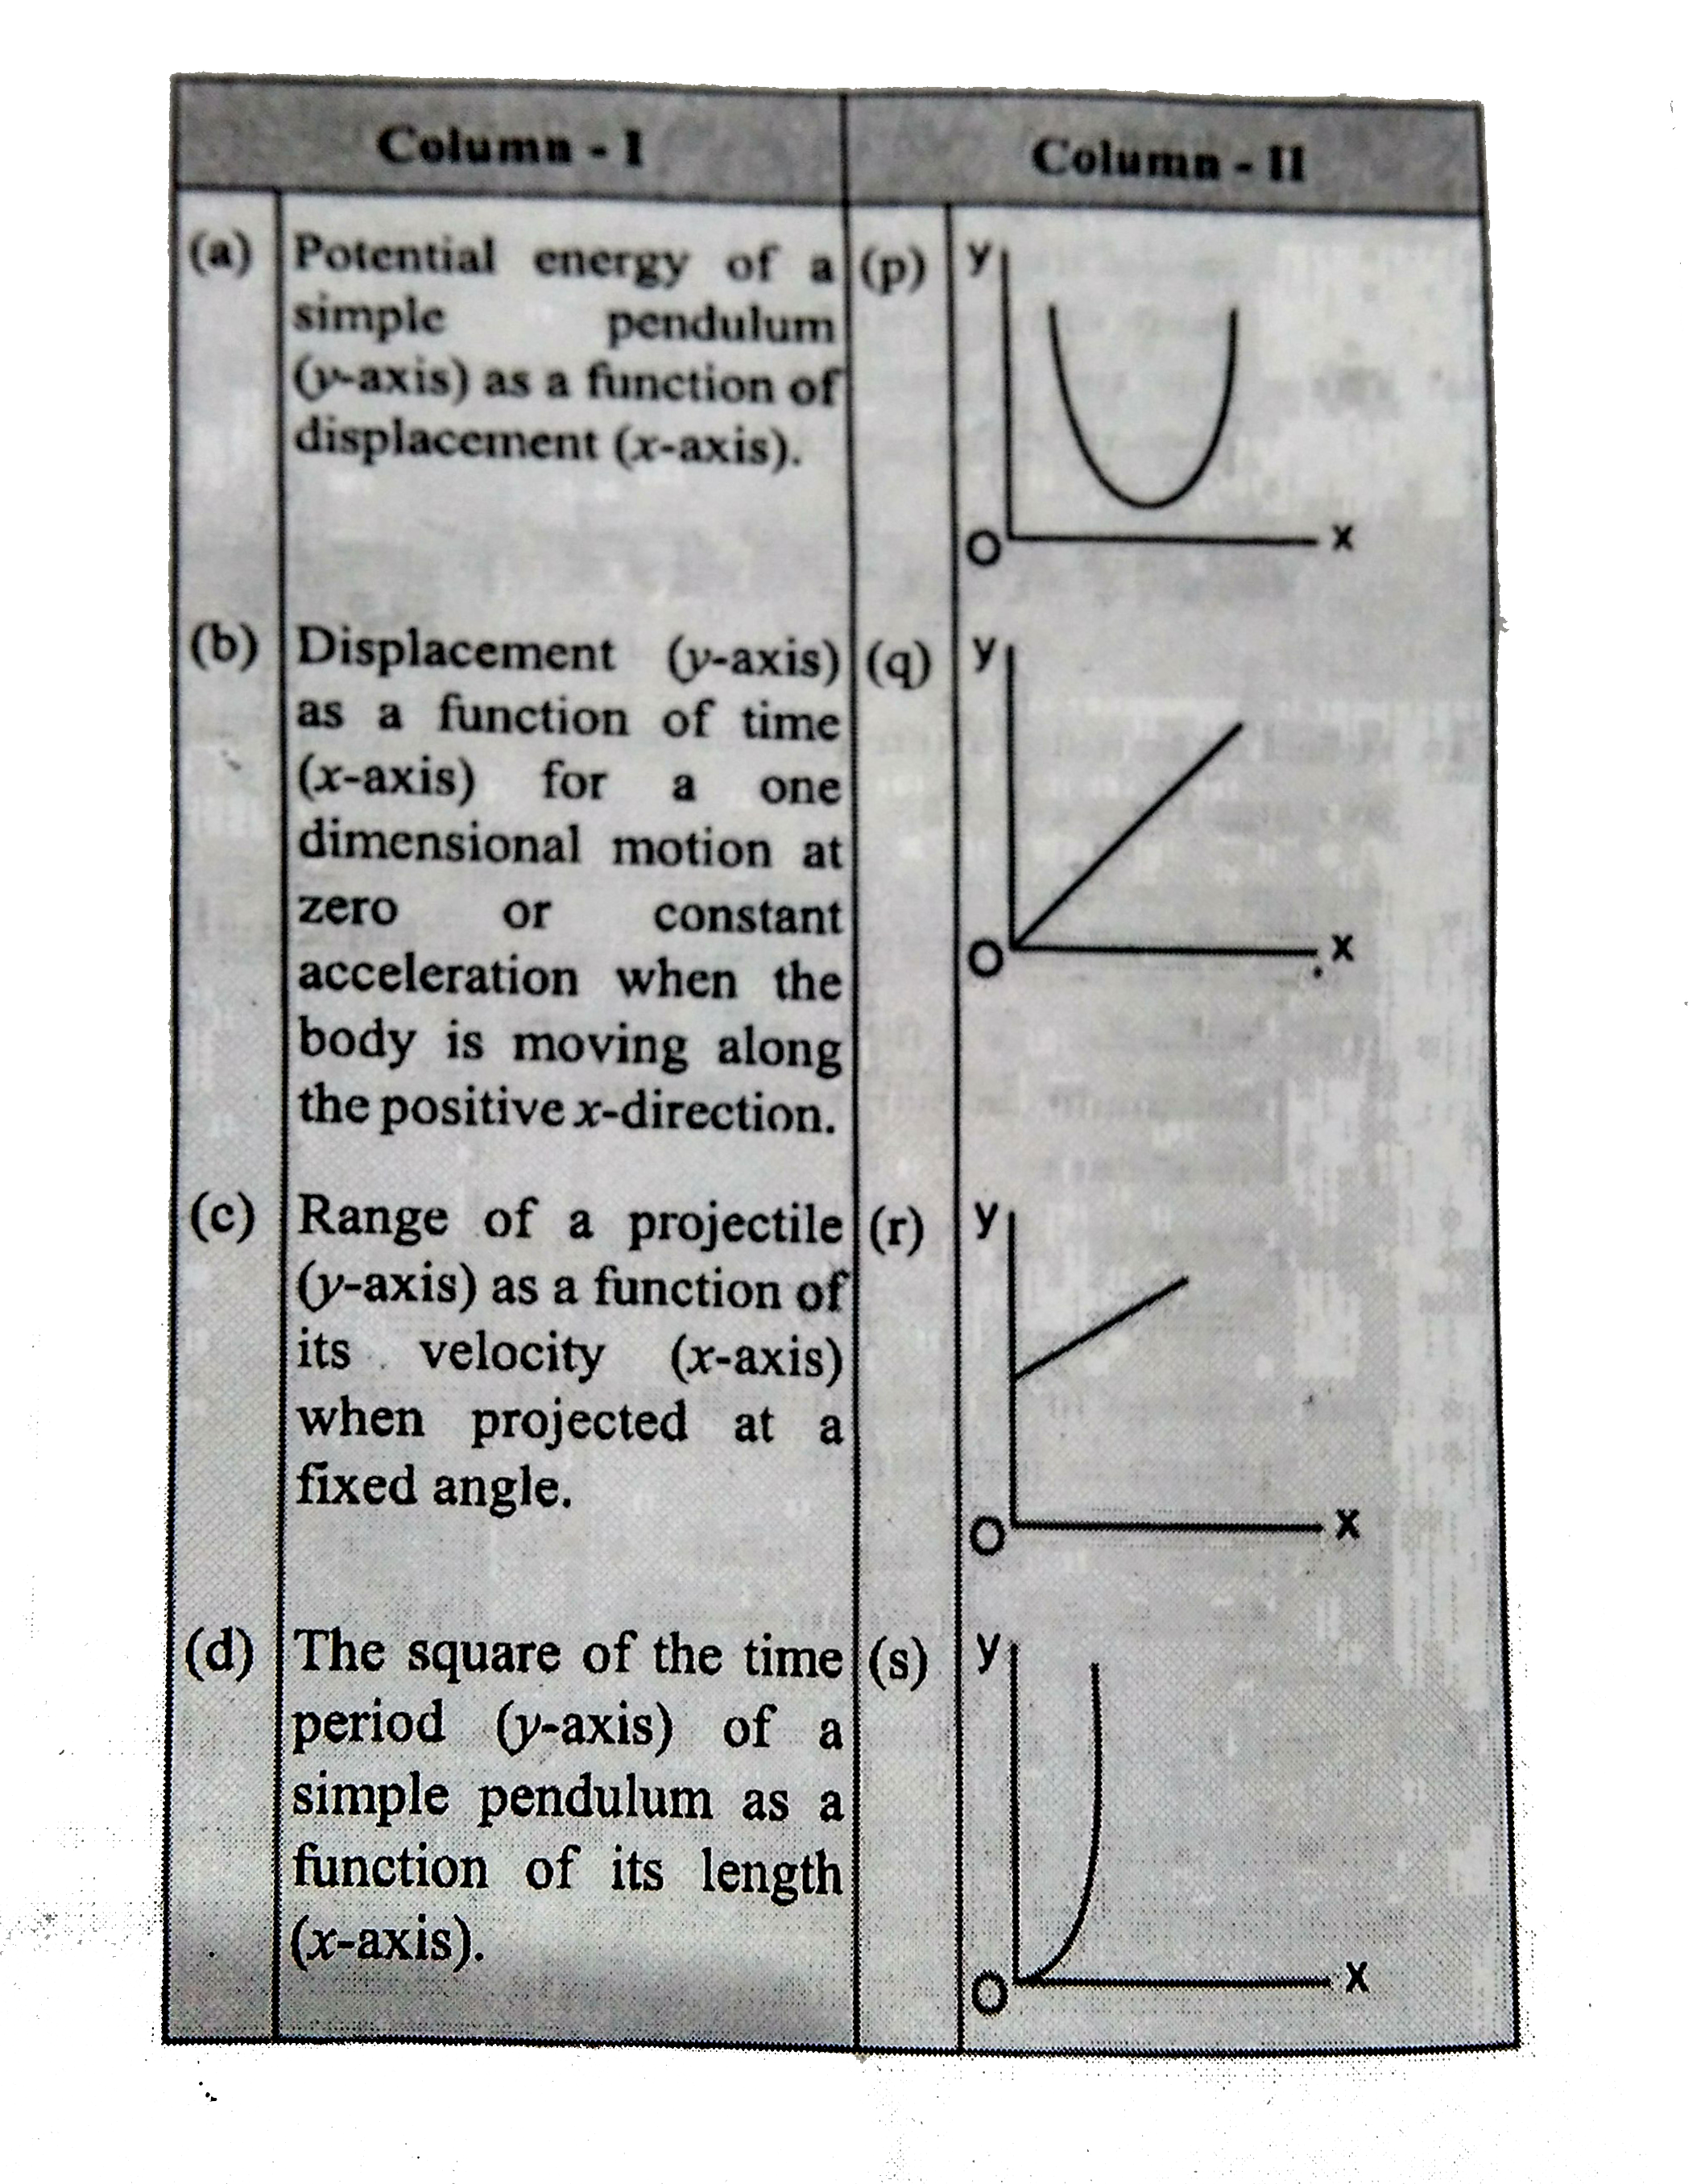
View SolutionColumn I gives a listof possible set of parameters measured in some experiments. The variations of the parameters in the form of graphs are shown in Column II. Match the set of parameters given in Column I with the graphs even in Column II. Indicate your answer by darkening the appropriate bubbles of the 4×4 matrix given in the ORS.
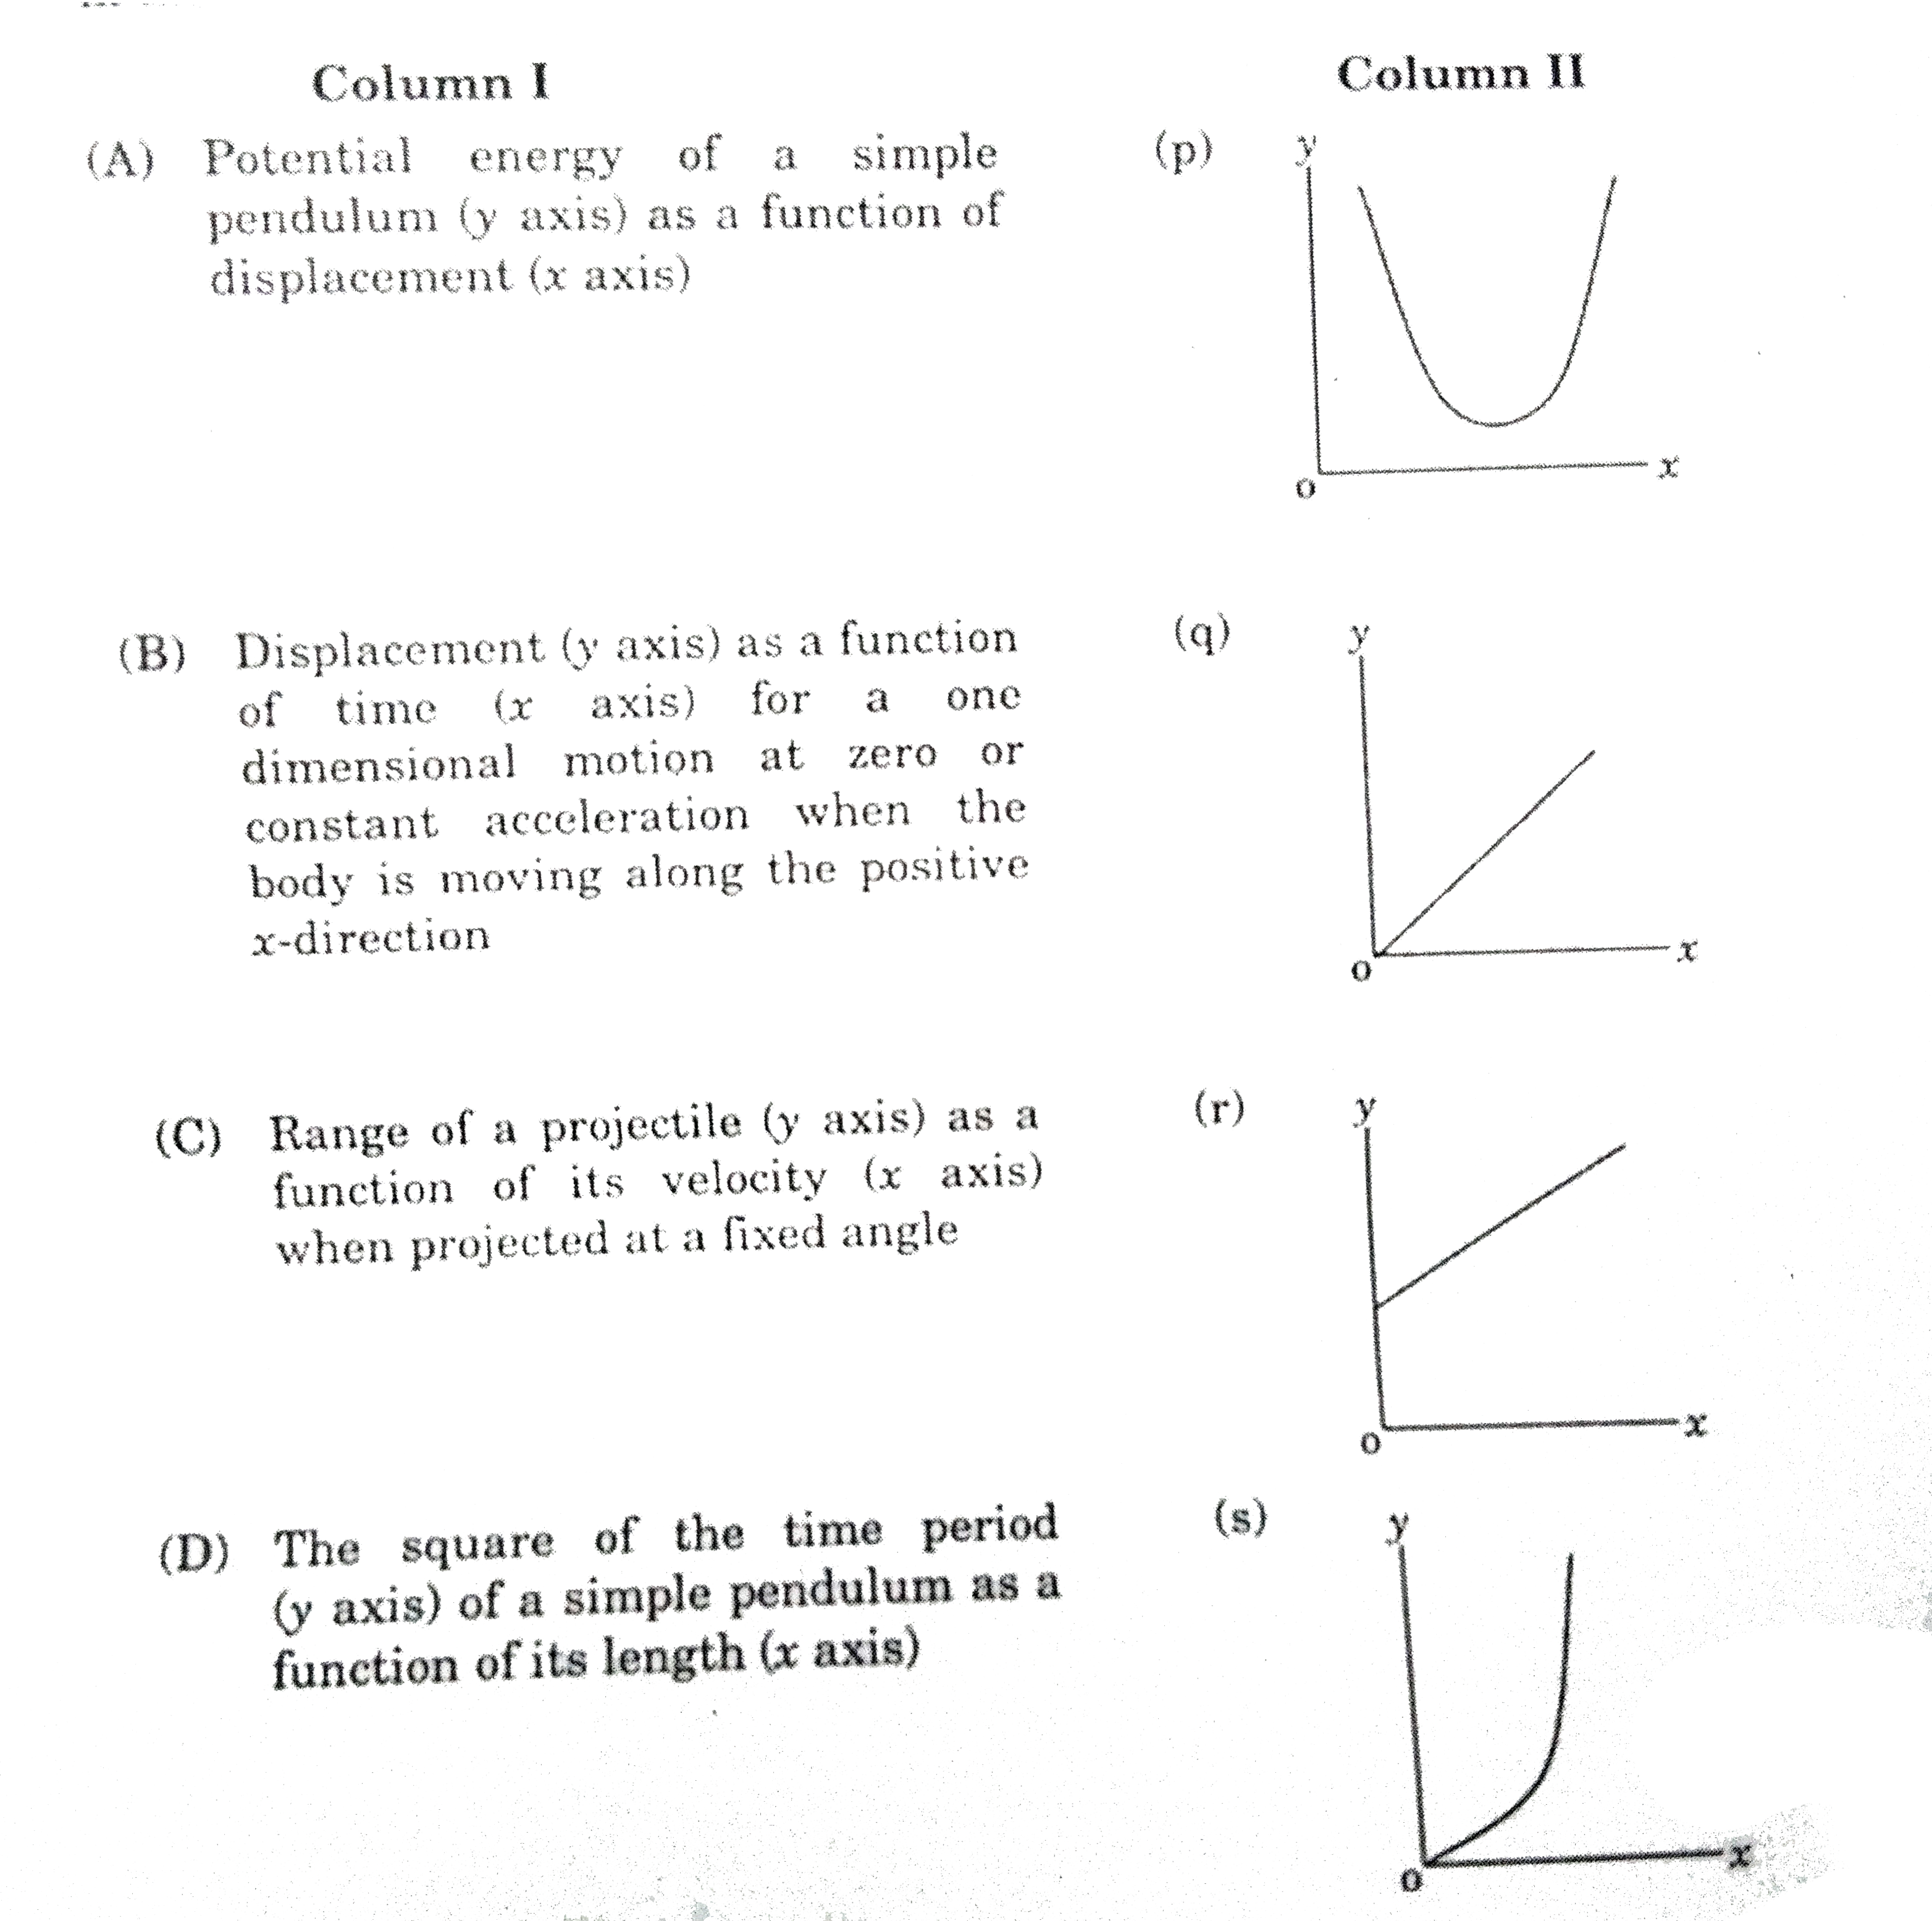
View SolutionColumn I gives a listof possible set of parameters measured in some experiments. The variations of the parameters in the form of graphs are shown in Column II. Match the set of parameters given in Column I with the graphs even in Column II. Indicate your answer by darkening the appropriate bubbles of the 4×4 matrix given in the ORS.

View SolutionColumn I gives a list of possible set of parameters measured in some expermients. The varitions of the parameters in the form of graphs ar shown in Column II. Match the set of parameters given Column I with the graph given in Column II. Indicate your answer by darking the appropriate bubbles of the 4×4 matrix given in the ORS.
_E01_169_Q01.png)
View SolutionMatch parameters involved in column-I with those in column-II.
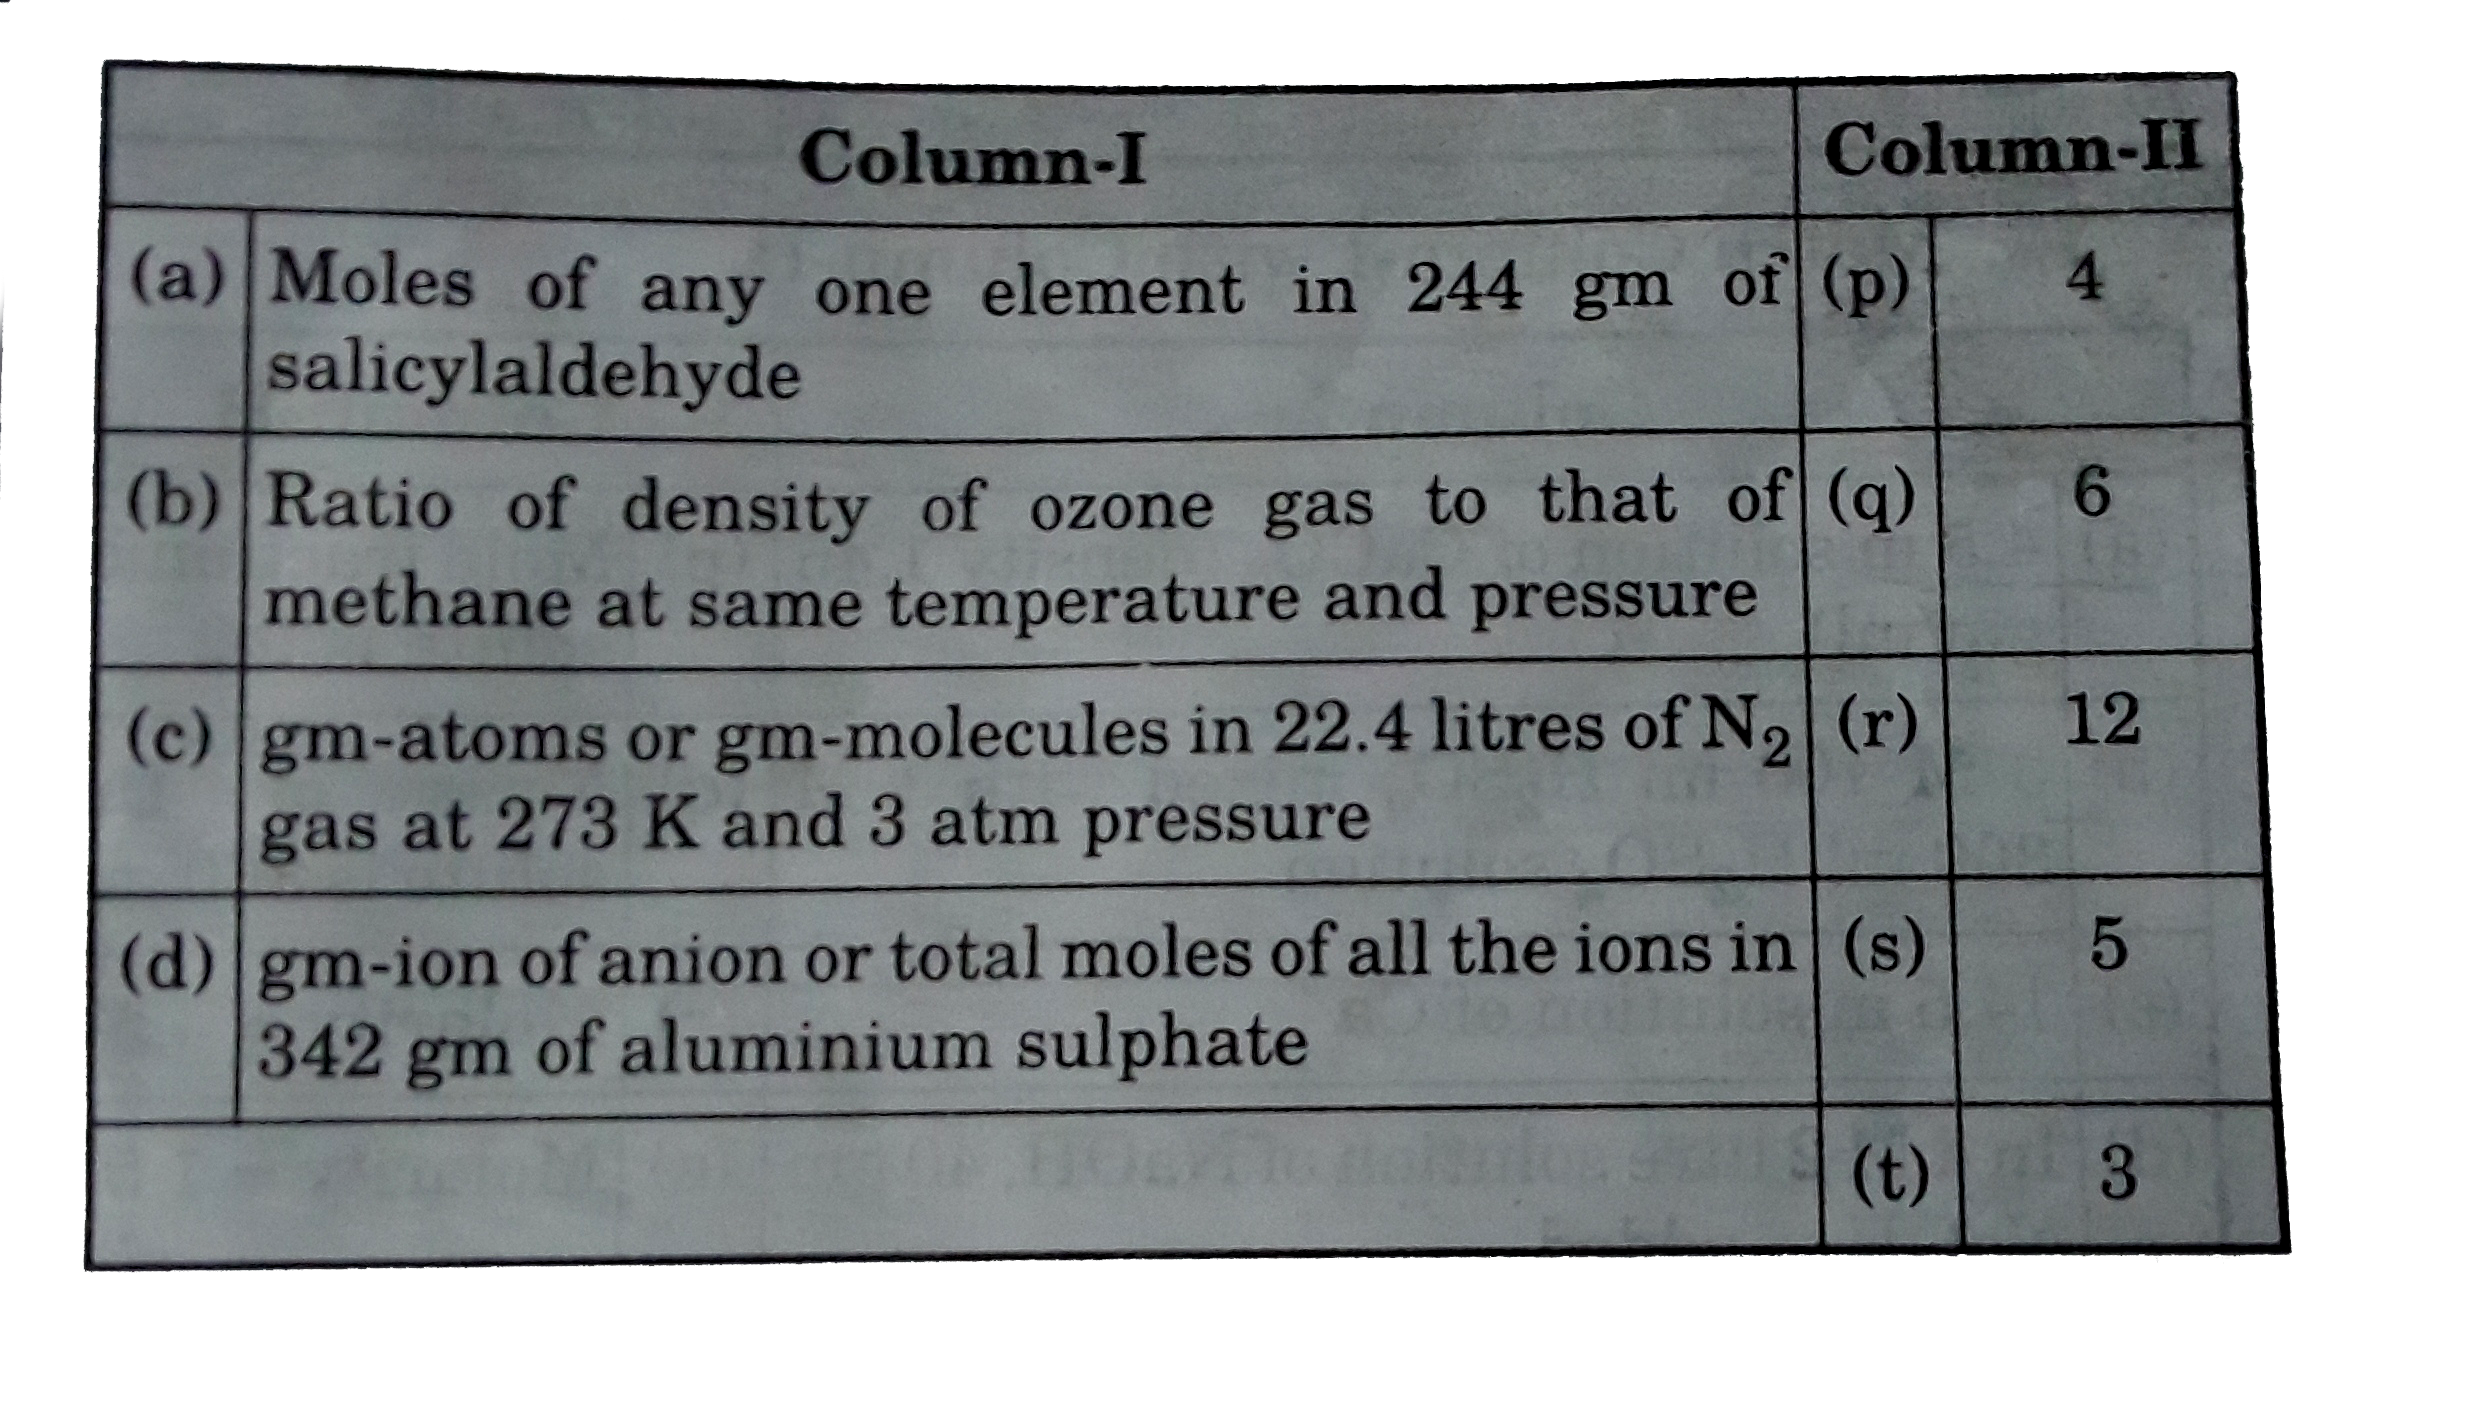
View SolutionIn the V-T graph shown in the figure match the following columns.
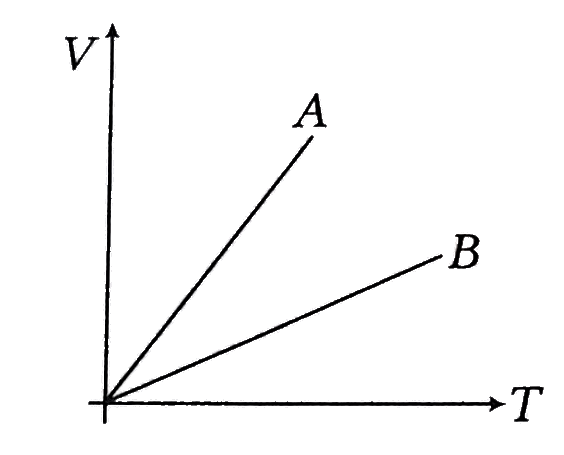

View SolutionIn the V-T graph shown in the figure match the following columns.


View SolutionColumn II gives certain systems undergoing a process. Column I suggests changes in some of the parameters realated to the system. Match the statement in Column I to be appropriate process(es) from column II.
_E01_337_Q01.png)
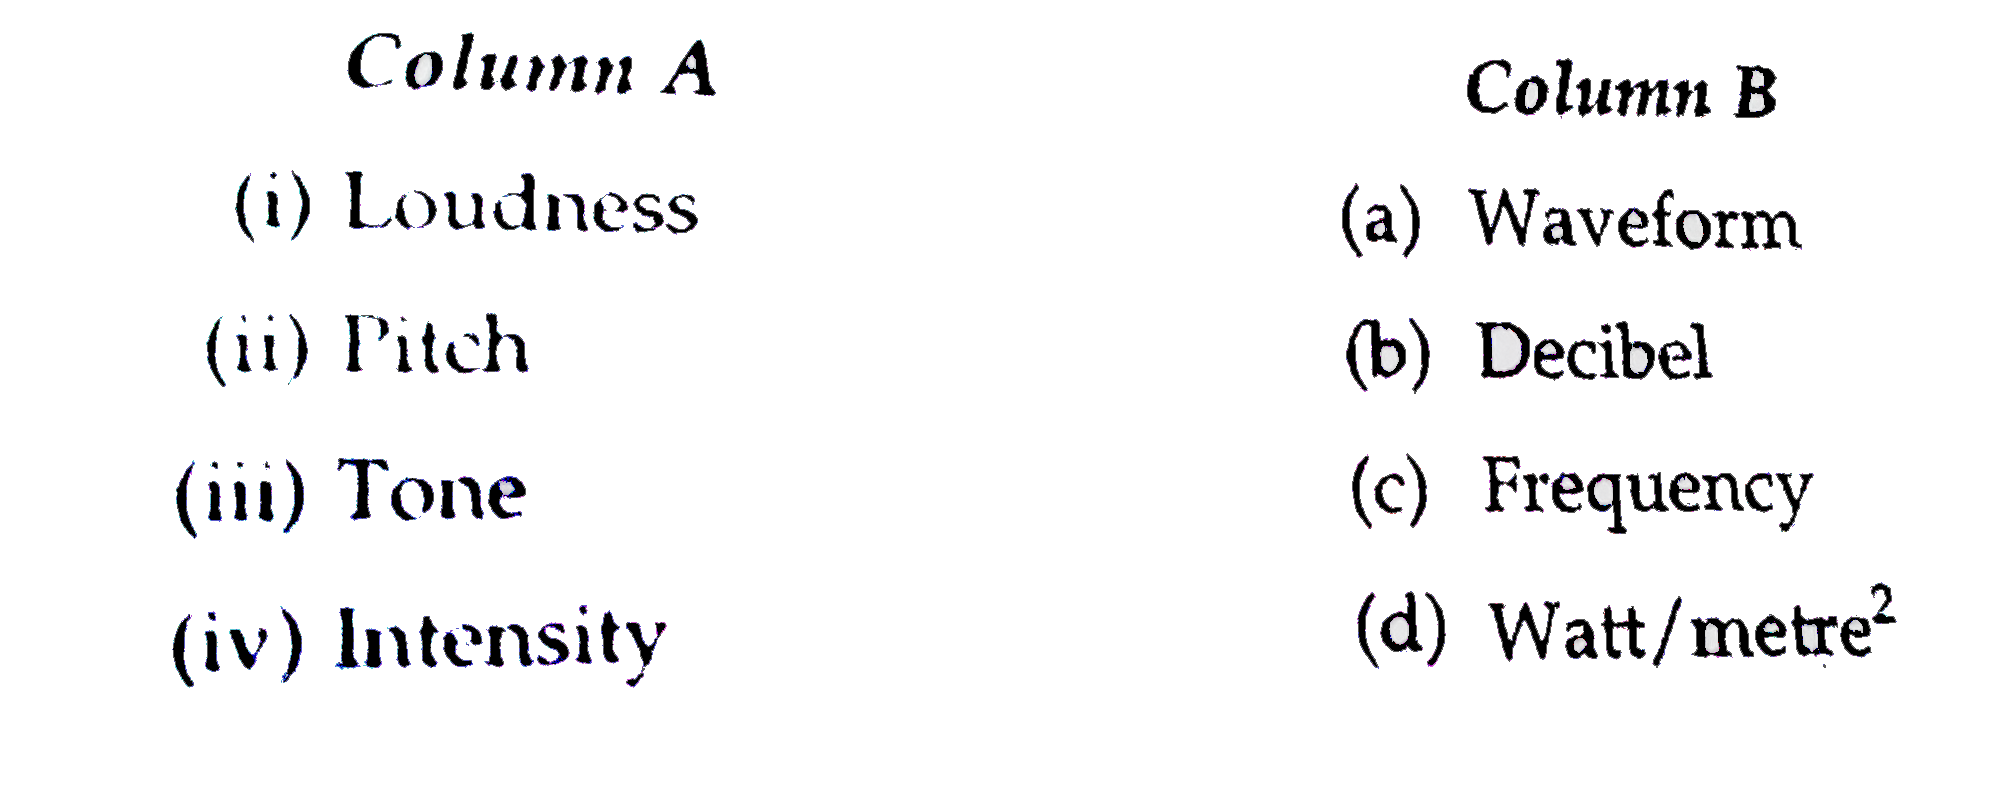
View SolutionWe identify and understand a sound on the basis of certain characteristics, given in column A. These characteristics depend on certain measurable parameters of the sound. These parameters and related units are given in column B.
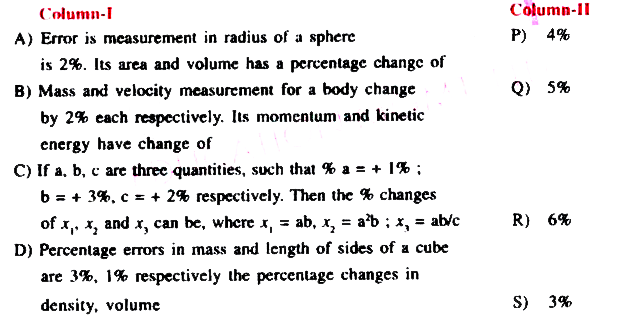
View SolutionIn column - I some physical situations are mentioned, in column - II corresponding variations of resultant quantities percentasge errors are mentioned. Match column - I entries appropriately with column - II entries
View Solution
