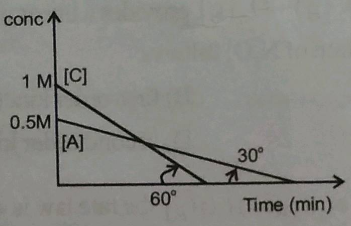
For the two reactions I:→BIII:→B,II:C→D following graph is obtained.

Which of the following is true:
If [B]=[A] then at than time [D]=0.75M
If [C]=[A] then at that time [B]>[D]
(t100%)ReactonI=(t100%)ReactionII
[A]=[C]att=√32min.
The correct Answer is:A
Topper's Solved these Questions
- BOOK - NARENDRA AWASTHICHAPTER - CHEMICAL KINETIC & NUCLEAR CHEMISTRYEXERCISE - Level 2 (Q.33 To Q.35)2videos
CHEMICAL KINETIC & NUCLEAR CHEMISTRY
- BOOK - NARENDRA AWASTHICHAPTER - CHEMICAL KINETIC & NUCLEAR CHEMISTRYEXERCISE - Level 3 - Passage1videos
CHEMICAL KINETIC & NUCLEAR CHEMISTRY
- BOOK - NARENDRA AWASTHICHAPTER - CHEMICAL KINETIC & NUCLEAR CHEMISTRYEXERCISE - Level 22videos
CHEMICAL KINETIC & NUCLEAR CHEMISTRY
- BOOK - NARENDRA AWASTHICHAPTER - SURFACE CHEMISTRYEXERCISE - Level 3 - Assertion - Reason Type Questions1videos
SURFACE CHEMISTRY
Similar Questions
Knowledge Check
- Question 1 - Select One
Which of the following is true about I and II?
AI is eclipsed, II is staggeredBII is eclipsed, I is staggeredCboth are eclipsedDboth are staggered - Question 2 - Select One
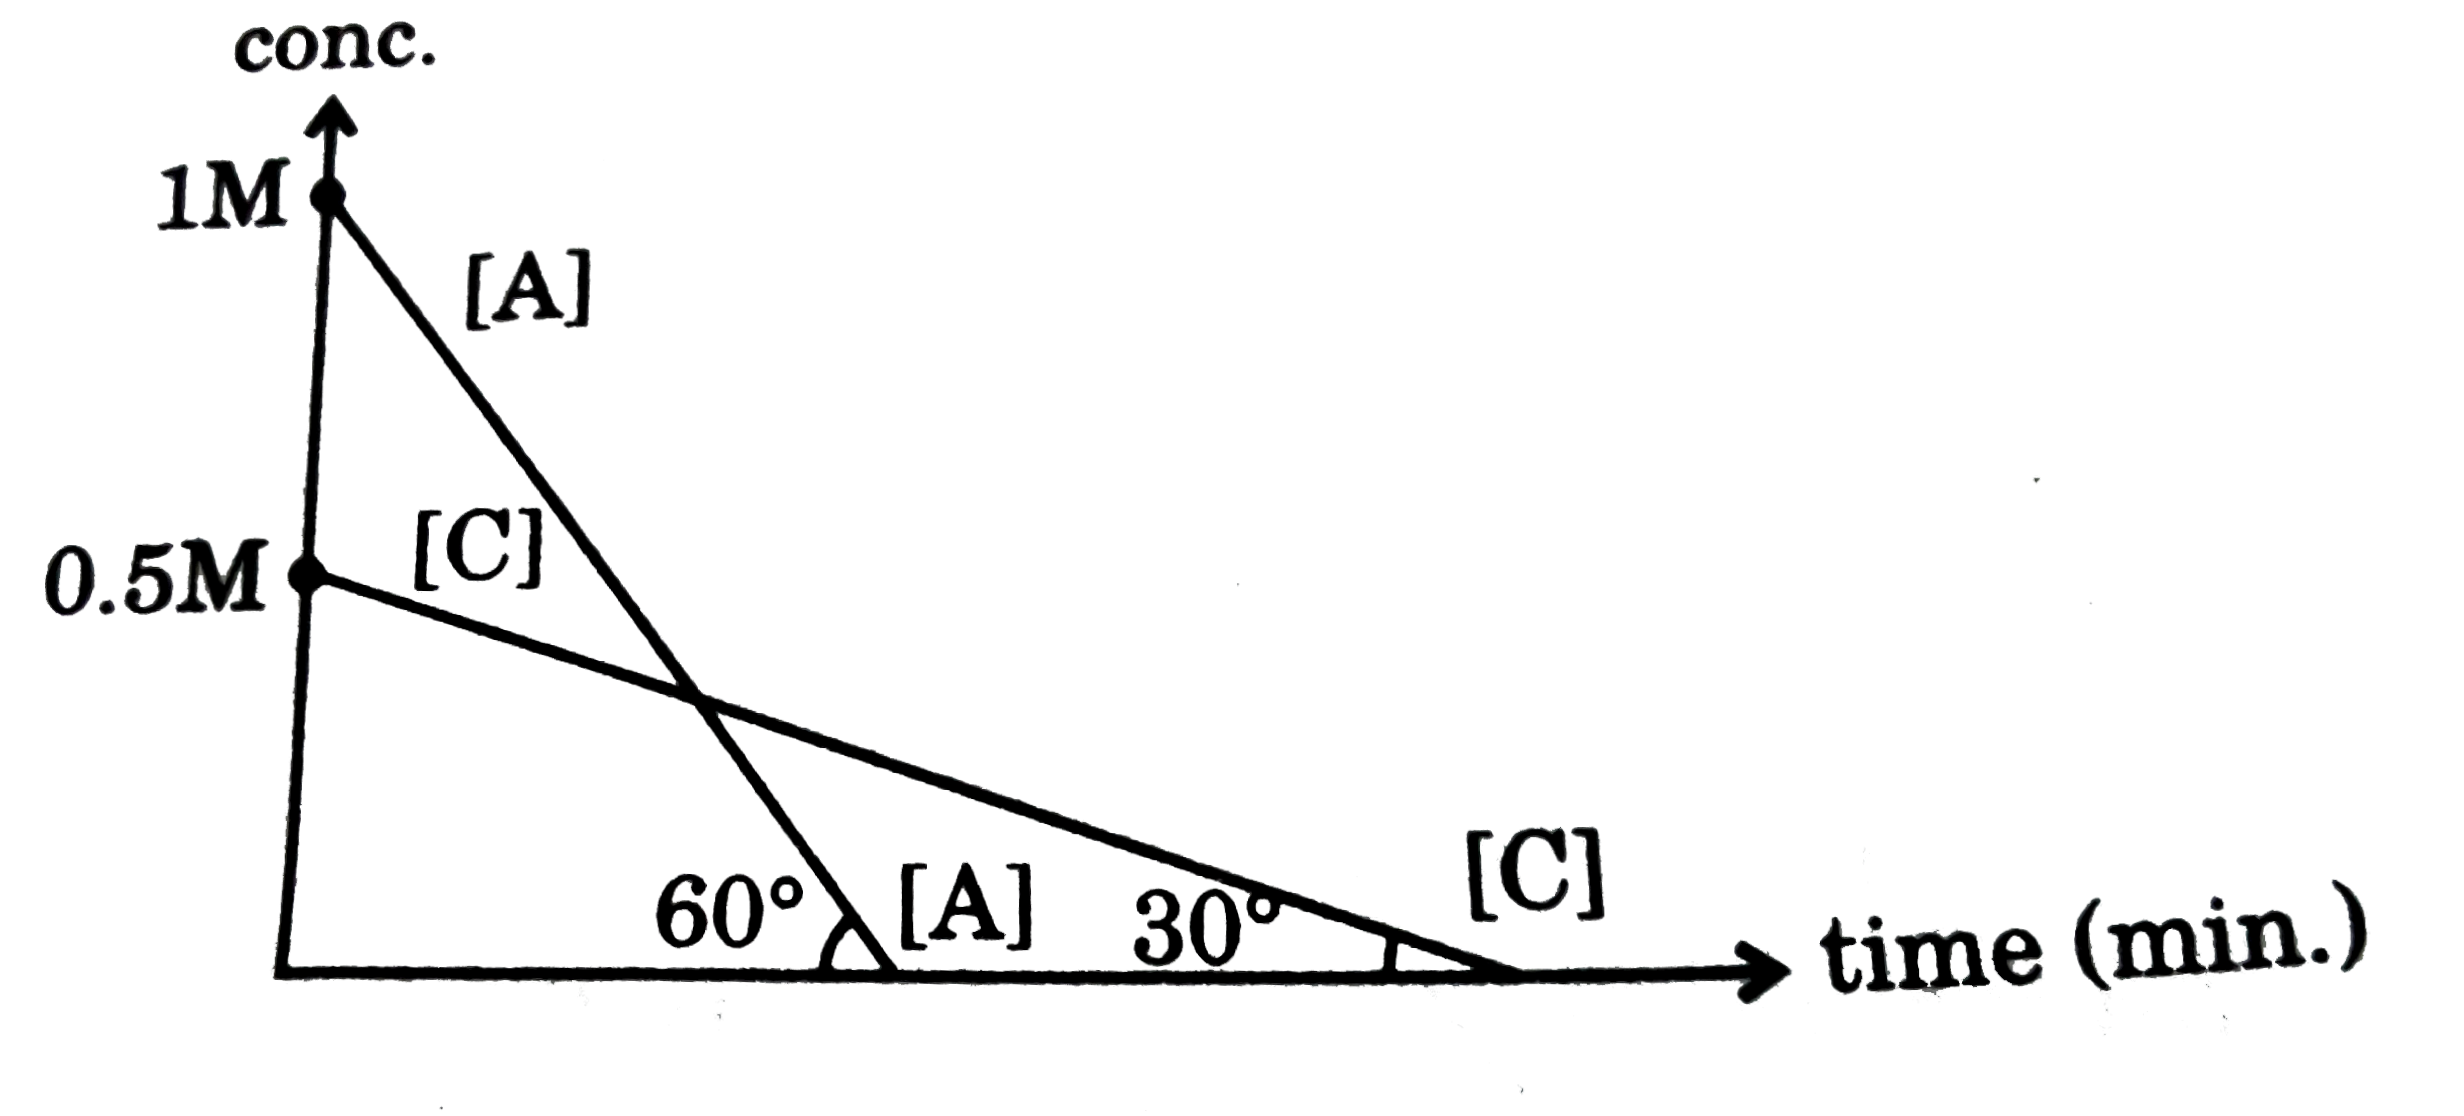
For the two reactions
Reaction I: A→B
Reaction II: C→D
following curves are plotted.
 Which of the following is incorrect options ? A(t100%)reaction I=23(t100%)reaction IIB[A]=[C] at t=√34 minutesCWhen [B]=[A] at the time [C]=[D]DIf both [A]0 and [C]0 are 1M then (t50%)I=13(t50%)II
 - Question 3 - Select One
Consider the following reactions :
Reaction I :

Reaction II :

Which of the following is a correct comparison of rate of reaction?ArI>rIIBr1<rIICrI=rIIDReactions are not possible.
Complete the following reactions :
i.
ii. View Solution
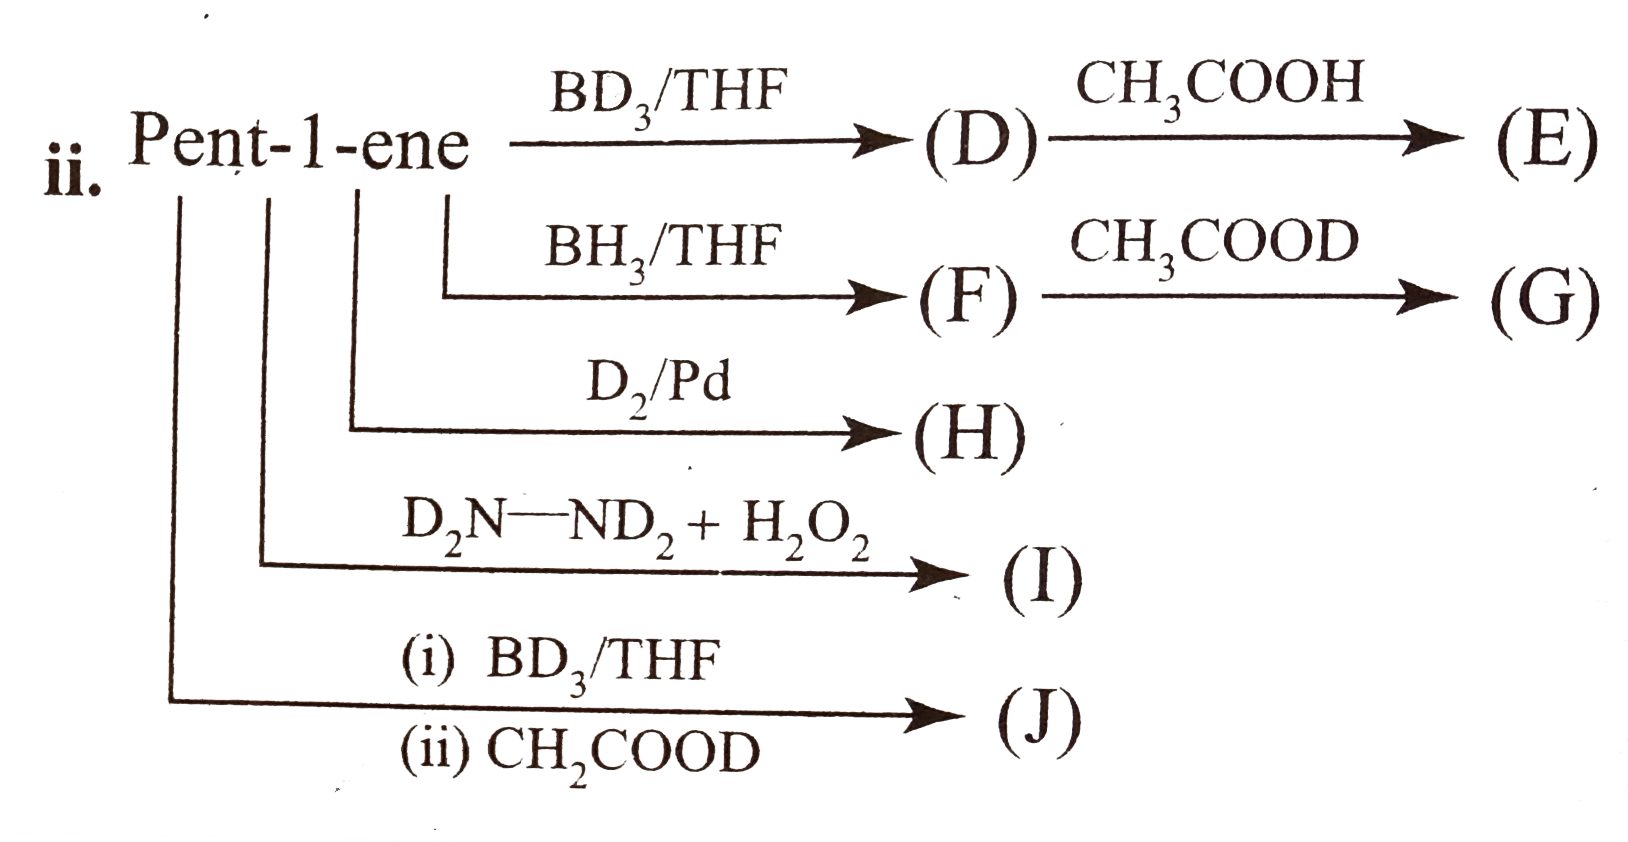
Complete the following reactions :
i.
ii. View Solution
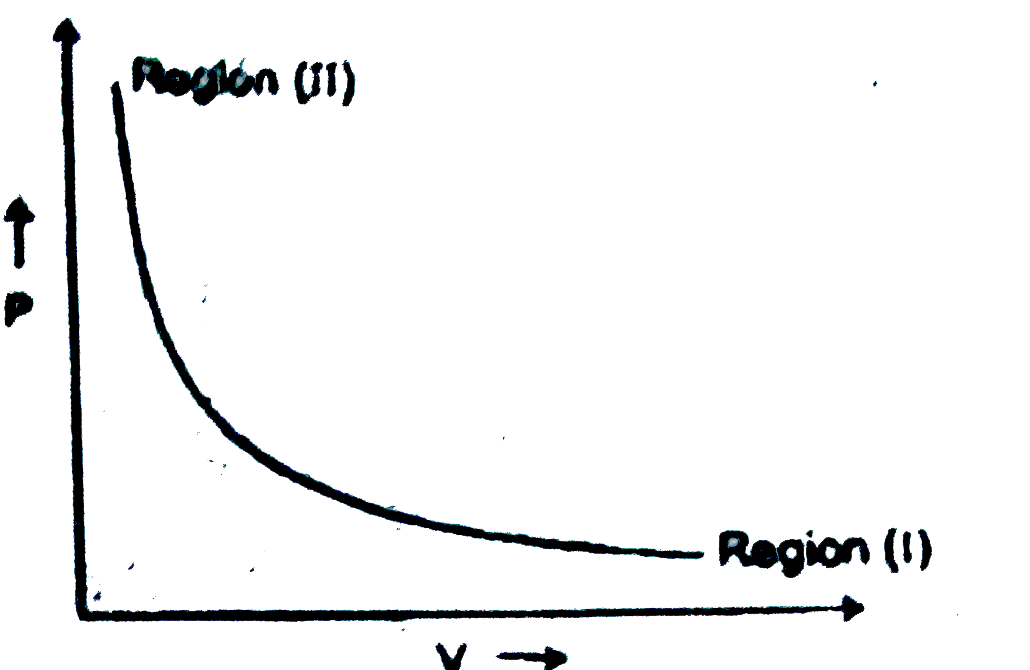
Following graph represents a pressure (P) volume (V) relationship at a fixed temperature (T) for n moles of a real gas. The graph has two regions marked (I) and (II). Which of the following options is true.
 View Solution
Following graph represents a pressure (P) volume (V) relationship at a fixed temperature (T) for n moles of a real gas. The graph has two regions marked (I) and (II). Which of the following options is true.
View SolutionFollowing graph represents a pressure (P) volume (V) relationship at a fixed temperature (T) for n moles of a real gas. The graph has two regions marked (I) and (II). Which of the following options is true.
 View Solution


