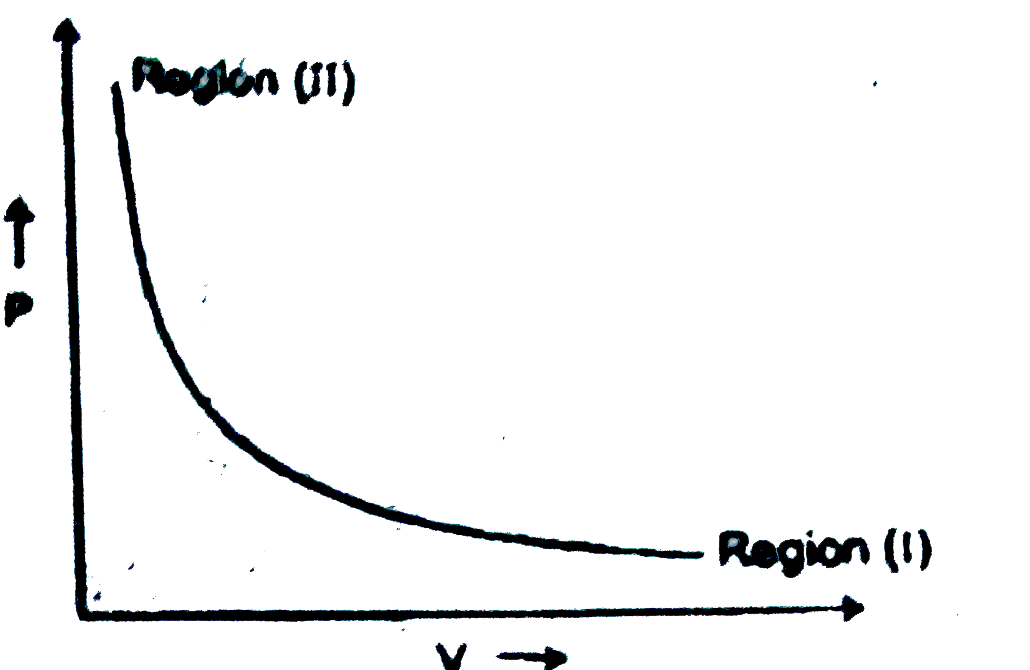
Following graph represents a pressure (P) volume (V) relationship at a fixed temperature (T) for n moles of a real gas. The graph has two regions marked (I) and (II). Which of the following options is true.
A
Z>1 in the region (II).
B
Z=1 in the region (II)
C
Z=1 for the curve
D
Z approaches 1 as we move from region (II) to region (I)
Video Solution
Text Solution
The correct Answer is:4
On moving from region (II) to region (I), pressure tends to zero. So, Z→1.
|
Updated on:21/07/2023
Topper's Solved these Questions
Similar Questions
Knowledge Check
- Question 1 - Select One
One of the important approach of the study of real gases involves the analysis of a parameter Z called the compressibility factor Z=PVmRT where P is pressure, Vm is molar volume ,T is absolute temperature and R is the universal gas constant .Such a relation can also be expressed as Z=(V m realVm ideal) (where Vm ideal and V_("m real") are the moler volume for ideal and real gas respectively tendencies among constituent particles.As pressure is force among is lowered or temperature is increased the value of Z approaches ideal behaviour
Following graph represents a pressure (P) volume (V) relationship at a fixed temperature (T) for moles of a real gas.The graph has two regions masked (I) and (II). Which of the folloing option true ?
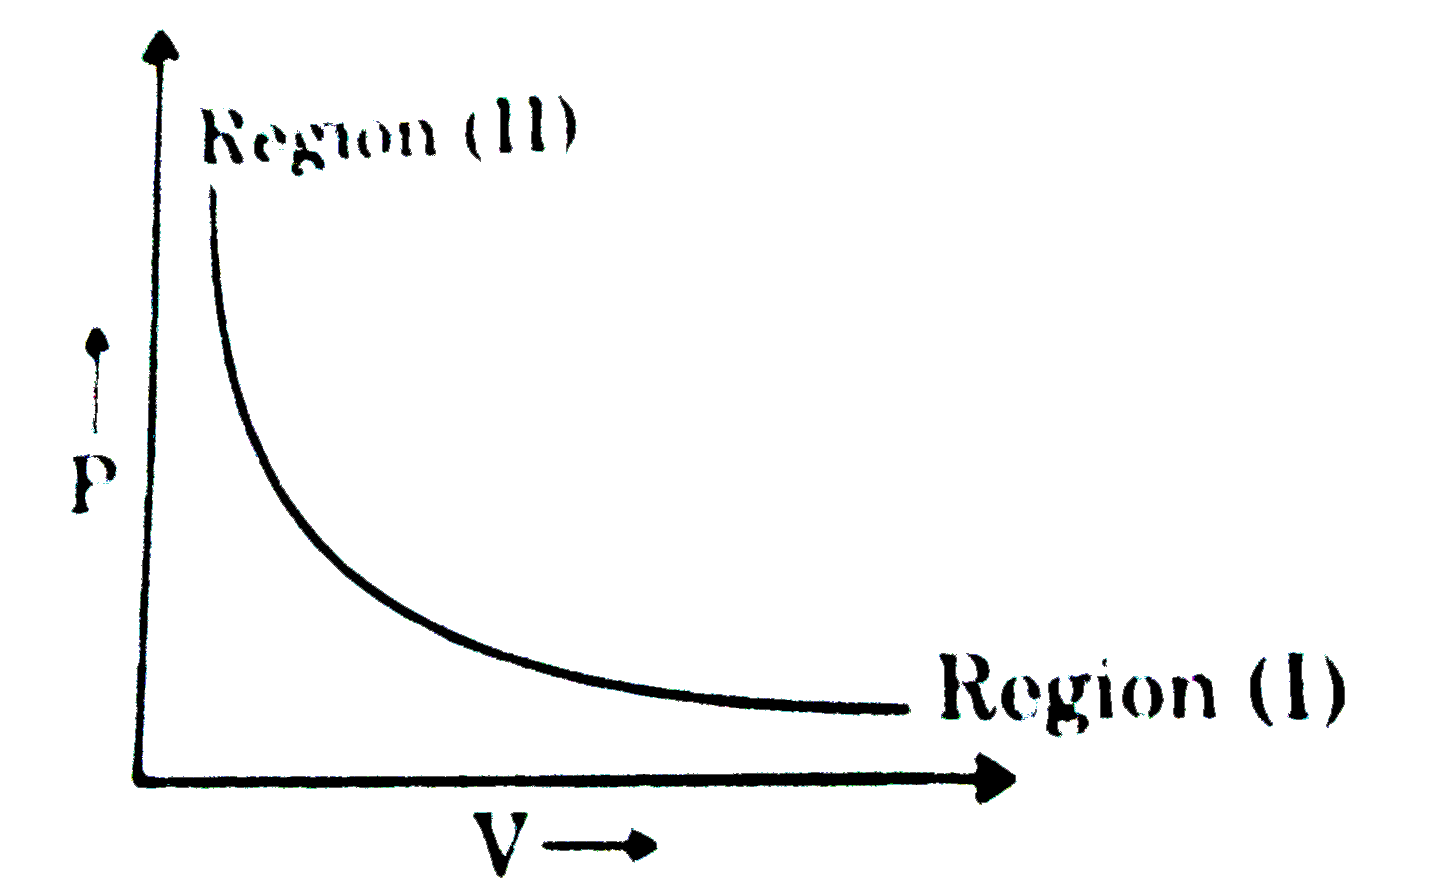 AZ<1 in the region (II)BZ = 1 in the region (II)CZ = 1 for the curveDZ approaches 1 as we move from region (II) region(I)
 - Question 2 - Select One
For 1 mole of an ideal gas, a graph of pressure vs volume is plotted as shown. Which of the following options is correct ?
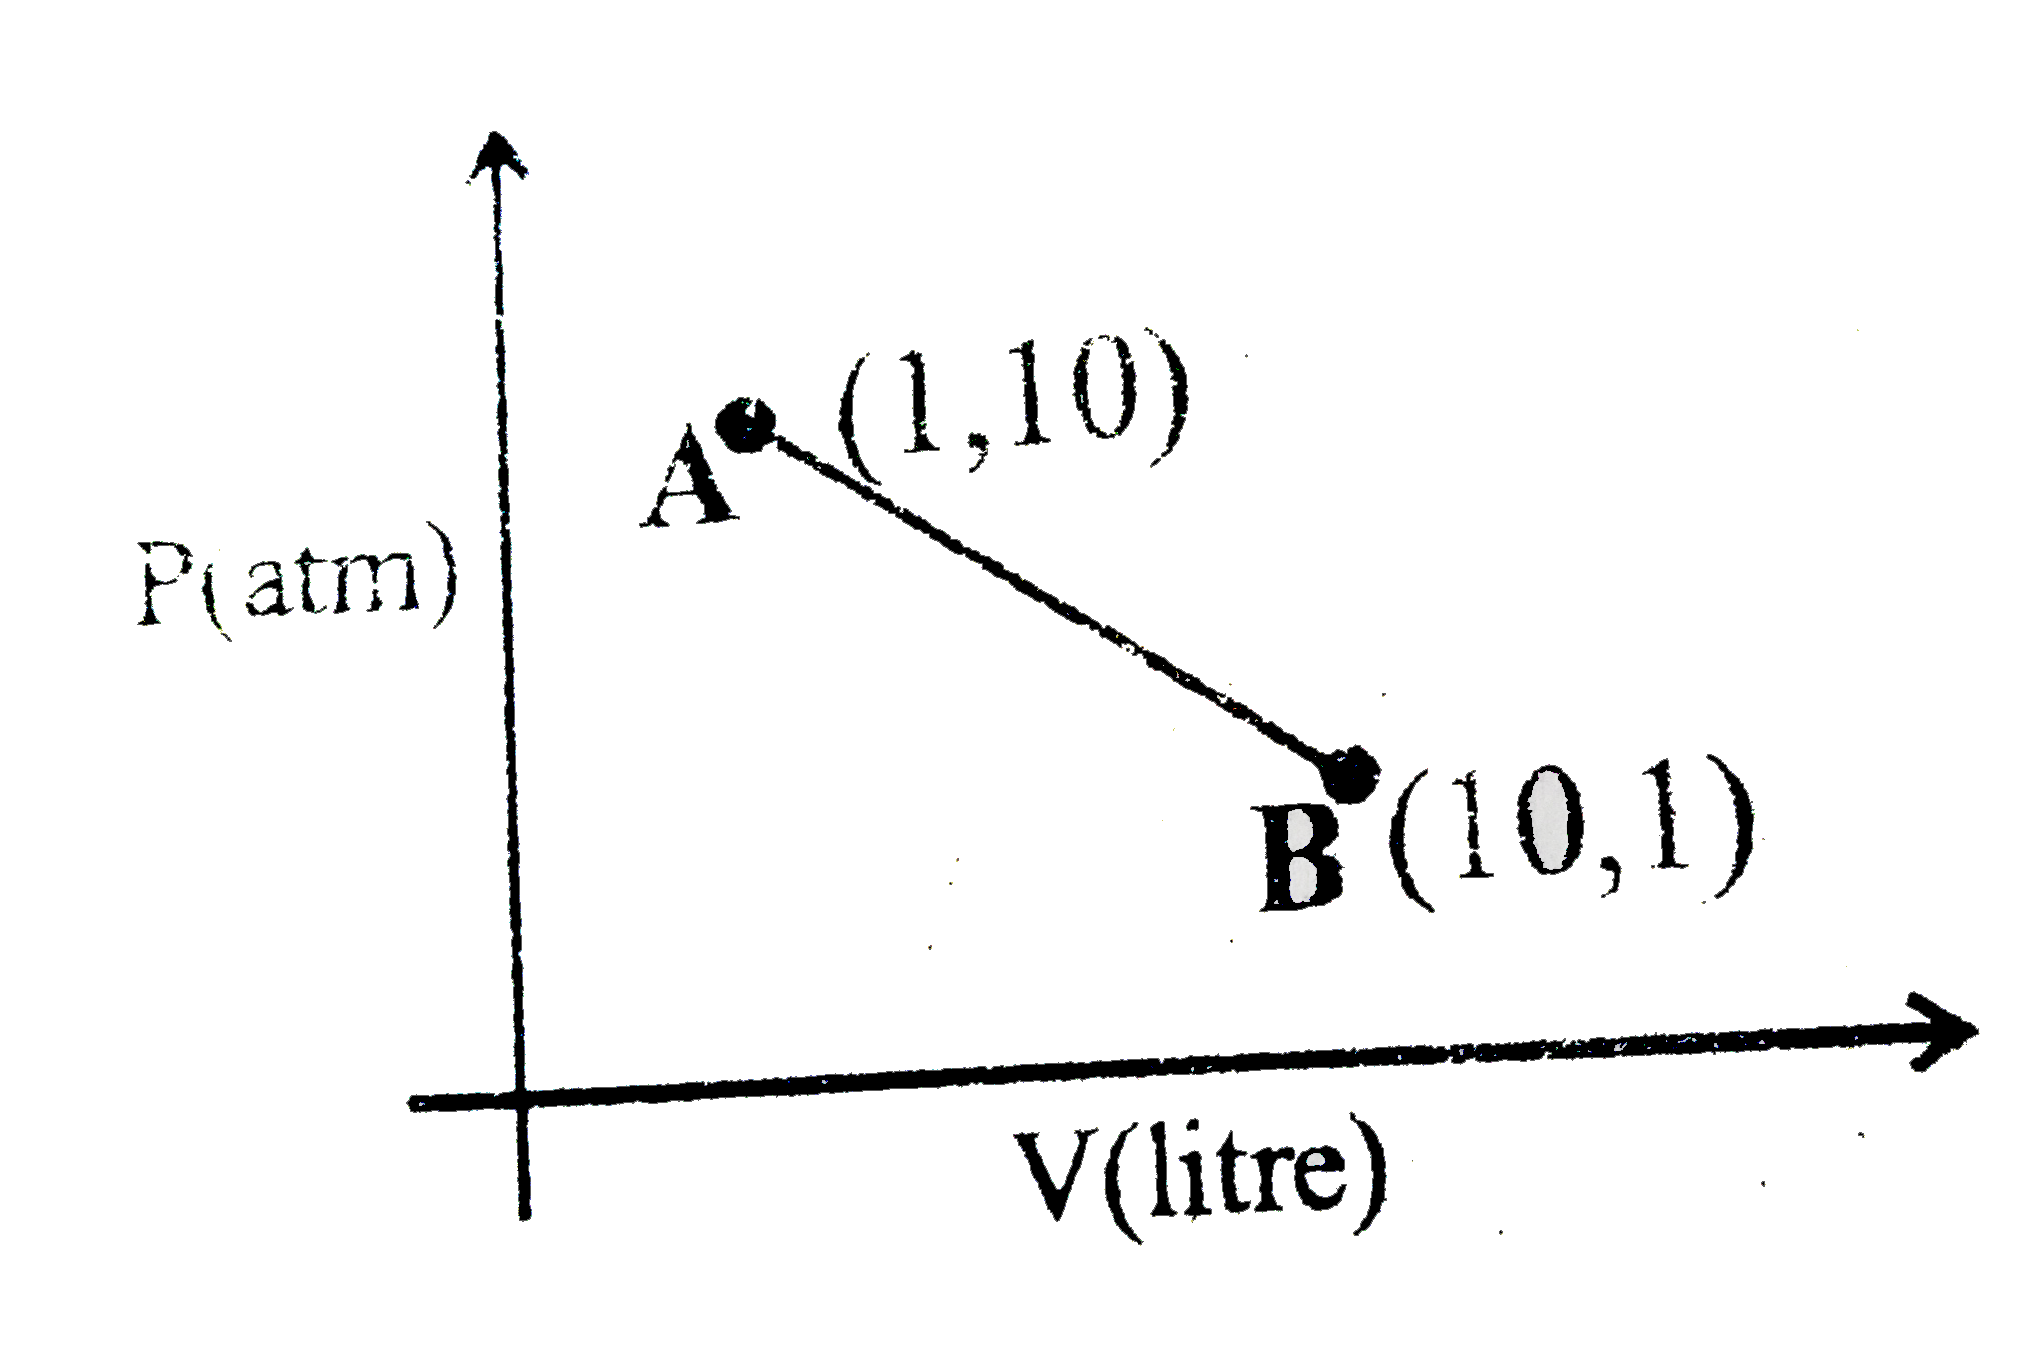 AAB process is isothermalBMaximum temperature of the gas can be 100.0821KCMinimum temperature of the gas can be 114×0.0821KDNone of these
 - Question 3 - Select One
For 1 mole of an ideal gas, a graph of pressure vs volume is plotted as shown. Which of the following option is correct ?
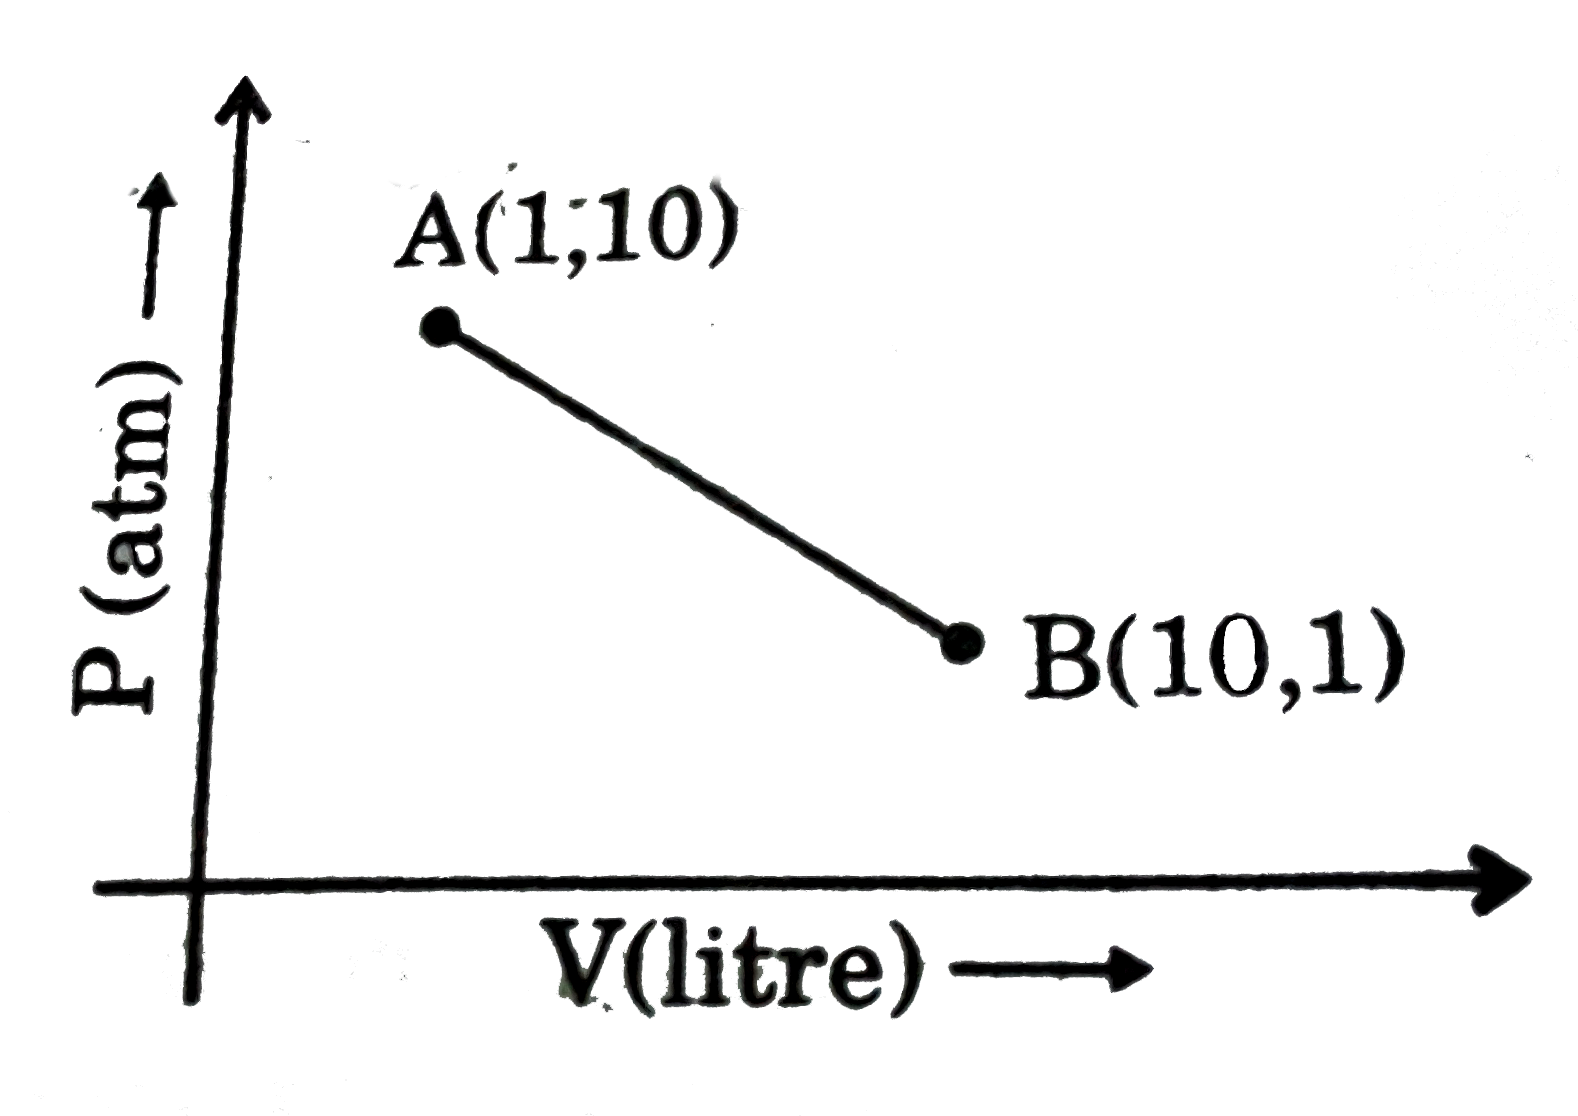 AAB process is isothermal.BMaximum temperature of the gas can be 100.0821K.CMinimum temperature of the gas can be 114×0.0821K.DNone of the above
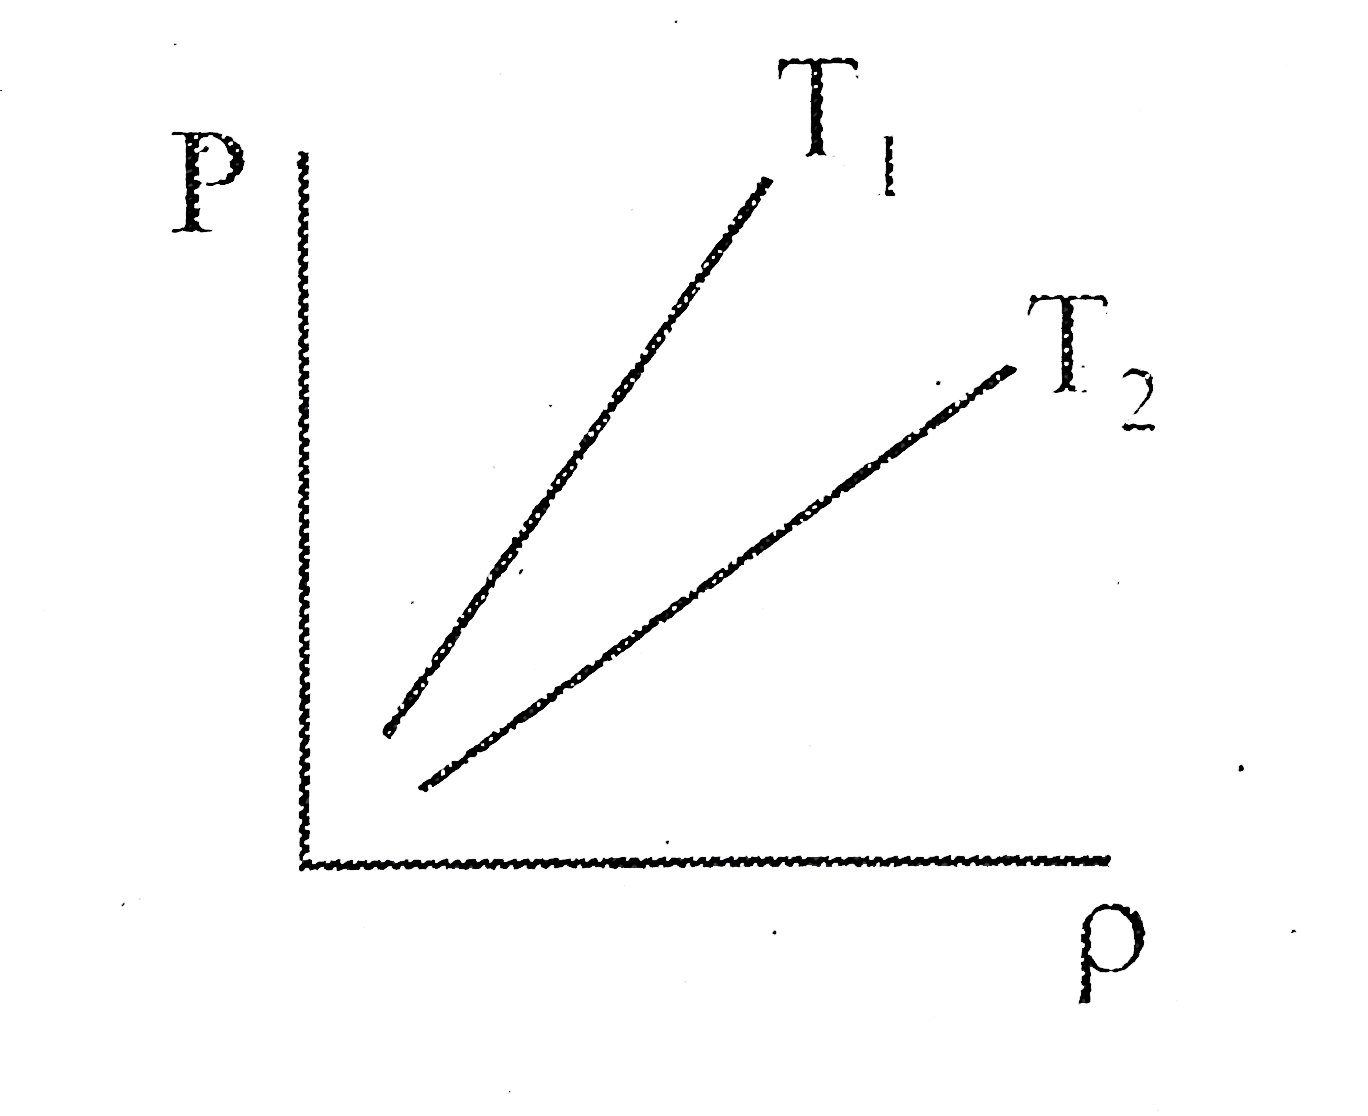
Figure shows graphs of pressure vs density for an ideal gas at two temperature T1 and T2 . Which of the following is correct ?
 View Solution
which of the following graph represents the variation of resistivity (ρ) with temperature (T) for copper?
View SolutionAn ideal gas has pressure P, volume V and temperature T. Select the correct option.
View Solutionwhich of the following graph represents the variation of resistivity (ρ) with temperature (T) for copper?
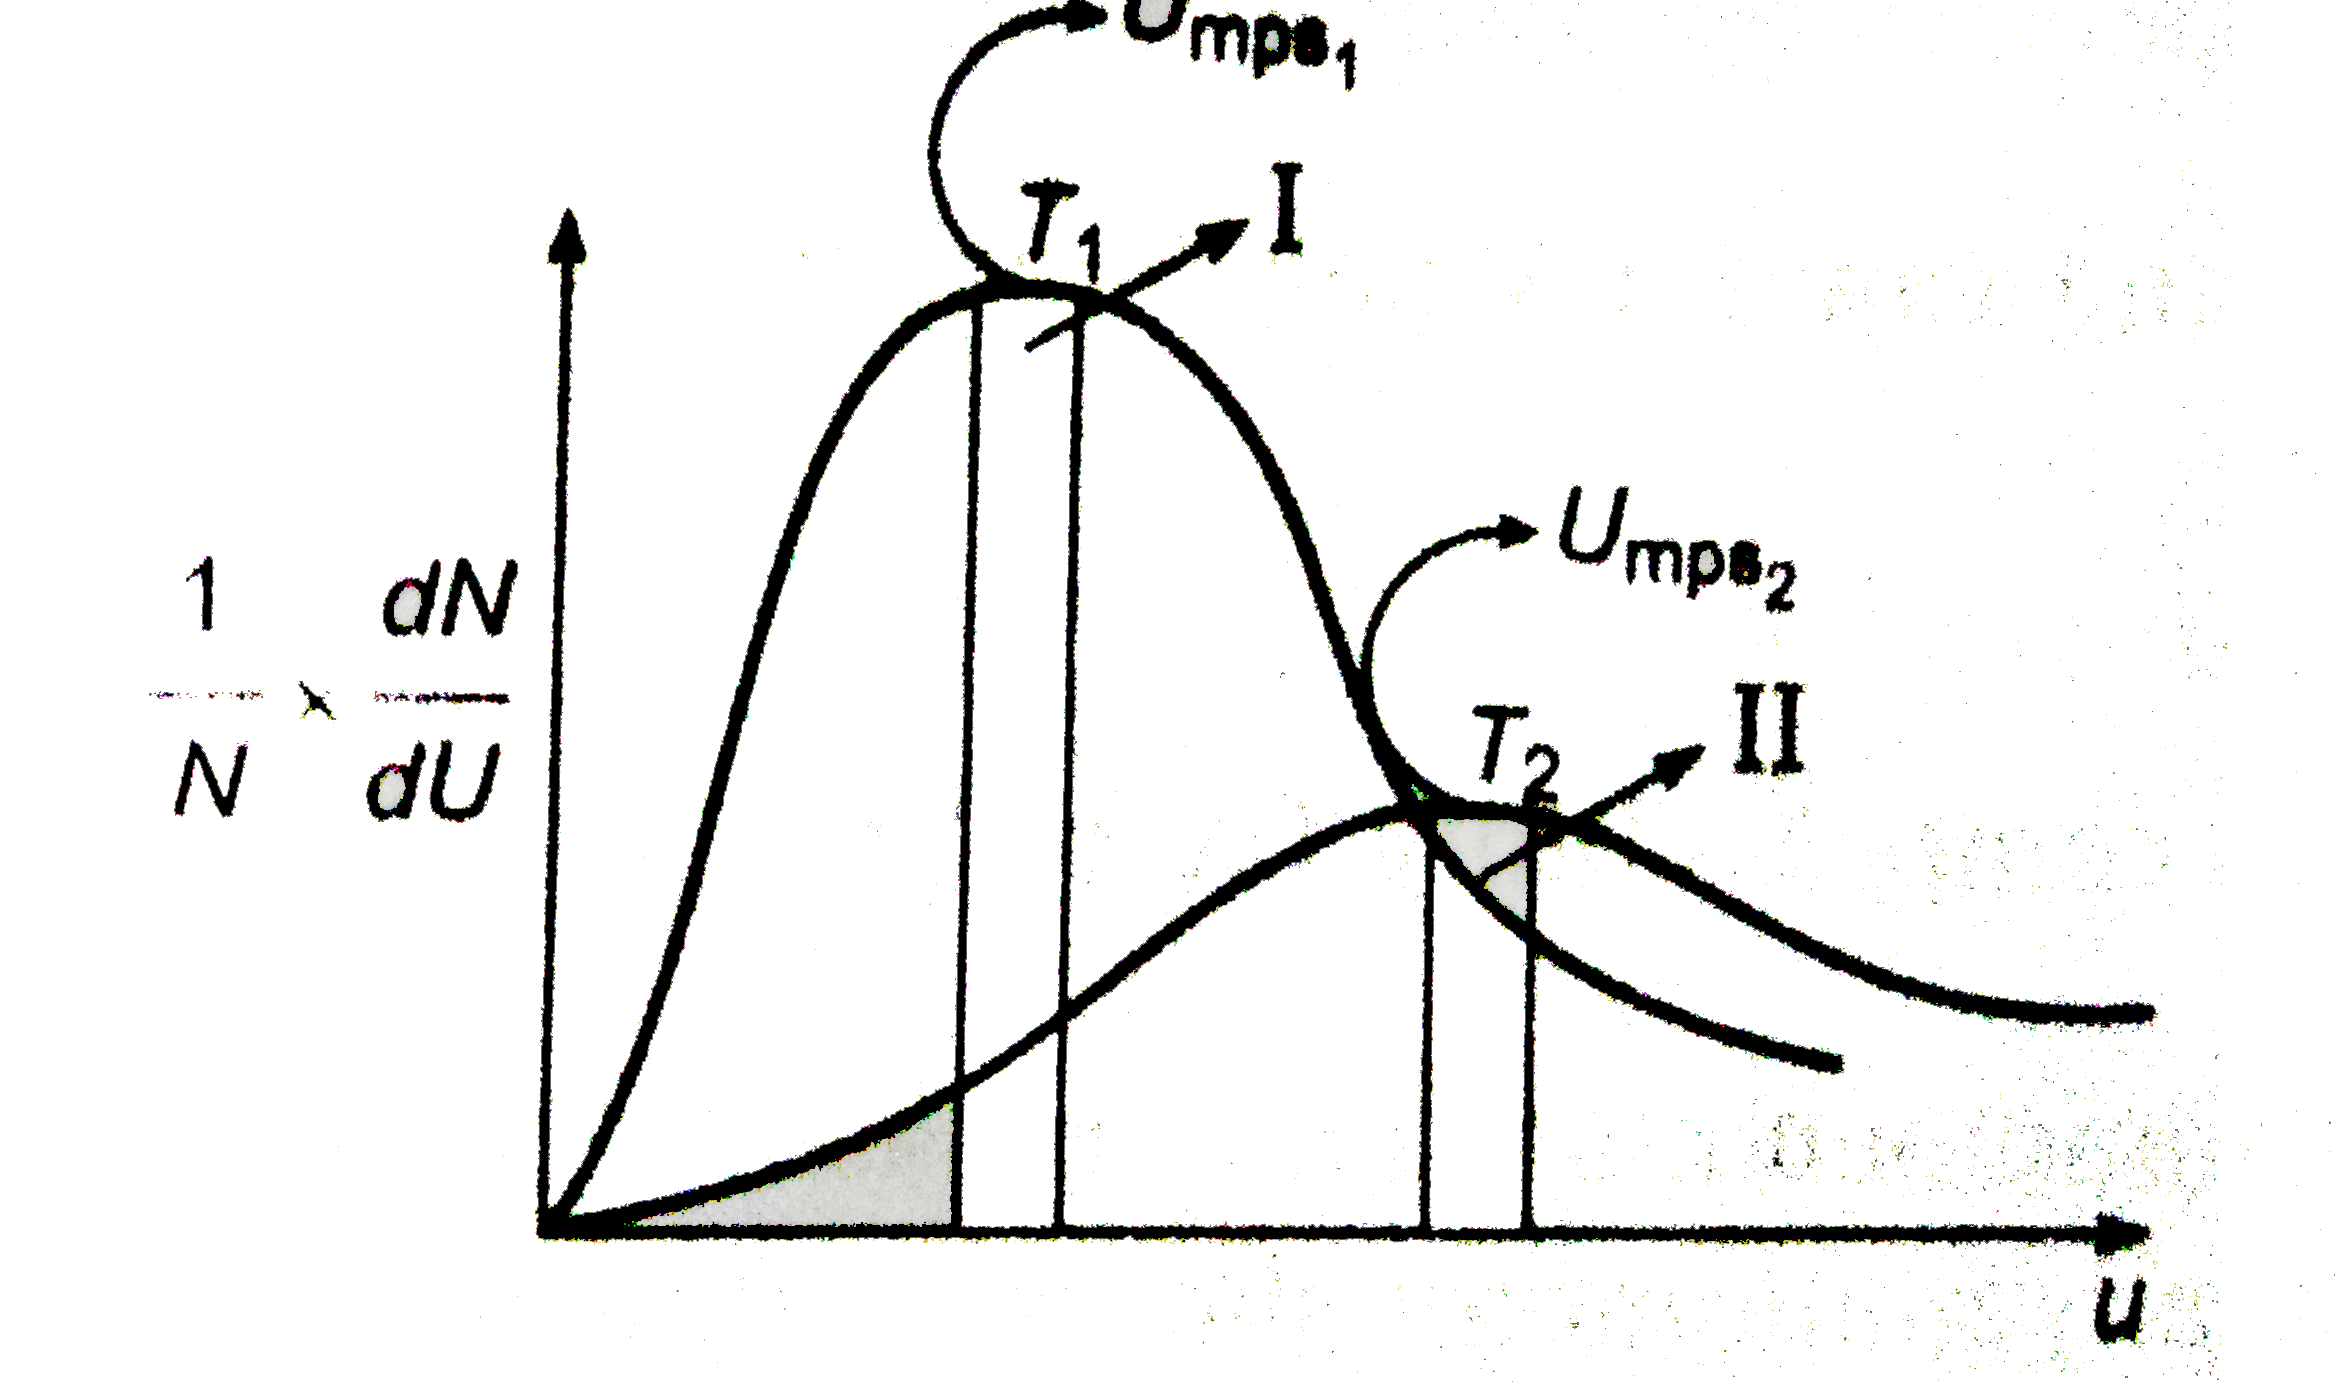
View SolutionFollowing represents the Maxwell distribution curve for an ideal gas at two temperature T1 and T2 . Which of the following option(s) is/are true?
 View Solution

