A plot of velocity versus time for a body in rectilinear motion is as shown in the figure.indicate whether acceleration is positive, negative , zero , variable or constant in the region OA, AB, BC and CD.Calculate the distance described up to the point C.What is the displacement up to point C ?
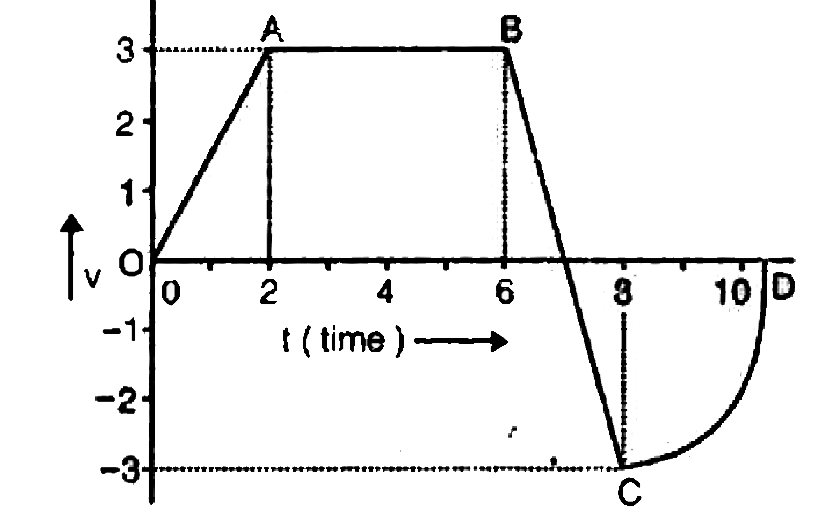
The correct Answer is:In the region OA, acceleration is +ve and constant , in AB it is zero, in BC it is -ve and constant, and in CD it is again +ve but variable.Distance =18 m and displacement =15 m
Step by step video, text & image solution for A plot of velocity versus time for a body in rectilinear motion is as shown in the figure.indicate whether acceleration is positive, negative , zero , variable or constant in the region OA, AB, BC and CD.Calculate the distance described up to the point C.What is the displacement up to point C ? by Physics experts to help you in doubts & scoring excellent marks in Class 11 exams.
Updated on:21/07/2023Topper's Solved these Questions
Similar Questions
If the same plot is of displacement (x) versus time (t), indicate whether the body is at rest or in motion and whether it has uniform velocity or variable velocity in the rigions OA, AB, BC and CD.Find the distance described in 8 s.What is the displacement of the body in 8 s ?
View Solutiondisplacement versus time curve for a particle executing SHM is is as shown in figure.
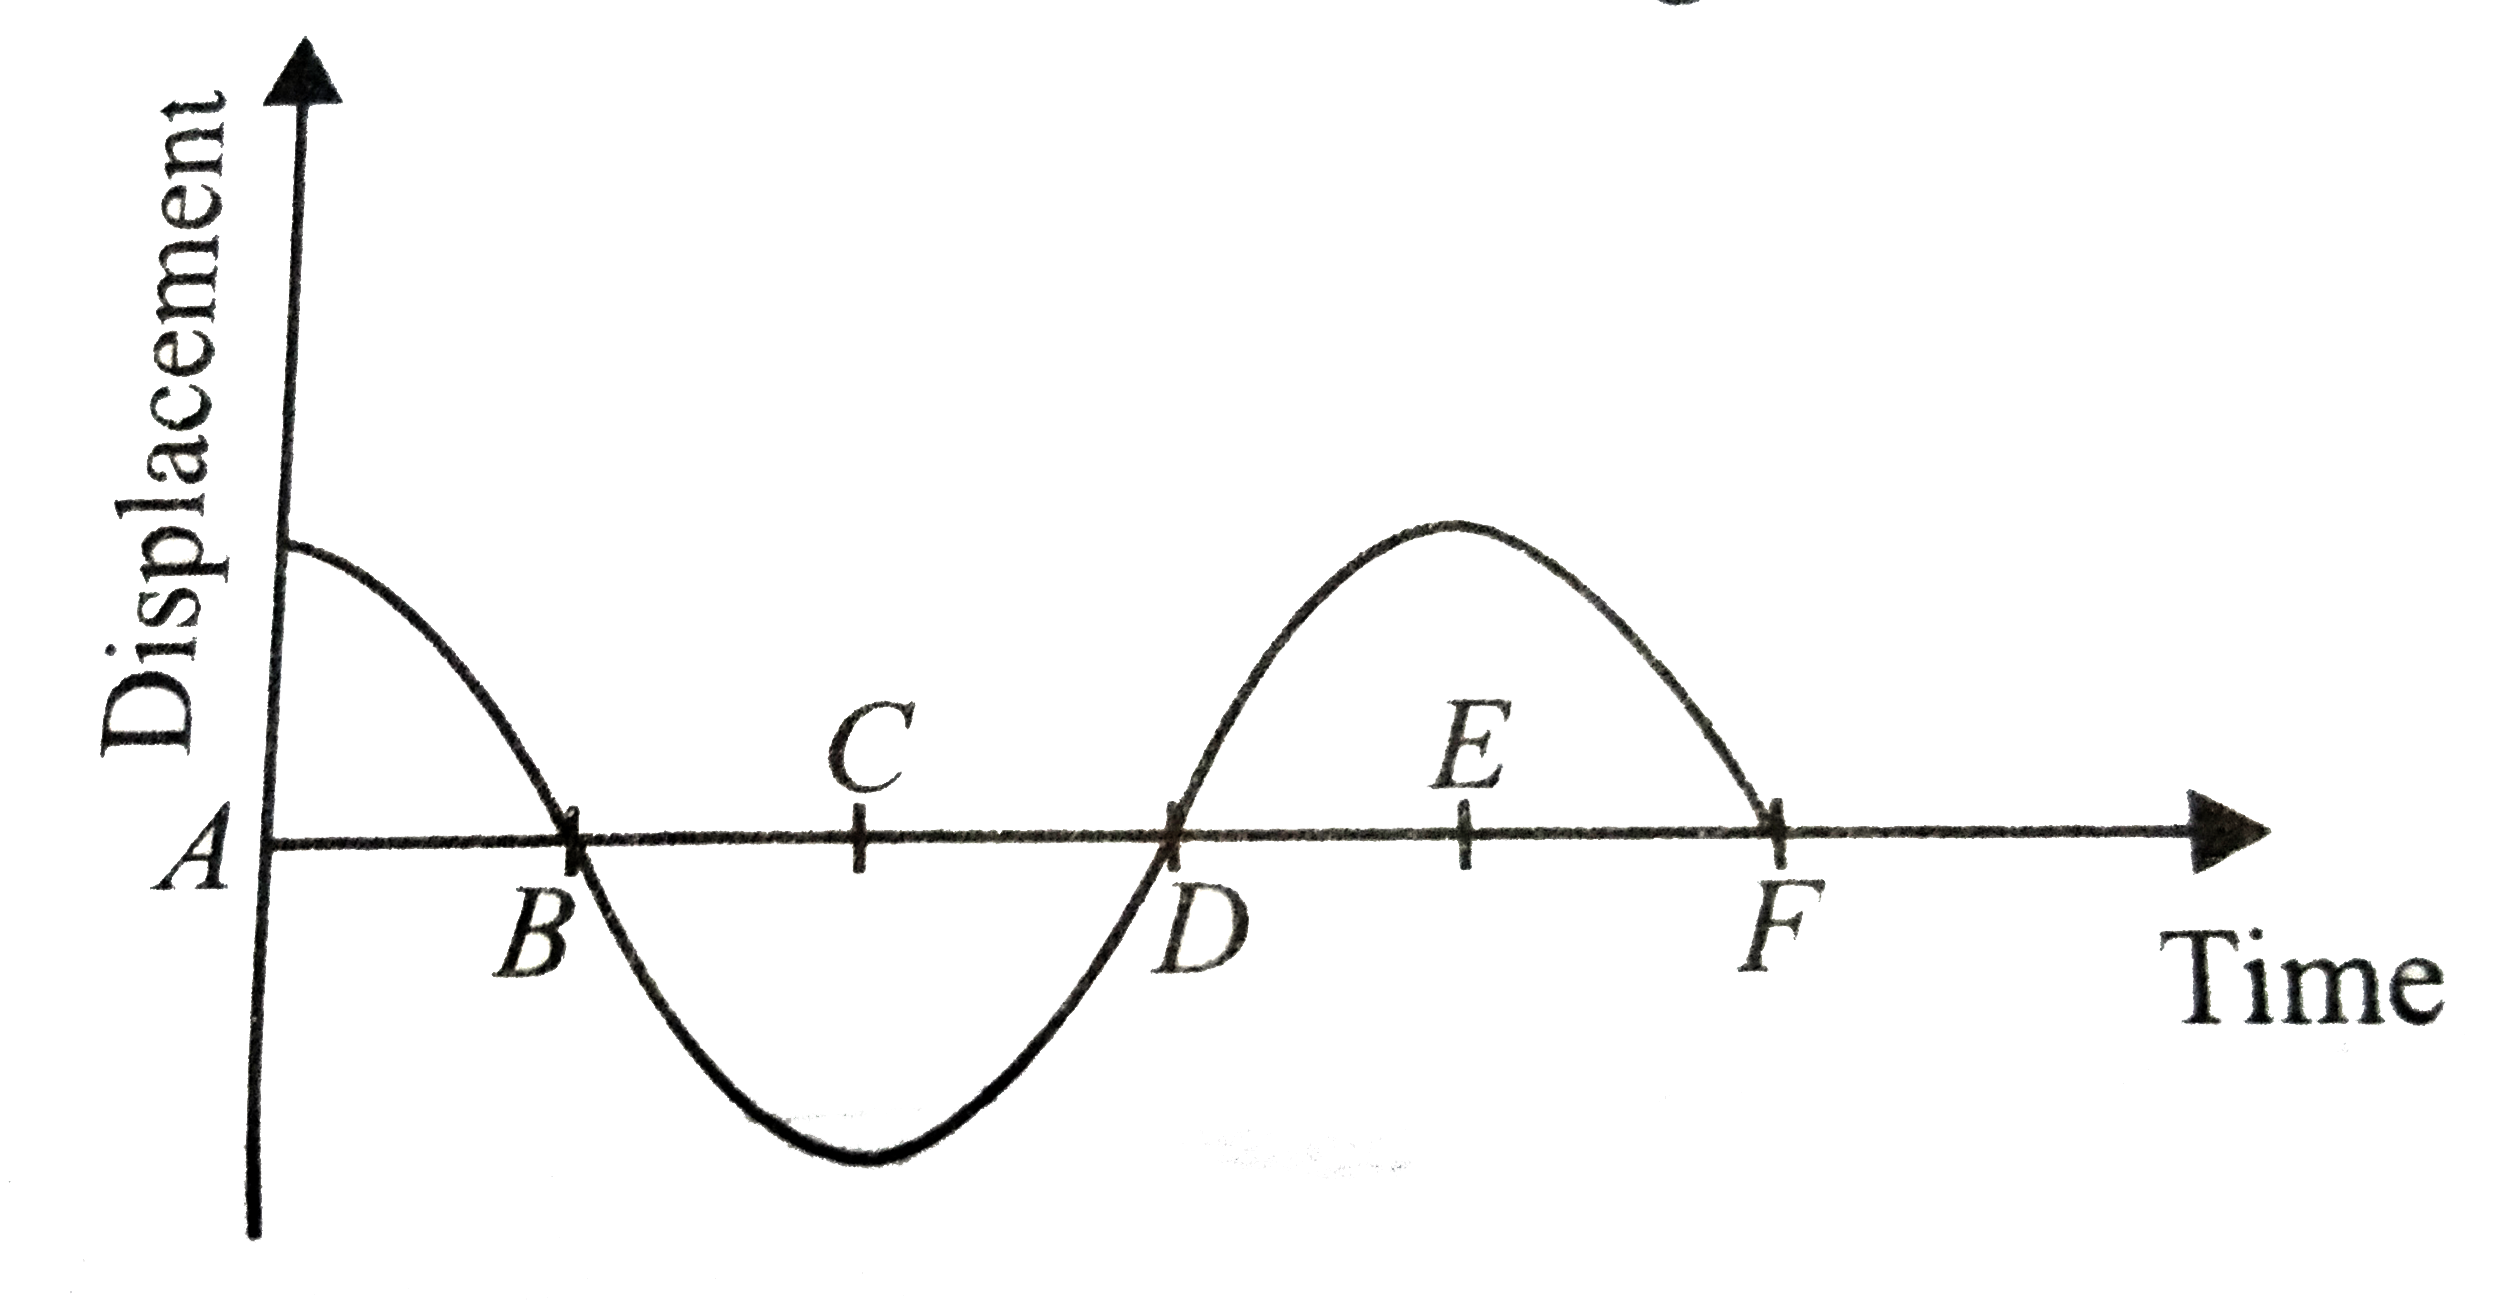
At what points the velocity of the particle is zero?
View Solution
Knowledge Check
The graph between the displacement x and time t for a particle moving in a straight line is shown in the figure. During the interval OA,AB,BC and CD the acceleration of the particle is
OA,AB,BC,CD
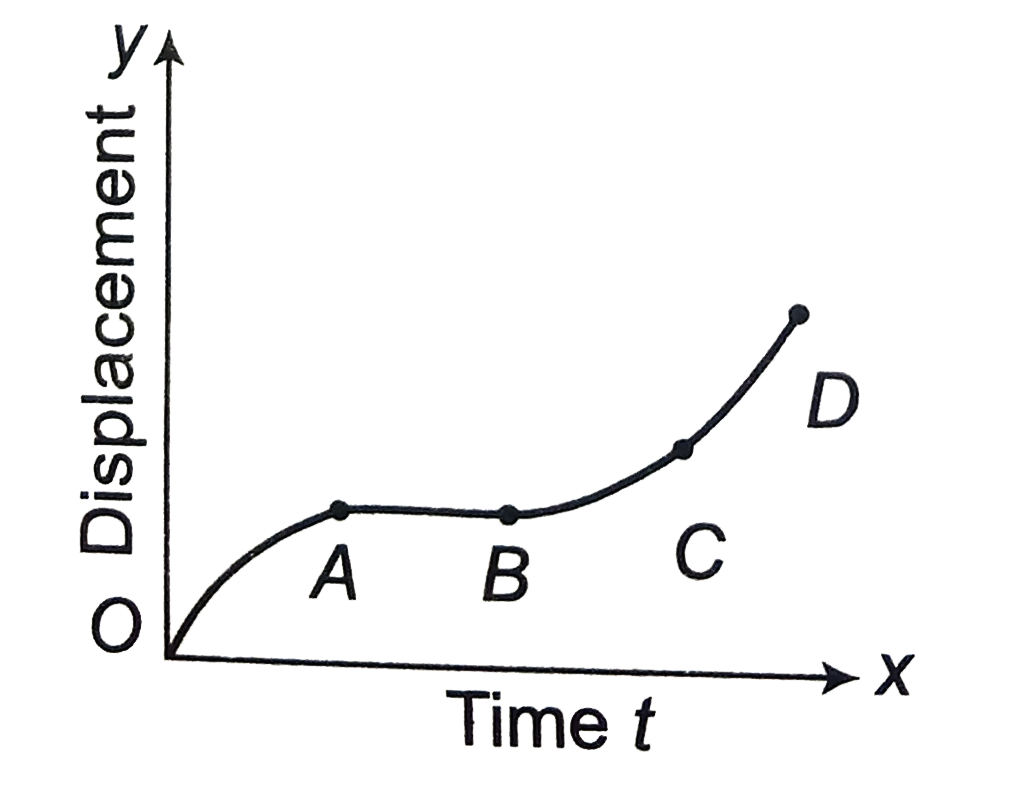 A+,0,+,+B−,0,+,0C+,0,−,+D−,0,−,0
Displacement-time graph of a particle moving in a straight line is as shown in figure. s t a o b c
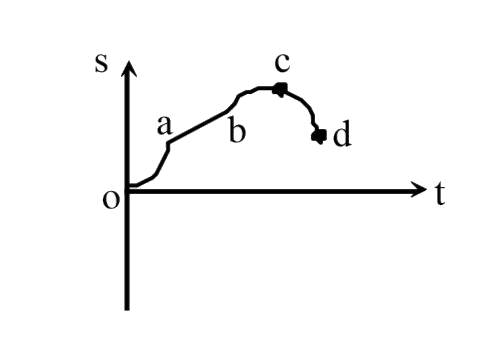
Q. Find the sign of velocity in regions oa, ab, bc and cdAnegative , positive, positive, negativeBpositive , positive, positive, negativeCpositive , negative, positive, positiveDpositive , positive, negative, negative
Displacement-time graph of a particle moving in a straight line is as shown in figure.
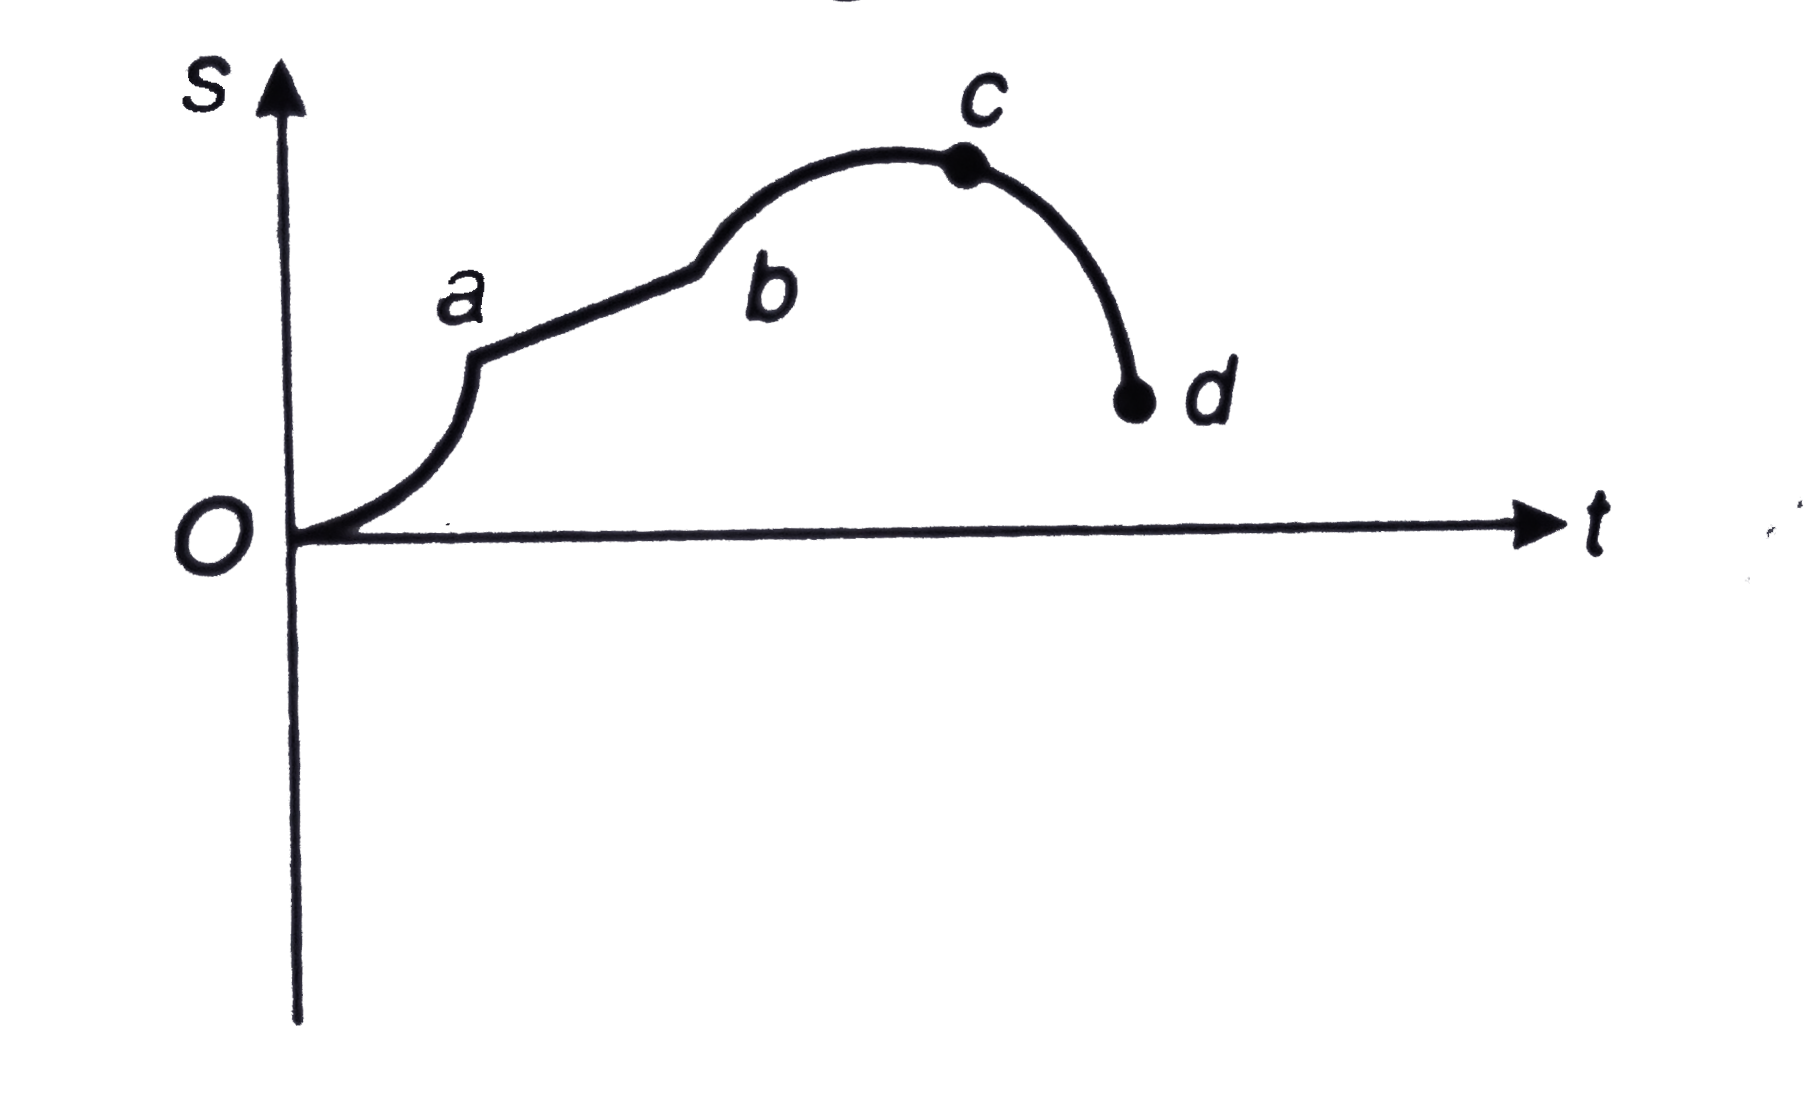
(a) Find the sign of velocity in regions oa,ab, bc and cd.
(b) Find the sign of acceleration in the above region.
View SolutionA particle moves along a horizontal line and its velocity changes with time as shown in the figure.
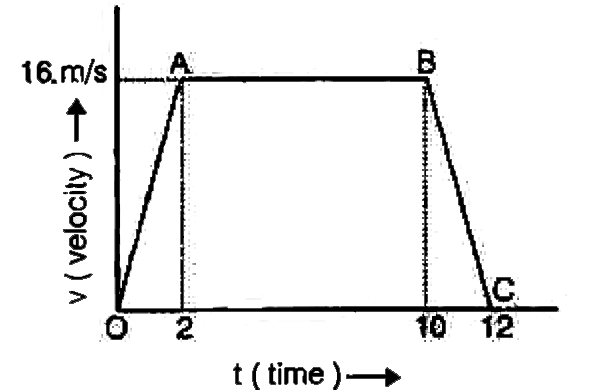
Calculate (i)initial acceleration, (ii)total distance described . Plot the x-t graph of the motion.
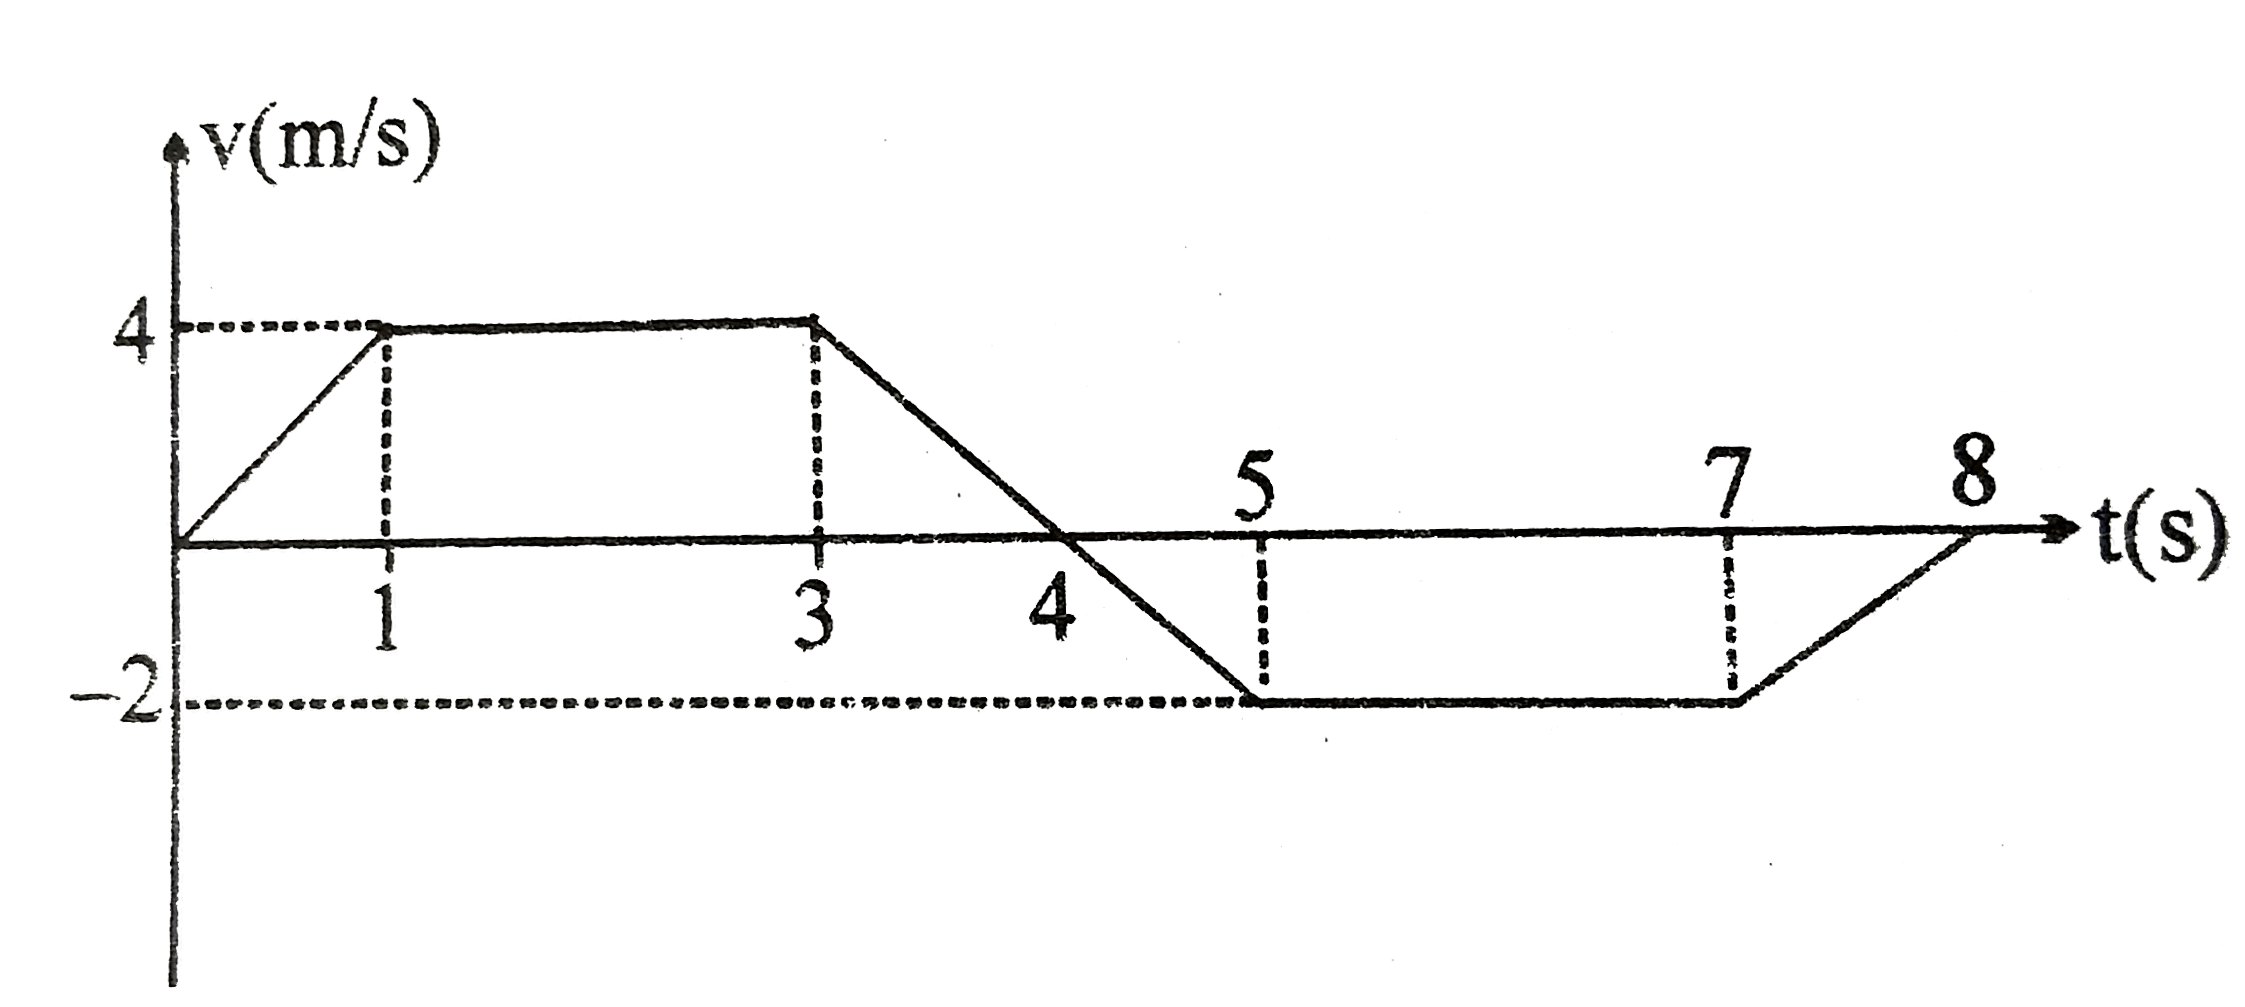
View SolutionThe velocity-time graph of a linear motion is shown below. Find the (a) displacement and distance from the origin after 8s. (b) acceleration in the first second. (c) deceleration during the 5th second. (d) maximum speed during the motion.
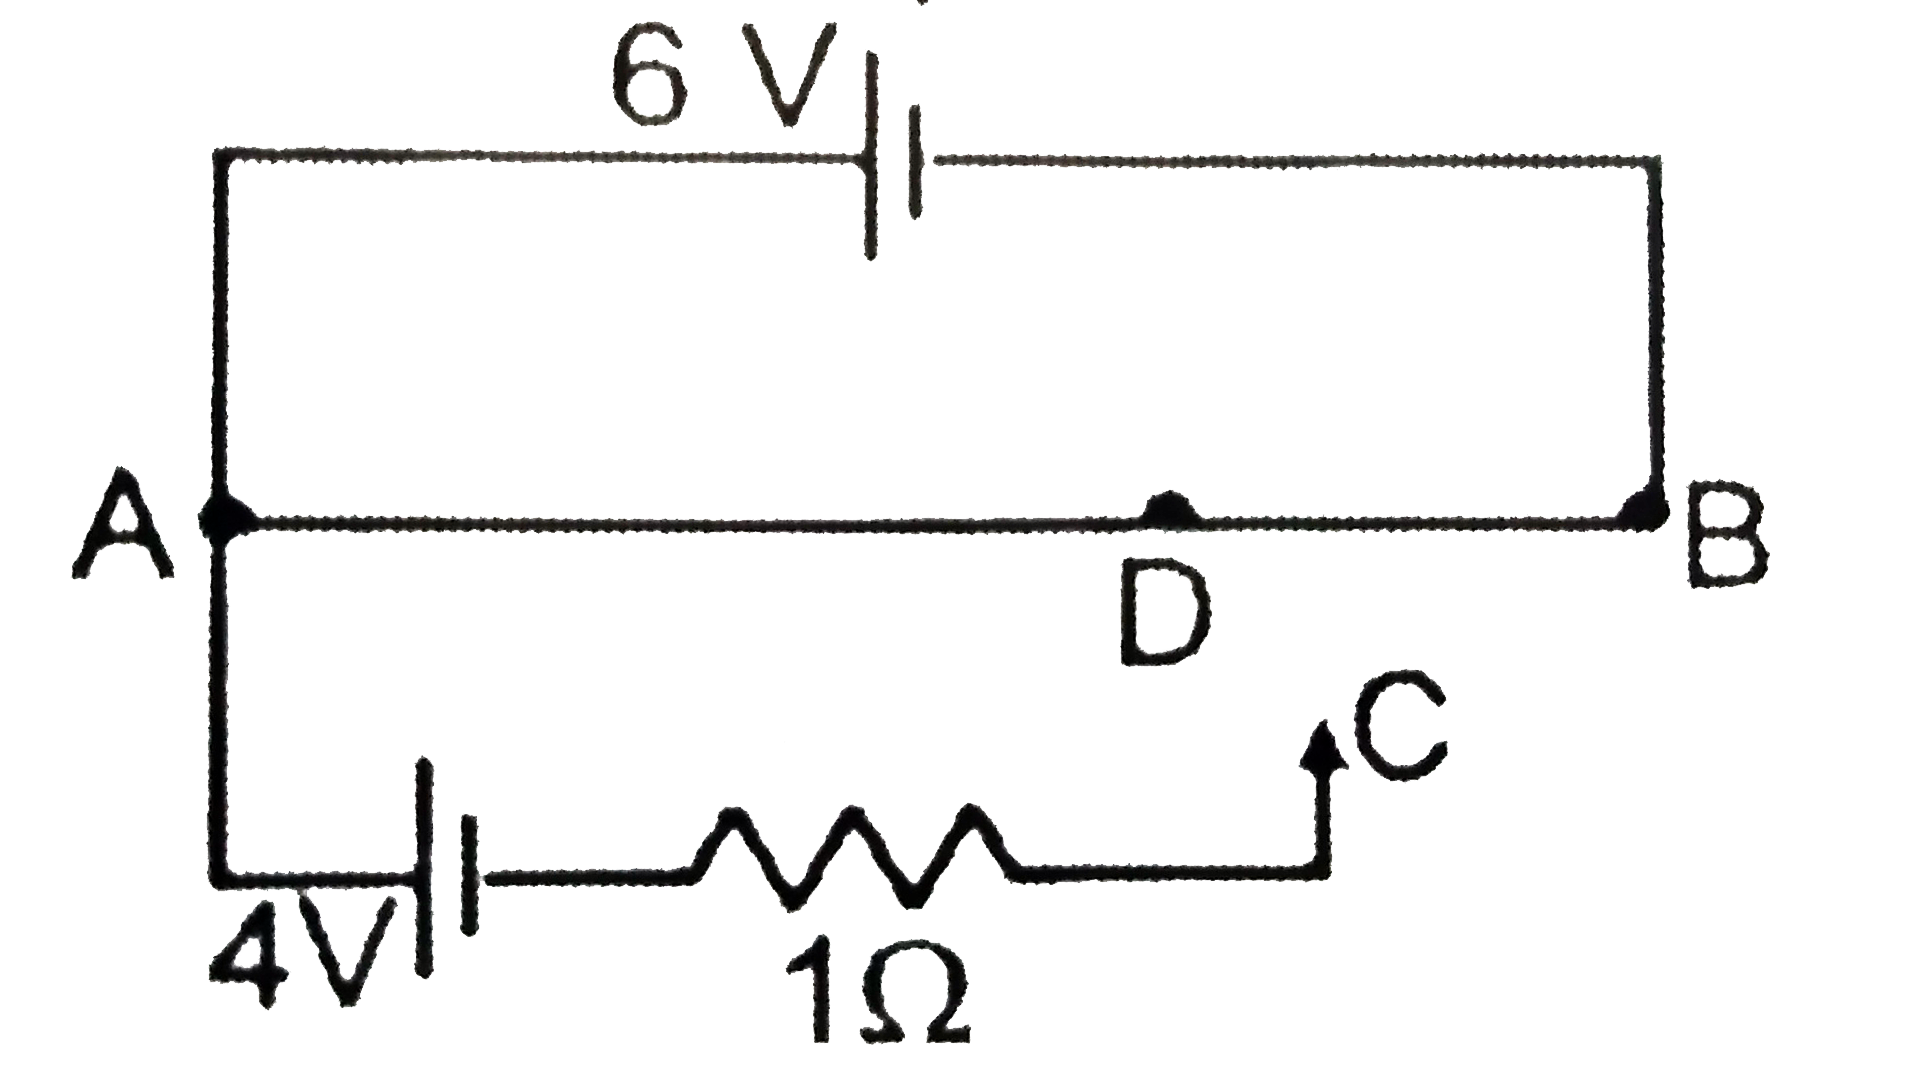
View SolutionA 6 volt battery of negligible internal resistance is connected across a uniform wire AB of length 100cm. The positive terminal of another battery of emf 4V and internal resistance 1Ω is joind to the point A as shown in figure. Take the potential at B to be zero. (a) What are the potentials at the points A and C ? (b) At which D of the wire AB, the potential is equal to the potential at C. ( c) If the point C and D are connected by a wire. What will be the current through is ? (d) Id the 4V batteryt is replaced by 7.5 V battery, what whould be the answers of parts (a) and (b) ?
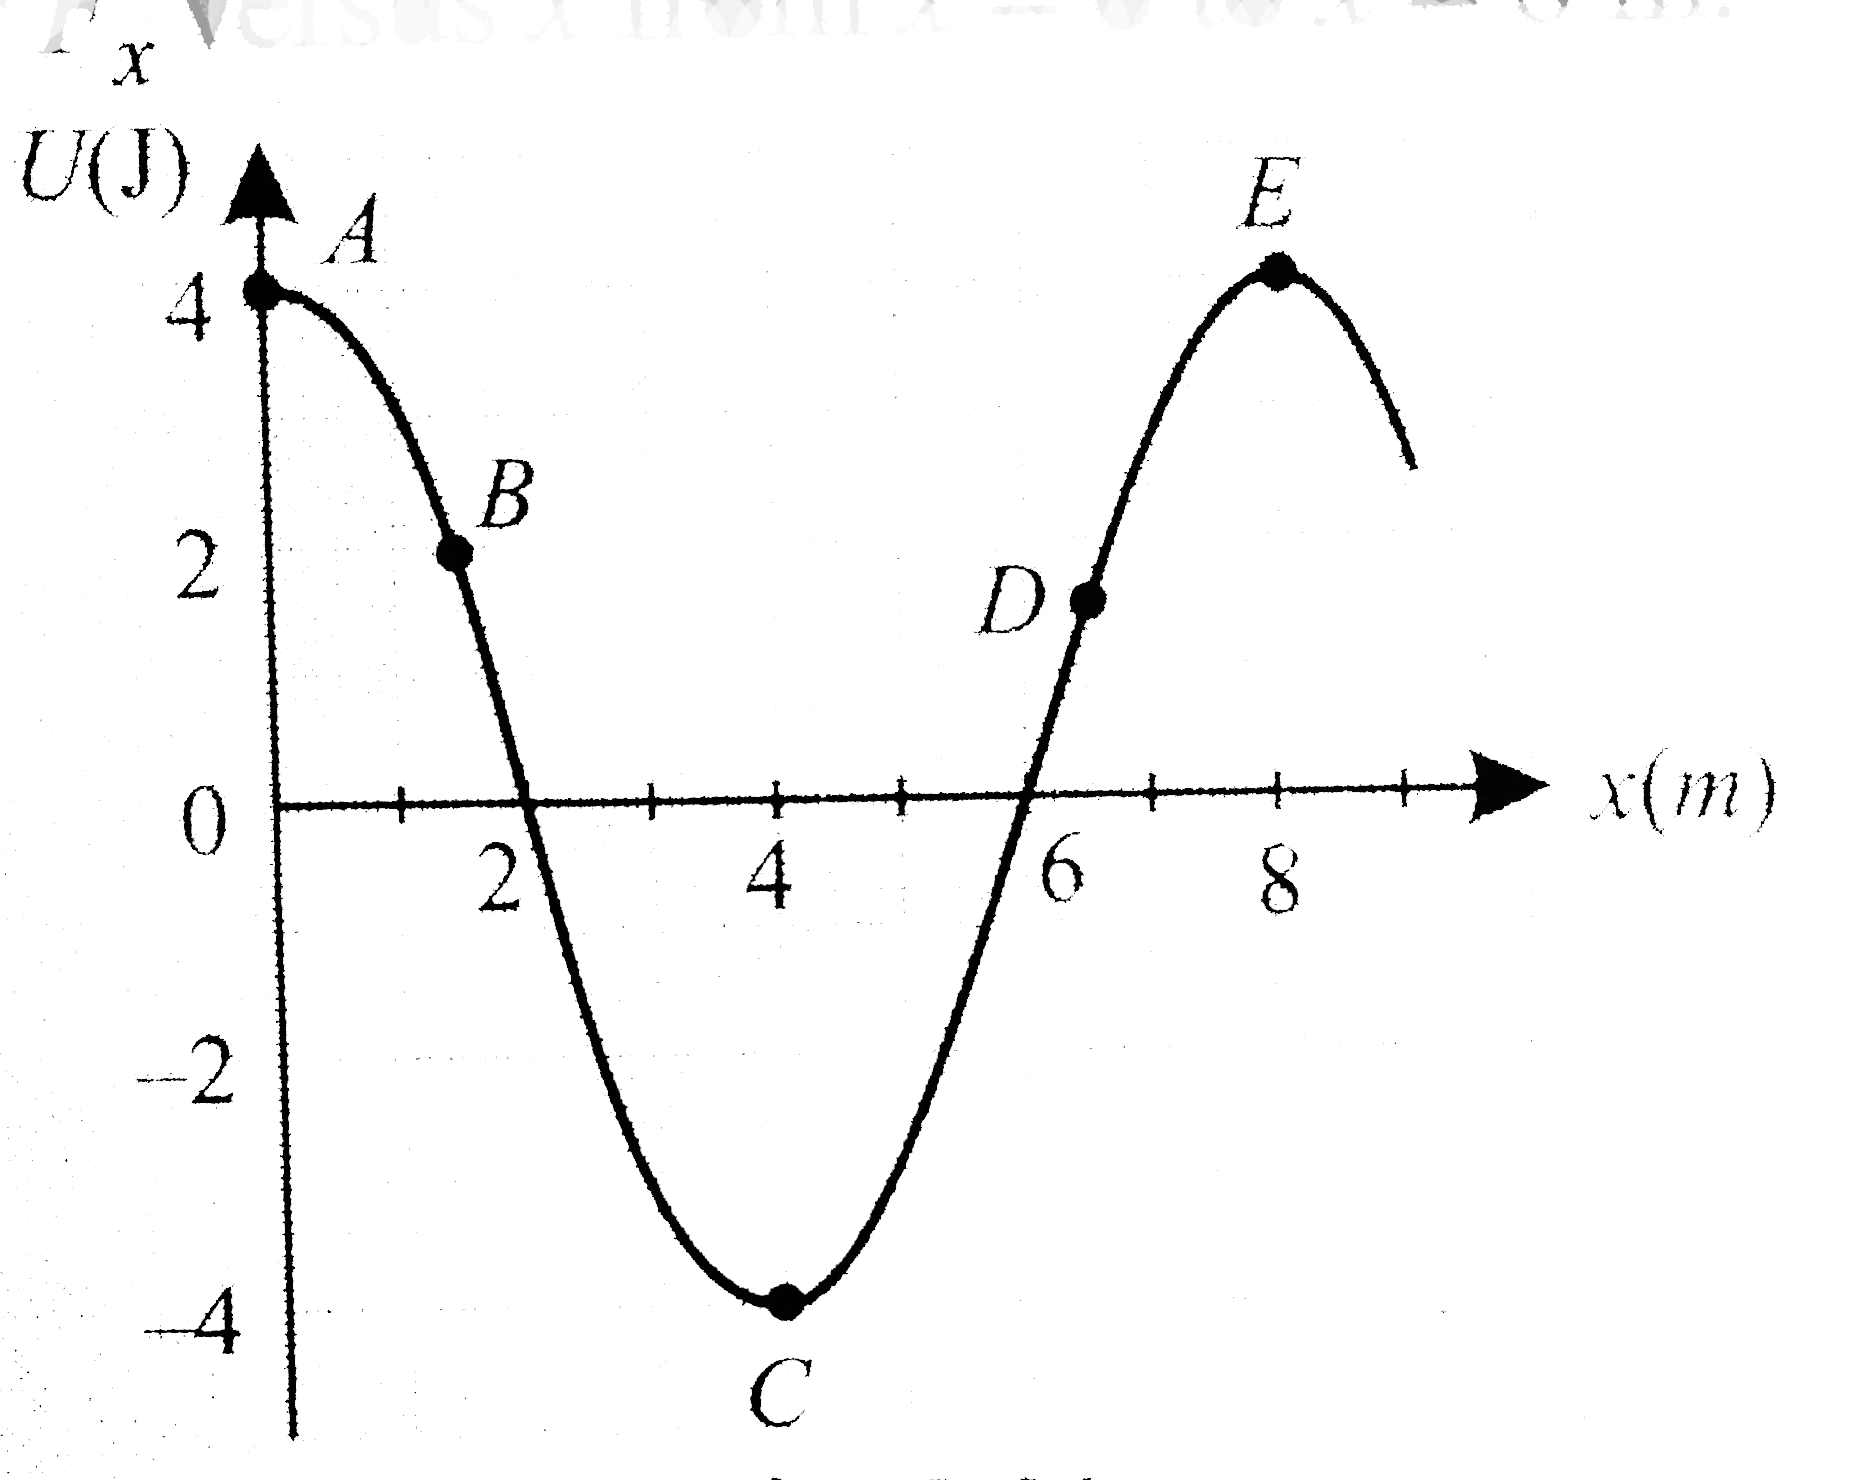
View SolutionFor the potential energy curve shown in figure.
(a) Determine whether the force Fx is positive, negative, or zero at the five points indicated, (b) Indicate points of stable, unstable, and neutral equilibrium, (c) Sketch the curve for Fx versus x from x=0 to x=8m.
View Solution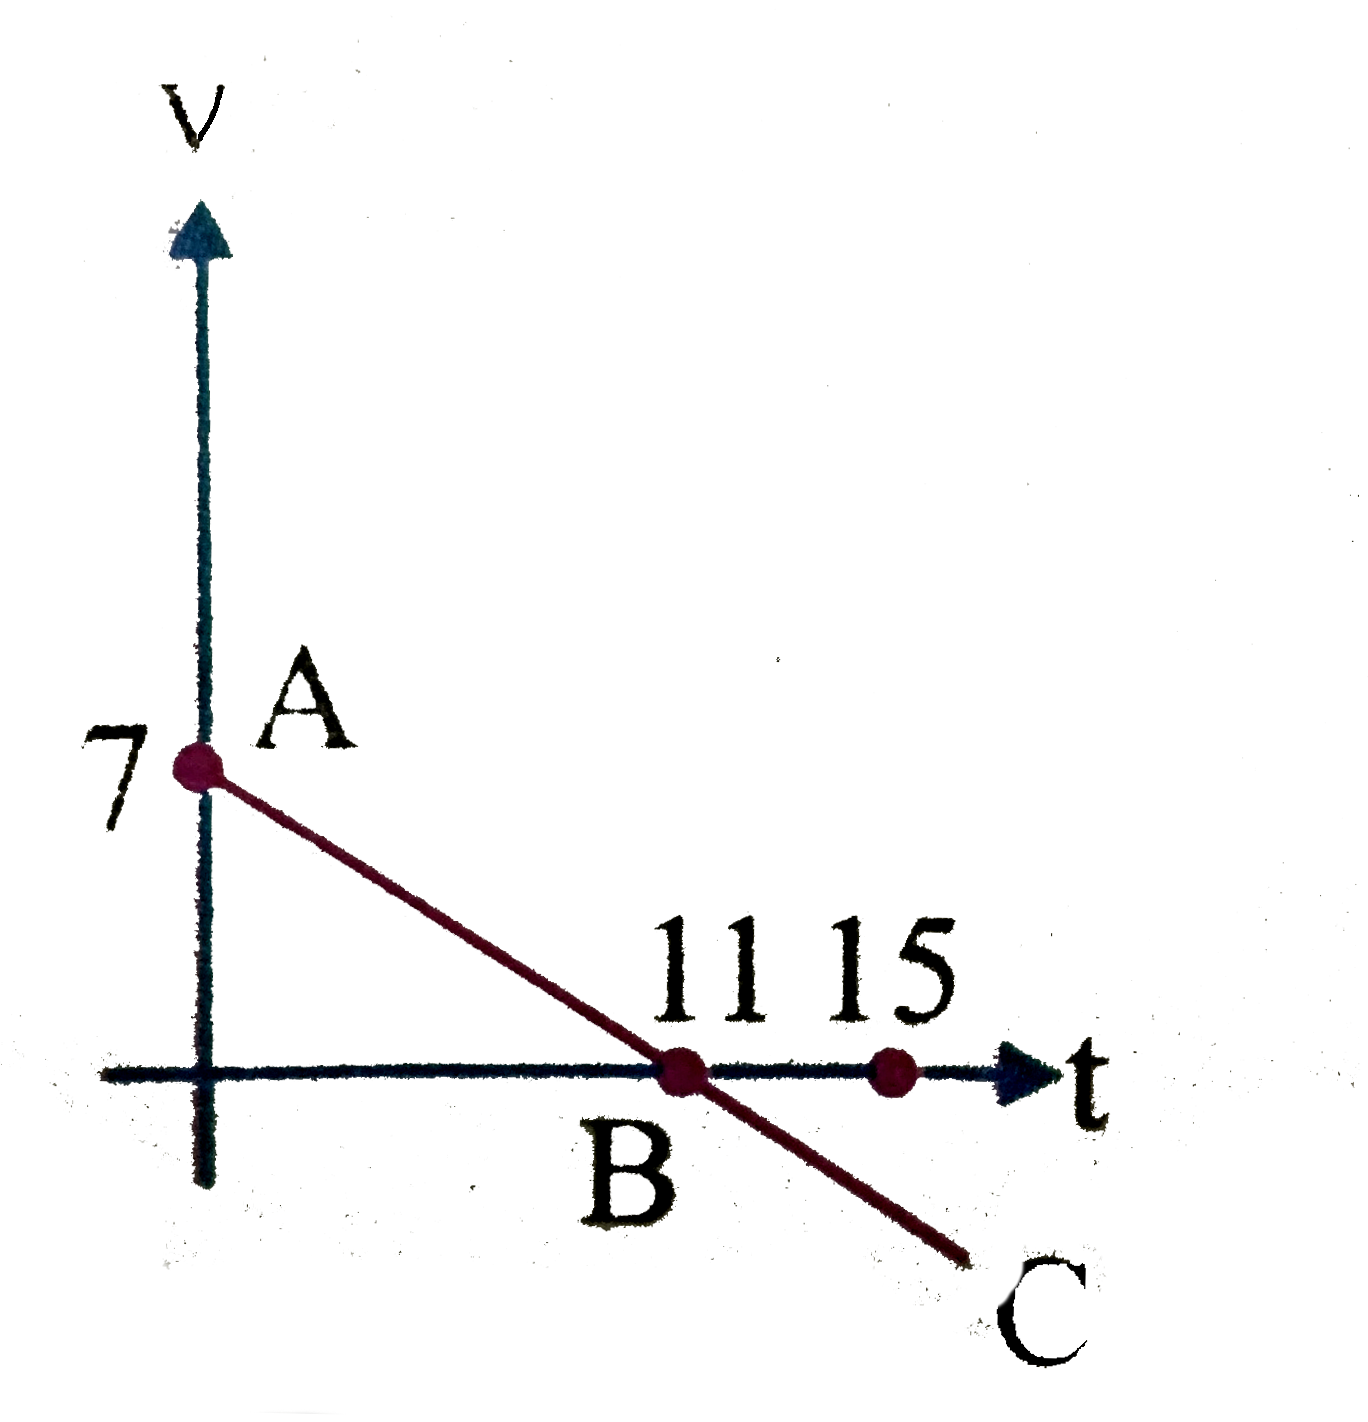
Velocity-time graph for the motion of a certain body is shown in fig. Explain the nature of this motion. Find the initial velocity and acceleration and write the equation for the variation of displacement with time. What happens to the moving body at point B? how will the body more after this moment?
View Solution