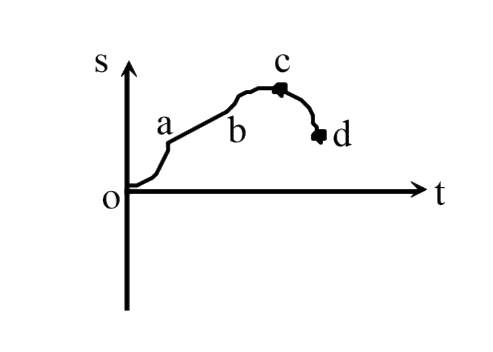
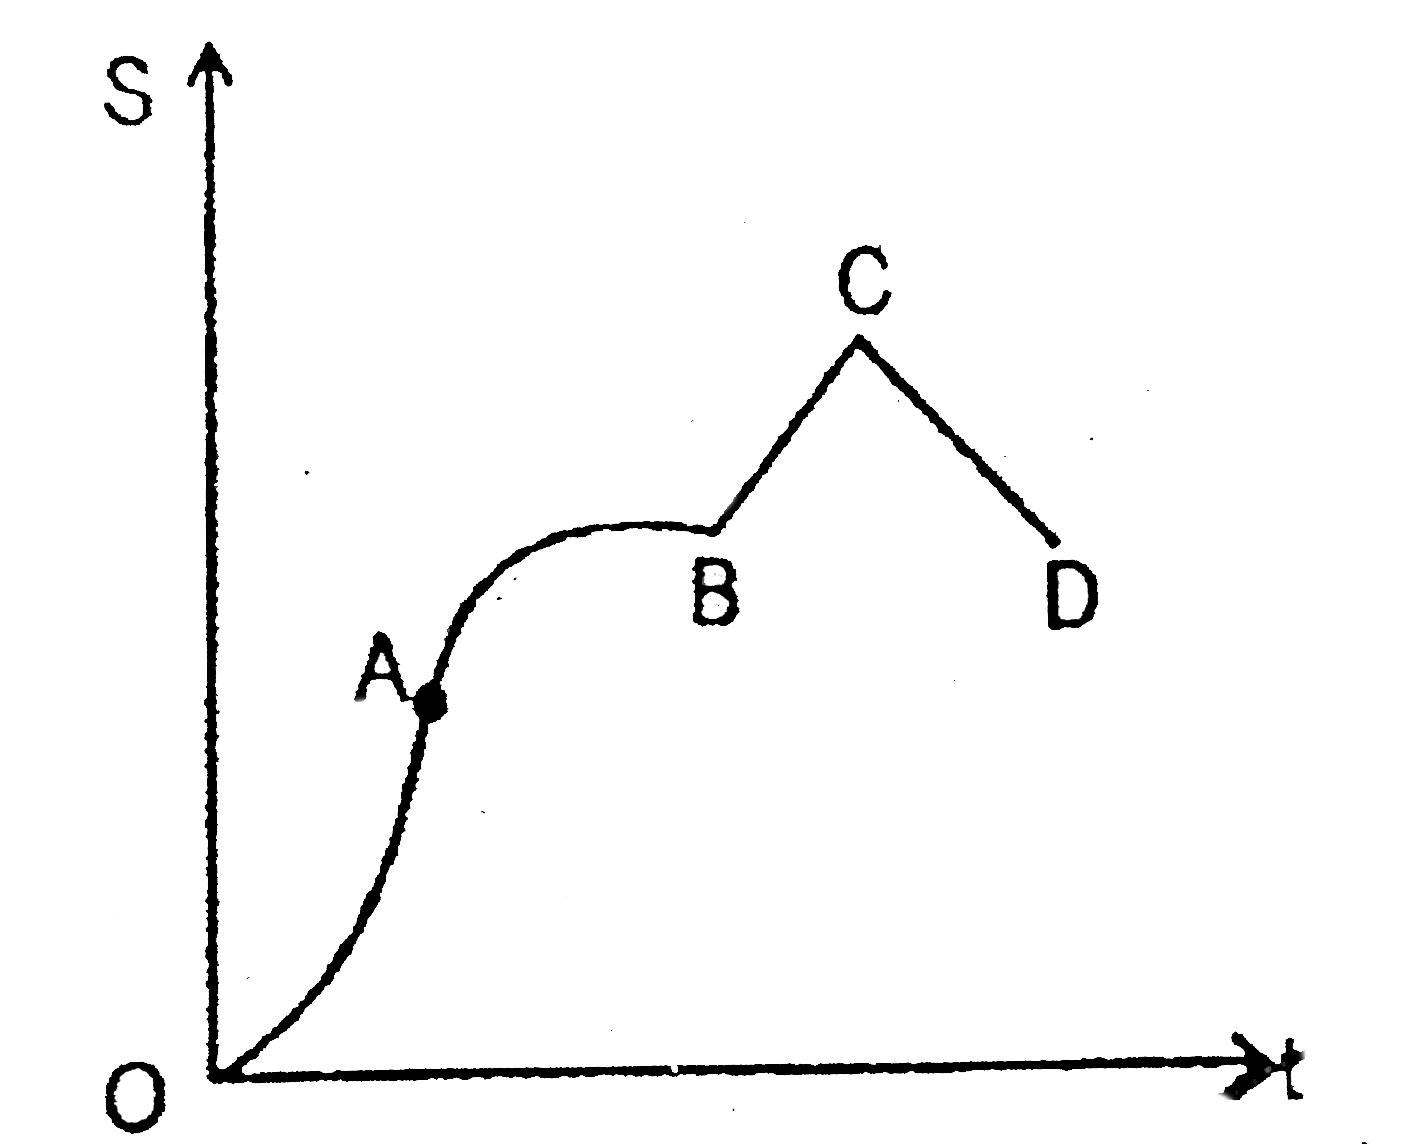
Displacement-time graph of a particle moving in a straight line is as shown in figure.
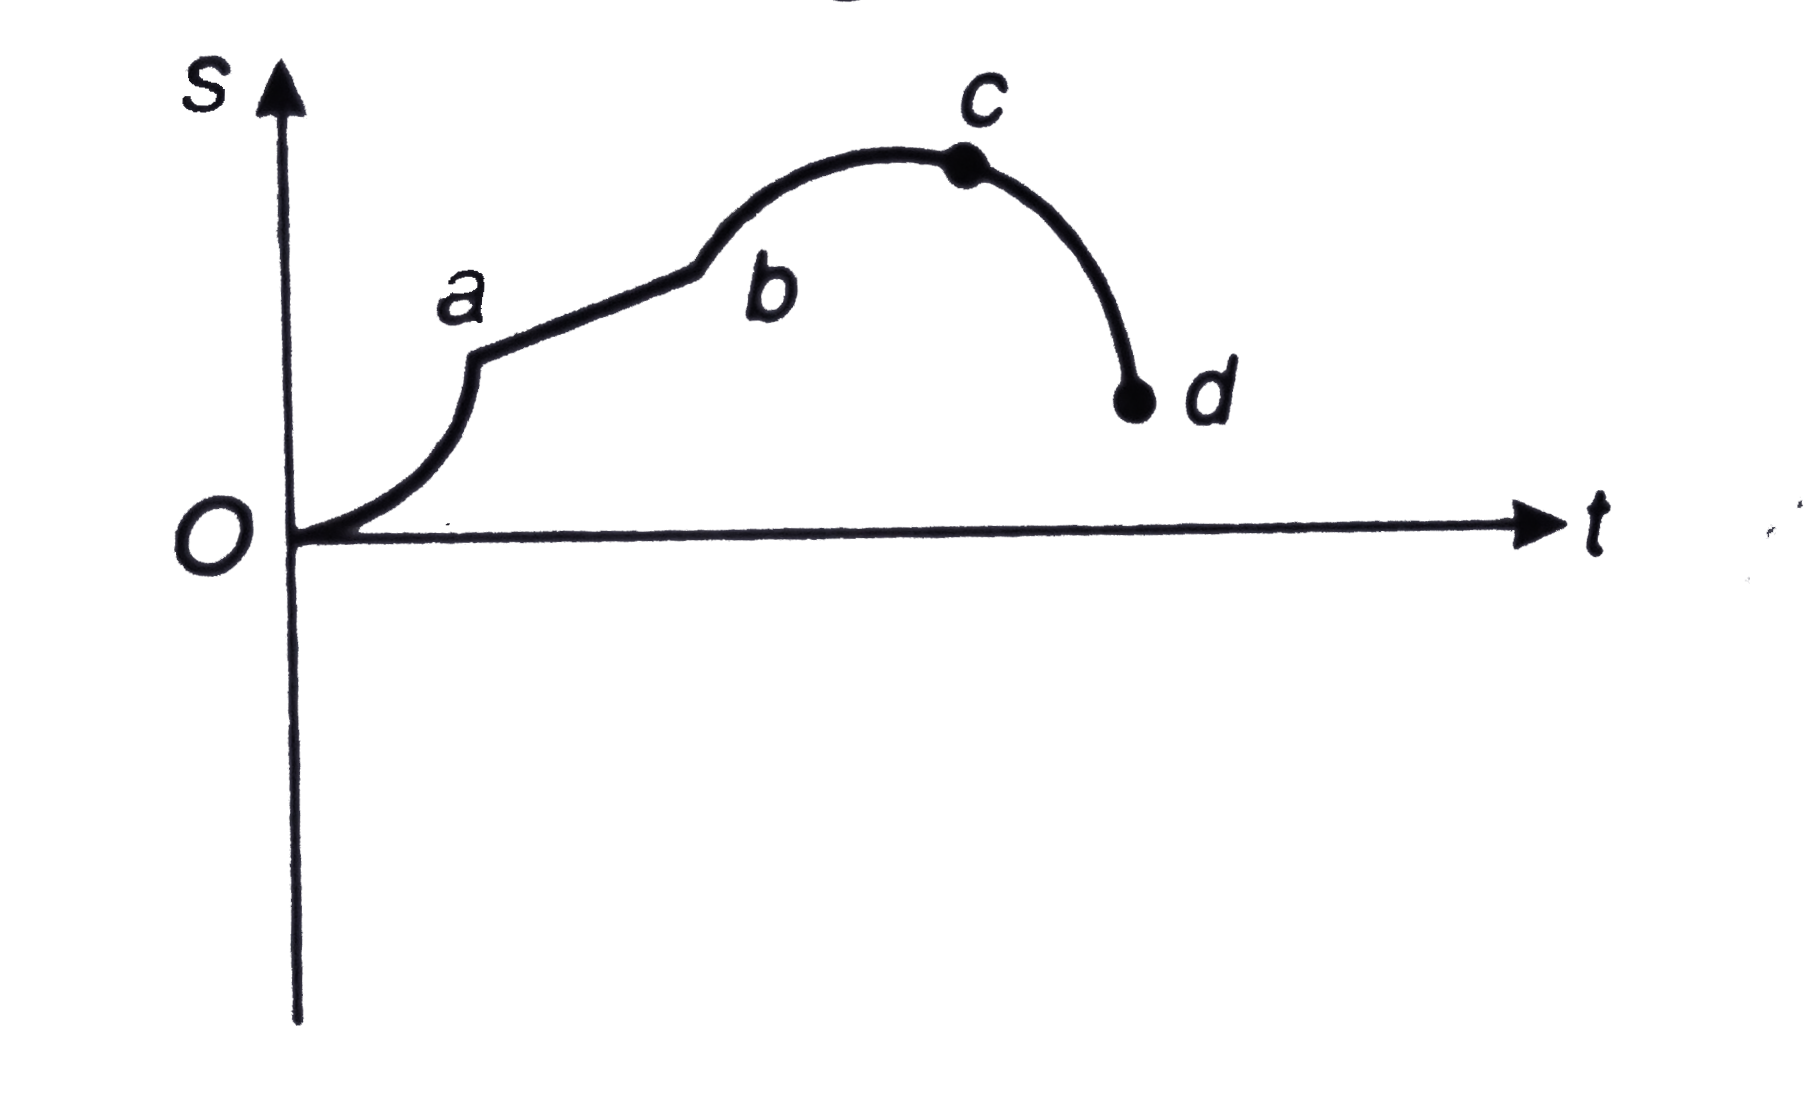
(a) Find the sign of velocity in regions oa,ab, bc and cd.
(b) Find the sign of acceleration in the above region.
Video Solution
Text Solution
The correct Answer is:A, B
(a) Velocity=slope of s-t graph
∴ Sign of velocity=sign of slope s-t graph
(b) Let us discus any one of them, let the portion
cd, slope of s-t graph (=velocity) of this
region is negative but increasing in magnitude.
Therefore sign of velocity and acceleration
both are negative.
|
Topper's Solved these Questions
- KINEMATICSBOOK - DC PANDEYCHAPTER - KINEMATICSEXERCISE - Subjective
51 Videos
- KINEMATICSBOOK - DC PANDEYCHAPTER - KINEMATICSEXERCISE - More Than One Correct
6 Videos
- KINEMATICSBOOK - DC PANDEYCHAPTER - KINEMATICSEXERCISE - Assertion And Reason
12 Videos
- GRAVITATIONBOOK - DC PANDEYCHAPTER - GRAVITATIONEXERCISE - (C) Chapter Exercises
45 Videos
- KINEMATICS 1BOOK - DC PANDEYCHAPTER - KINEMATICS 1EXERCISE - INTEGER_TYPE
15 Videos
Similar Questions
Knowledge Check
Displacement time graph of a particle moving in a straight line is a shown in figure.
 Ain region A acceleration is positiveBin region B acceleration is negativeCin region C acceleration is positiveDin region D acceleration is negative
Displacement-time graph of a particle moving in a straight line is as shown in figure. s t a o b c
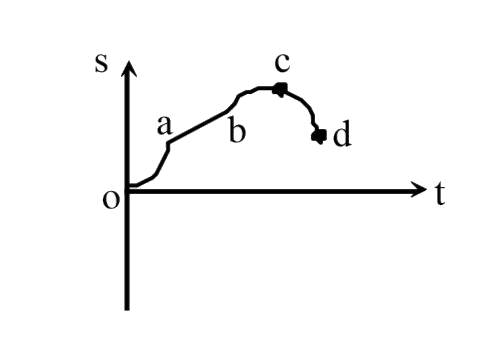
Q. Find the sign of velocity in regions oa, ab, bc and cdAnegative , positive, positive, negativeBpositive , positive, positive, negativeCpositive , negative, positive, positiveDpositive , positive, negative, negativeVelocity displacement graph of a particle moving in a straight line is as shown in figure.
 Amagnitude of acceleration of particle is decreasingBmagnitude of acceleration of particlre is increasingCacceleration versus displacement graph straight lineDacceleration versus displacement graph is parabola
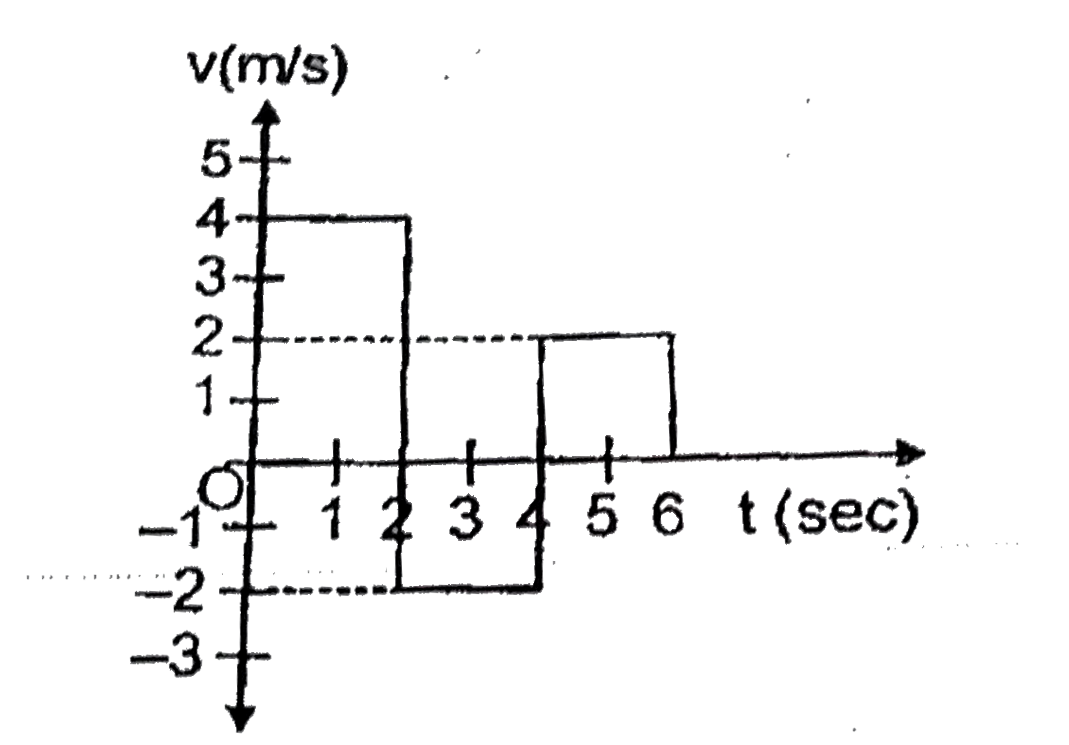
The velocity-time graph of a body moving in a straight line is shown in the figure.
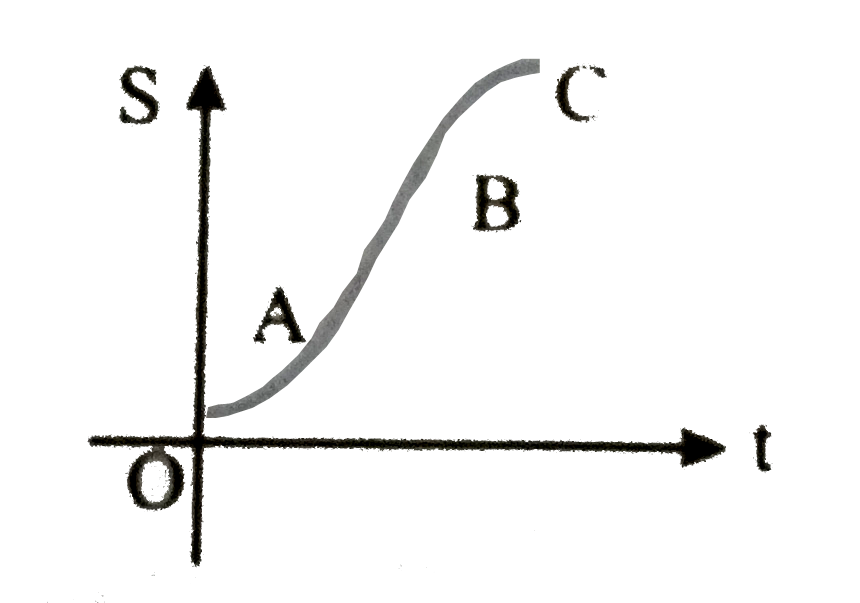
View SolutionDisplacement time graph of a particle moving in a straight line is as shown in figure. Select the correct alternative (s) :
 .
.
View SolutionDisplacment-time graph of a particle moving in a straight line is as shown in figure. Choose the INCORRECT statement(s)
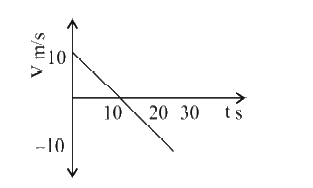
View SolutionThe velocity- time plot for a particle moving on a straight line is shown in the figure
View SolutionThe velocity time plot for a particle moving on straight line is shown in the figure.
View Solution

