A graph showing variation of osmotic pressure (π) versus molar concentration 'C' of an aqueous solution at temperature T is given below

The slope of the line represents
solution constant R
absolute temperature T
RT
degree of ionization of solute
The correct Answer is:C
Step by step video & image solution for A graph showing variation of osmotic pressure (pi) versus molar concentration 'C' of an aqueous solution at temperature T is given below The slope of the line represents by Chemistry experts to help you in doubts & scoring excellent marks in Class 12 exams.
Updated on:21/07/2023Similar Questions
Knowledge Check
At a given temperature, osmotic pressure of a concentrated solution of a substance __
Ais higher than that of a dilute solutionBis lower than that of a dilute solutionCis same as that of a dilute solutionDcannot be compared with that of a dilute solution.
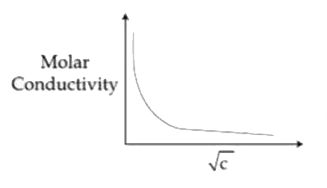
The variation of molar conductivity wih concentration of an electrolyte (X) in aqueous solution is shown in the given figure .

The electrolyte X is :
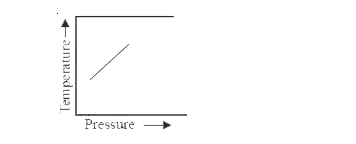
View SolutionThe curve showing the variation of pressure with temperature for a given amount of adsoption is called

View SolutionPlots showing the variation of the rate constant (k) with temperature (T) are given below. The plot that follows the Arrhenius equation is
View SolutionThe osmotic pressure of a sugar solution at 24∘C is 2.5atm. The concentration of the solution in mole per litre is
View SolutionChoose the correct graph of variation of magnetic susceptibility Xm of paramagnetic substance versus absolute temperature T.
View SolutionAt temperature 327∘C and concentration C, the osmotic pressure of a solution is P. The same solution at concentration C/2 and a temperature 427∘C of shows osmotic pressure of 2 atm. The value of P will be :
View Solution(a) Draw graph showing the variation of current versus voltage in an electroyte when an external resistance is also connceted.
(b) (i) The graph between resistance (R ) and temperature (T) for Hg is shown in the figure (a). Explain the behaviour of Hg near 4k.
(ii) In which region of the graph shown in the figure (b) is the resistance negative and why?

View Solution
