Which of the following curve will represent the variation of conductance C during titration of CH3COOH by gradual addition of NaOH solution (V)
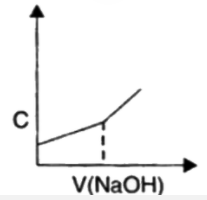
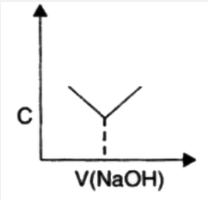
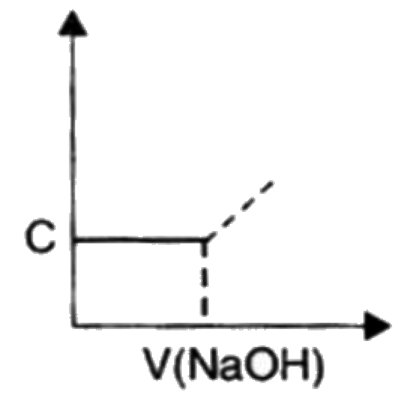
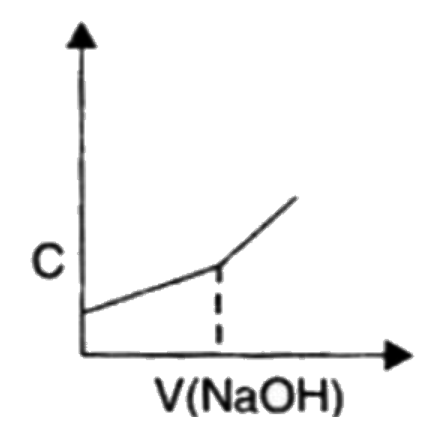
The correct Answer is:D
To determine the variation of conductance (C) during the titration of acetic acid (CH₃COOH) with sodium hydroxide (NaOH), we need to analyze the behavior of the weak acid and the strong base during the titration process.
1. Understanding the Components:
- CH₃COOH (Acetic Acid): A weak acid that partially dissociates in solution.
- NaOH (Sodium Hydroxide): A strong base that completely dissociates in solution to give Na⁺ and OH⁻ ions.
2. Initial Conductance:
- At the beginning of the titration, the solution contains only acetic acid, which has a low degree of dissociation. Therefore, the initial conductance is low.
3. Addition of NaOH:
- As NaOH is gradually added, the OH⁻ ions react with the acetic acid (CH₃COOH) to form acetate ions (CH₃COO⁻) and water. This reaction increases the concentration of ions in the solution, leading to an increase in conductance.
4. Formation of Sodium Acetate:
- The reaction can be represented as:
CH3COOH+NaOH→CH3COONa+H2O
- Sodium acetate (CH₃COONa) is formed, which is highly ionized in solution. This contributes further to the increase in conductance.
5. Near the Equivalence Point:
- As we approach the equivalence point, where all acetic acid has reacted with NaOH, the conductance continues to rise. However, the increase in conductance becomes more pronounced due to the presence of a large number of fast-moving OH⁻ ions.
6. Post Equivalence Point:
- After the equivalence point, any additional NaOH will increase the concentration of OH⁻ ions significantly, leading to a sharp increase in conductance.
7. Graphical Representation:
- The curve representing the conductance will show a gradual increase initially (as weak acid is titrated), followed by a steep rise as the strong base is added, particularly after reaching the equivalence point.
Conclusion:
The correct curve representing the variation of conductance during the titration of CH₃COOH by NaOH will show a gradual increase followed by a sharp rise, which corresponds to option D.
- CH₃COOH (Acetic Acid): A weak acid that partially dissociates in solution.
- NaOH (Sodium Hydroxide): A strong base that completely dissociates in solution to give Na⁺ and OH⁻ ions.
- At the beginning of the titration, the solution contains only acetic acid, which has a low degree of dissociation. Therefore, the initial conductance is low.
- As NaOH is gradually added, the OH⁻ ions react with the acetic acid (CH₃COOH) to form acetate ions (CH₃COO⁻) and water. This reaction increases the concentration of ions in the solution, leading to an increase in conductance.
- The reaction can be represented as:
CH3COOH+NaOH→CH3COONa+H2O
- Sodium acetate (CH₃COONa) is formed, which is highly ionized in solution. This contributes further to the increase in conductance.
- As we approach the equivalence point, where all acetic acid has reacted with NaOH, the conductance continues to rise. However, the increase in conductance becomes more pronounced due to the presence of a large number of fast-moving OH⁻ ions.
- After the equivalence point, any additional NaOH will increase the concentration of OH⁻ ions significantly, leading to a sharp increase in conductance.
- The curve representing the conductance will show a gradual increase initially (as weak acid is titrated), followed by a steep rise as the strong base is added, particularly after reaching the equivalence point.
The correct curve representing the variation of conductance during the titration of CH₃COOH by NaOH will show a gradual increase followed by a sharp rise, which corresponds to option D.
Topper's Solved these Questions
Similar Questions
Knowledge Check
which one of the following curves represents the graph of pH during titration of NaOH and HCl (aq).?
A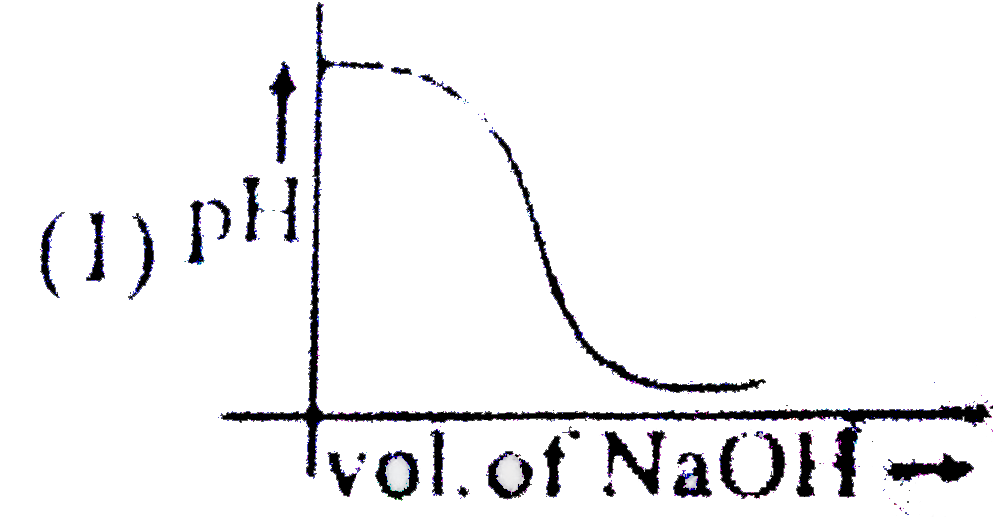 B
B C
C D
D
Which of the following plots represents correctly the variation of conductivity with concentration?
A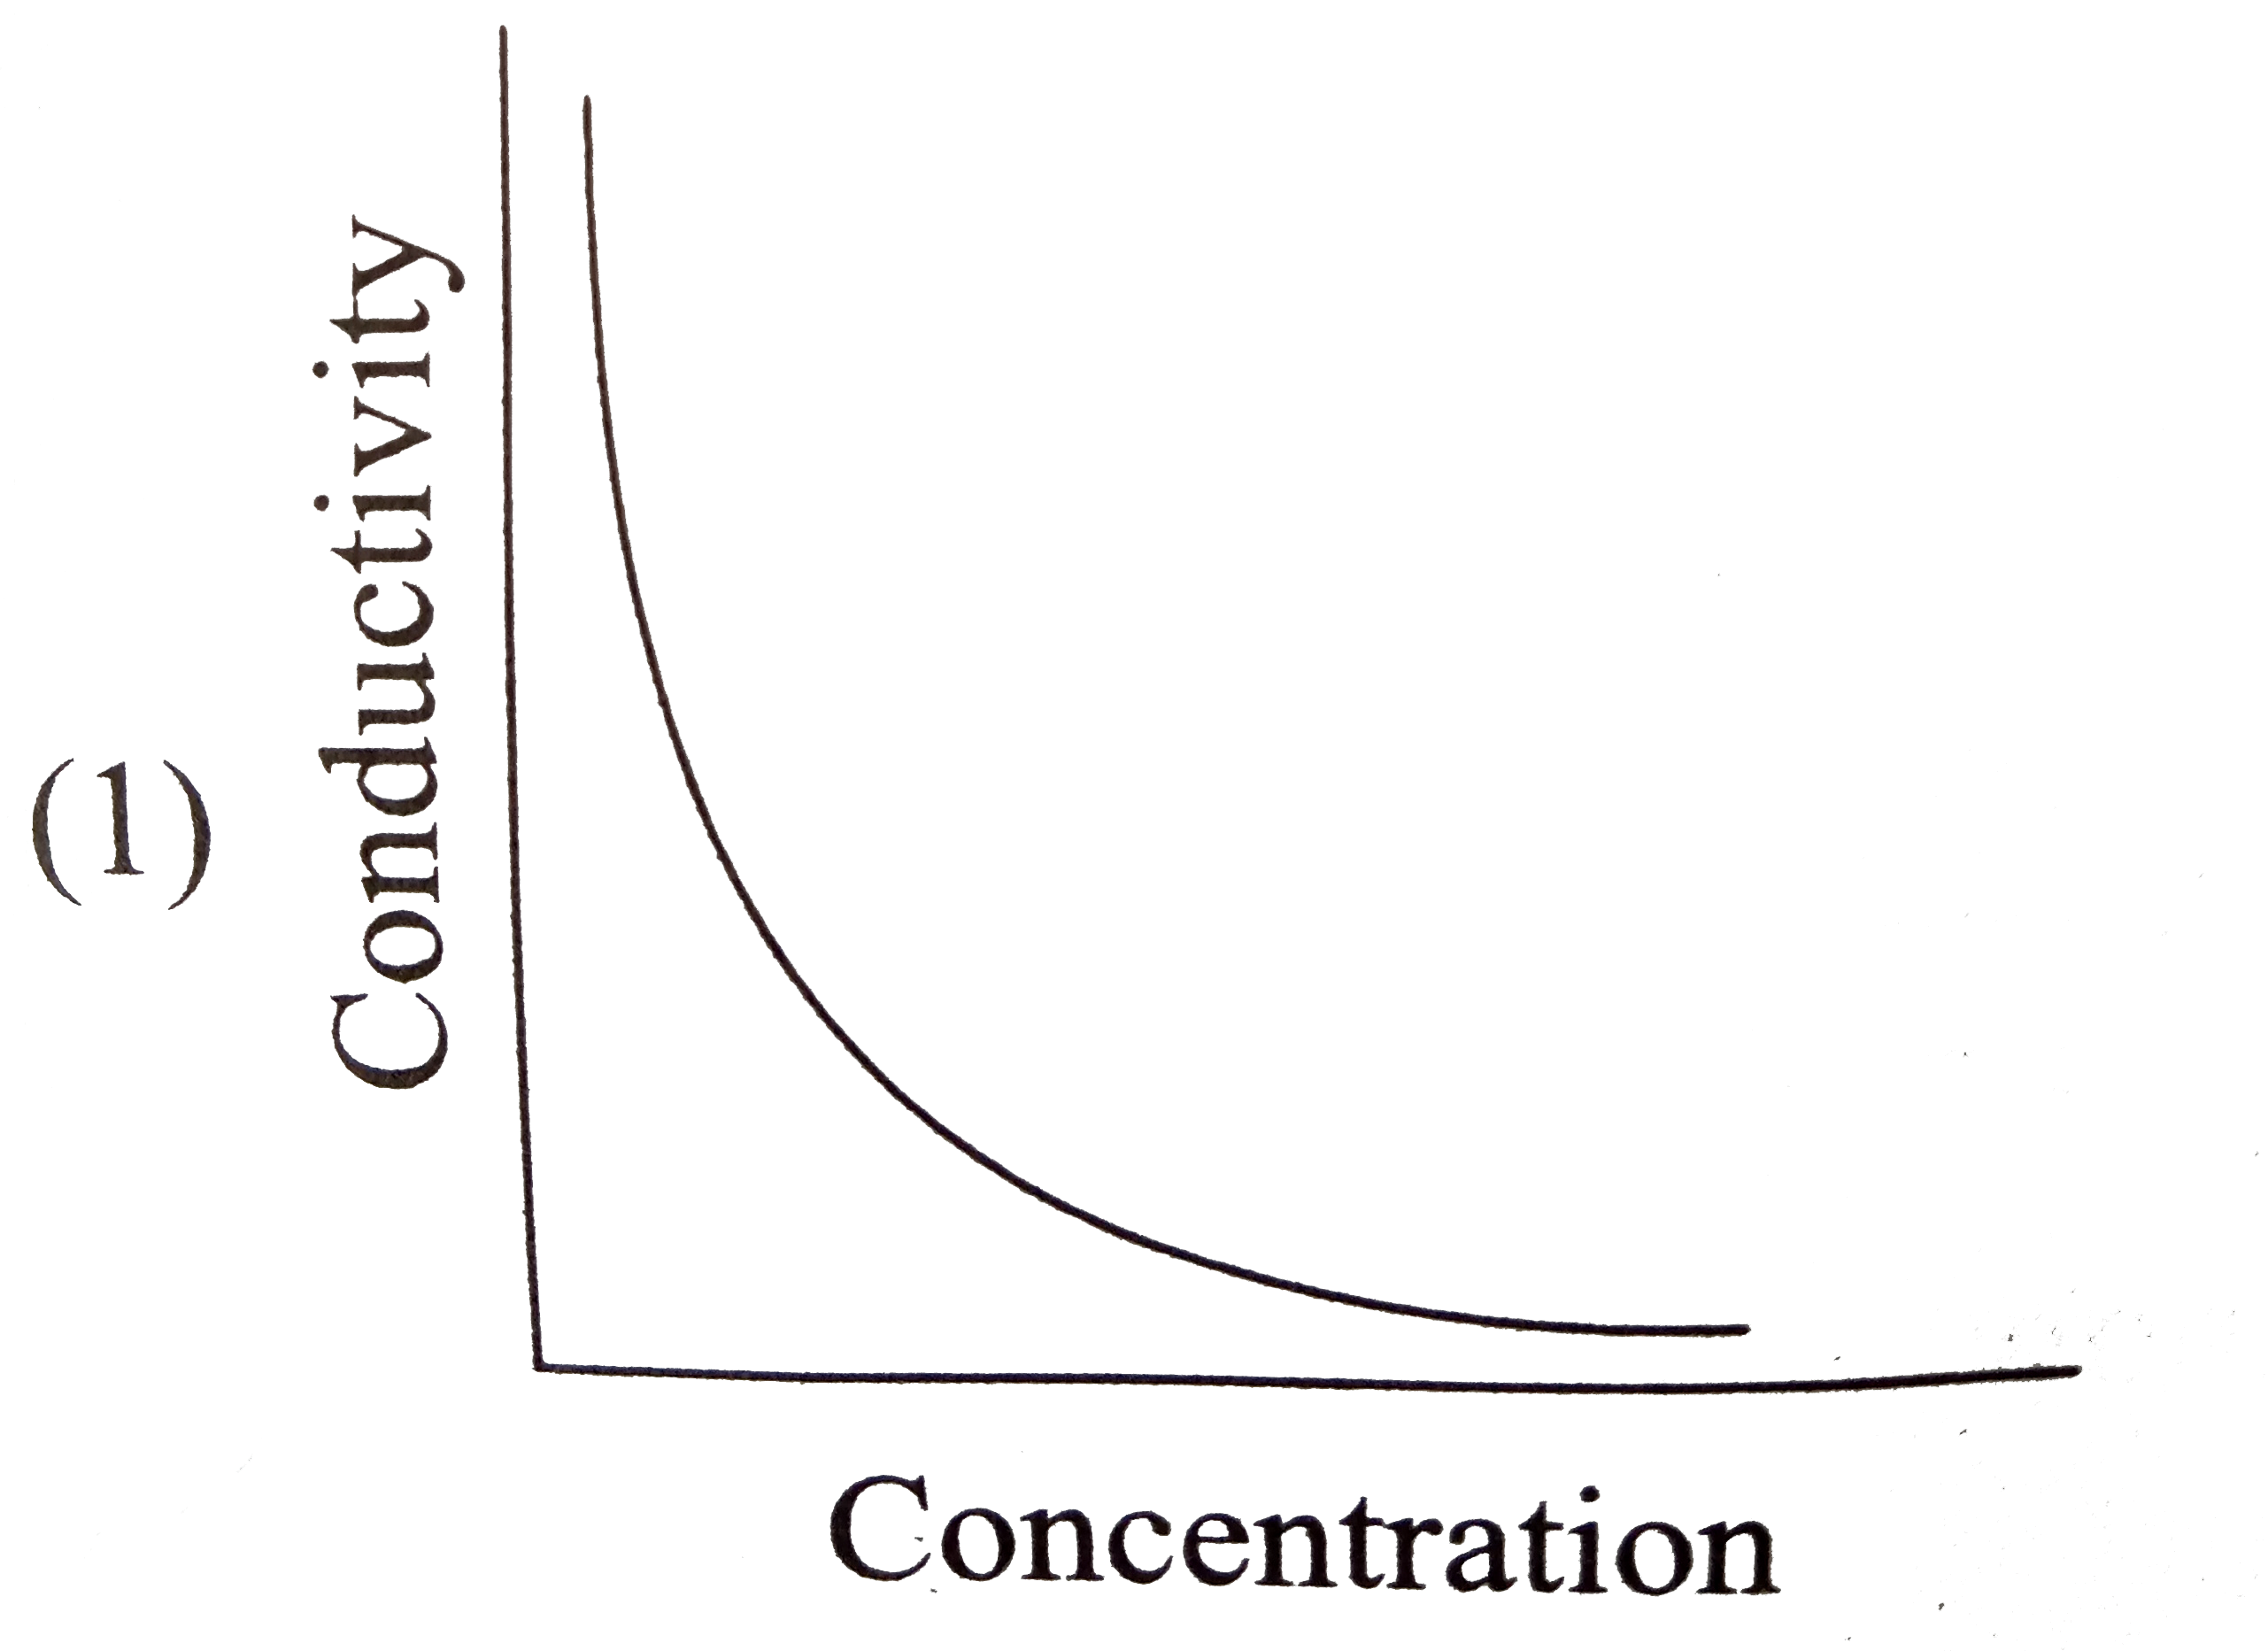 B
B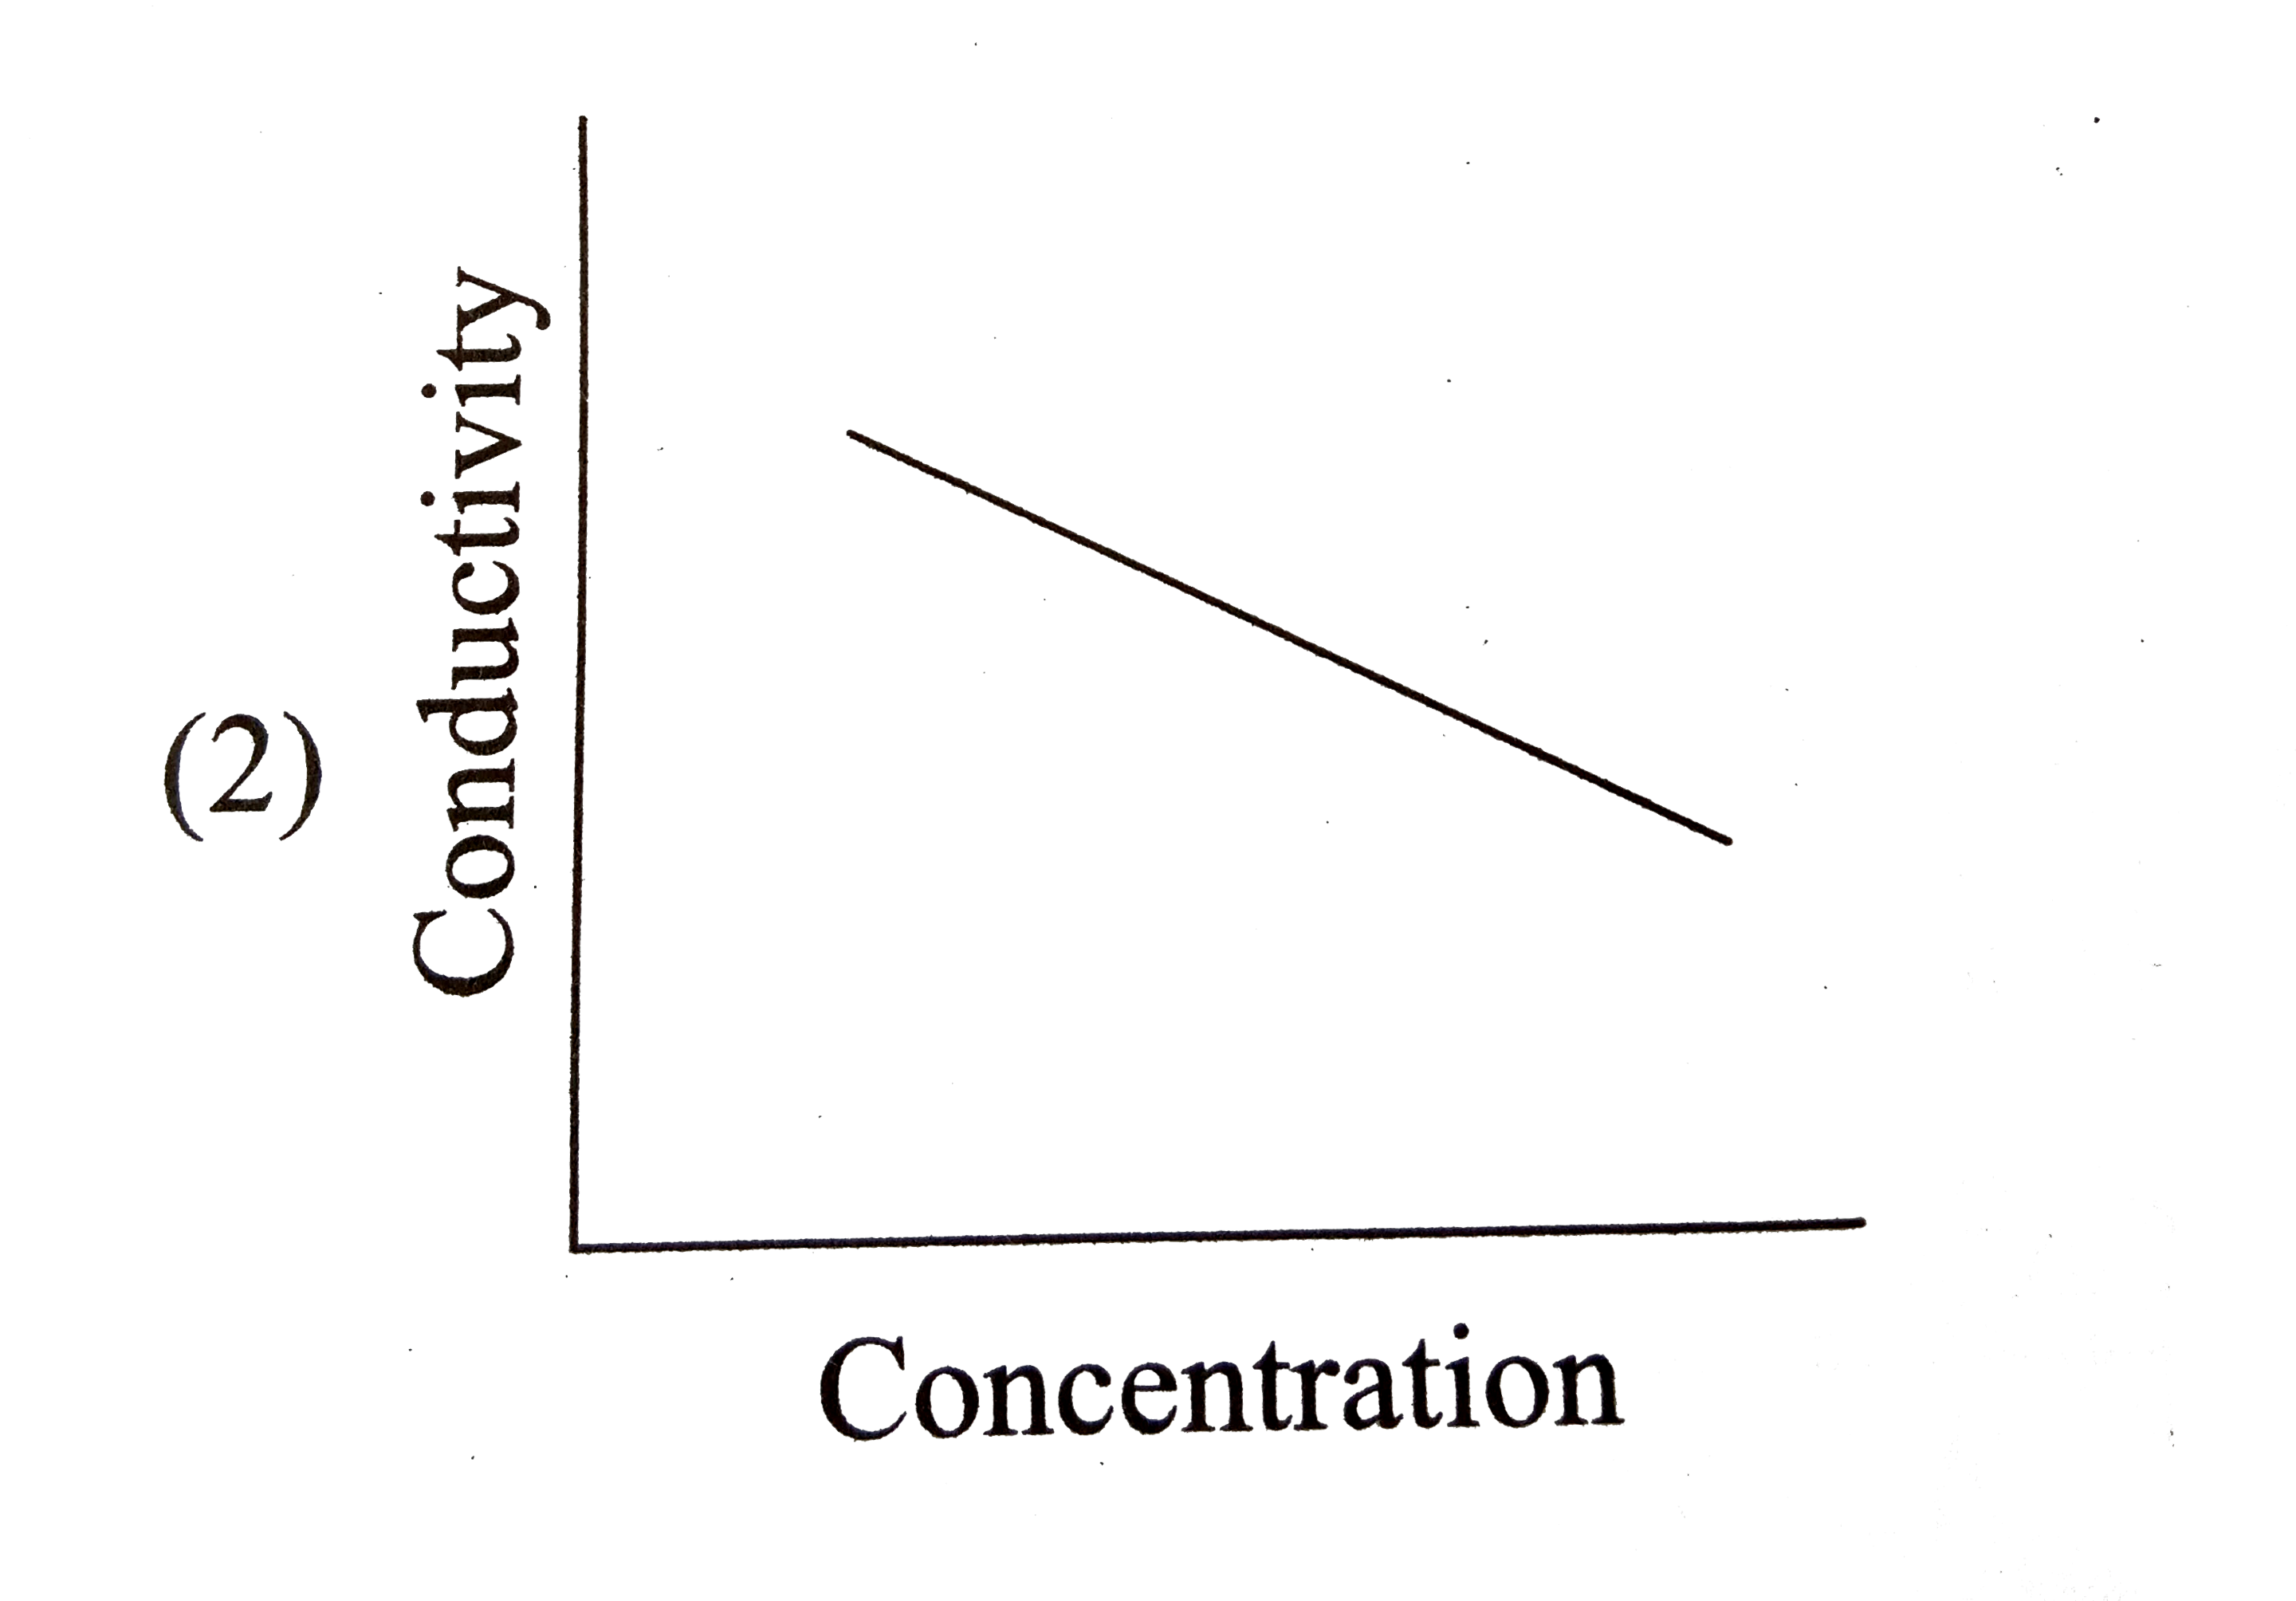 C
C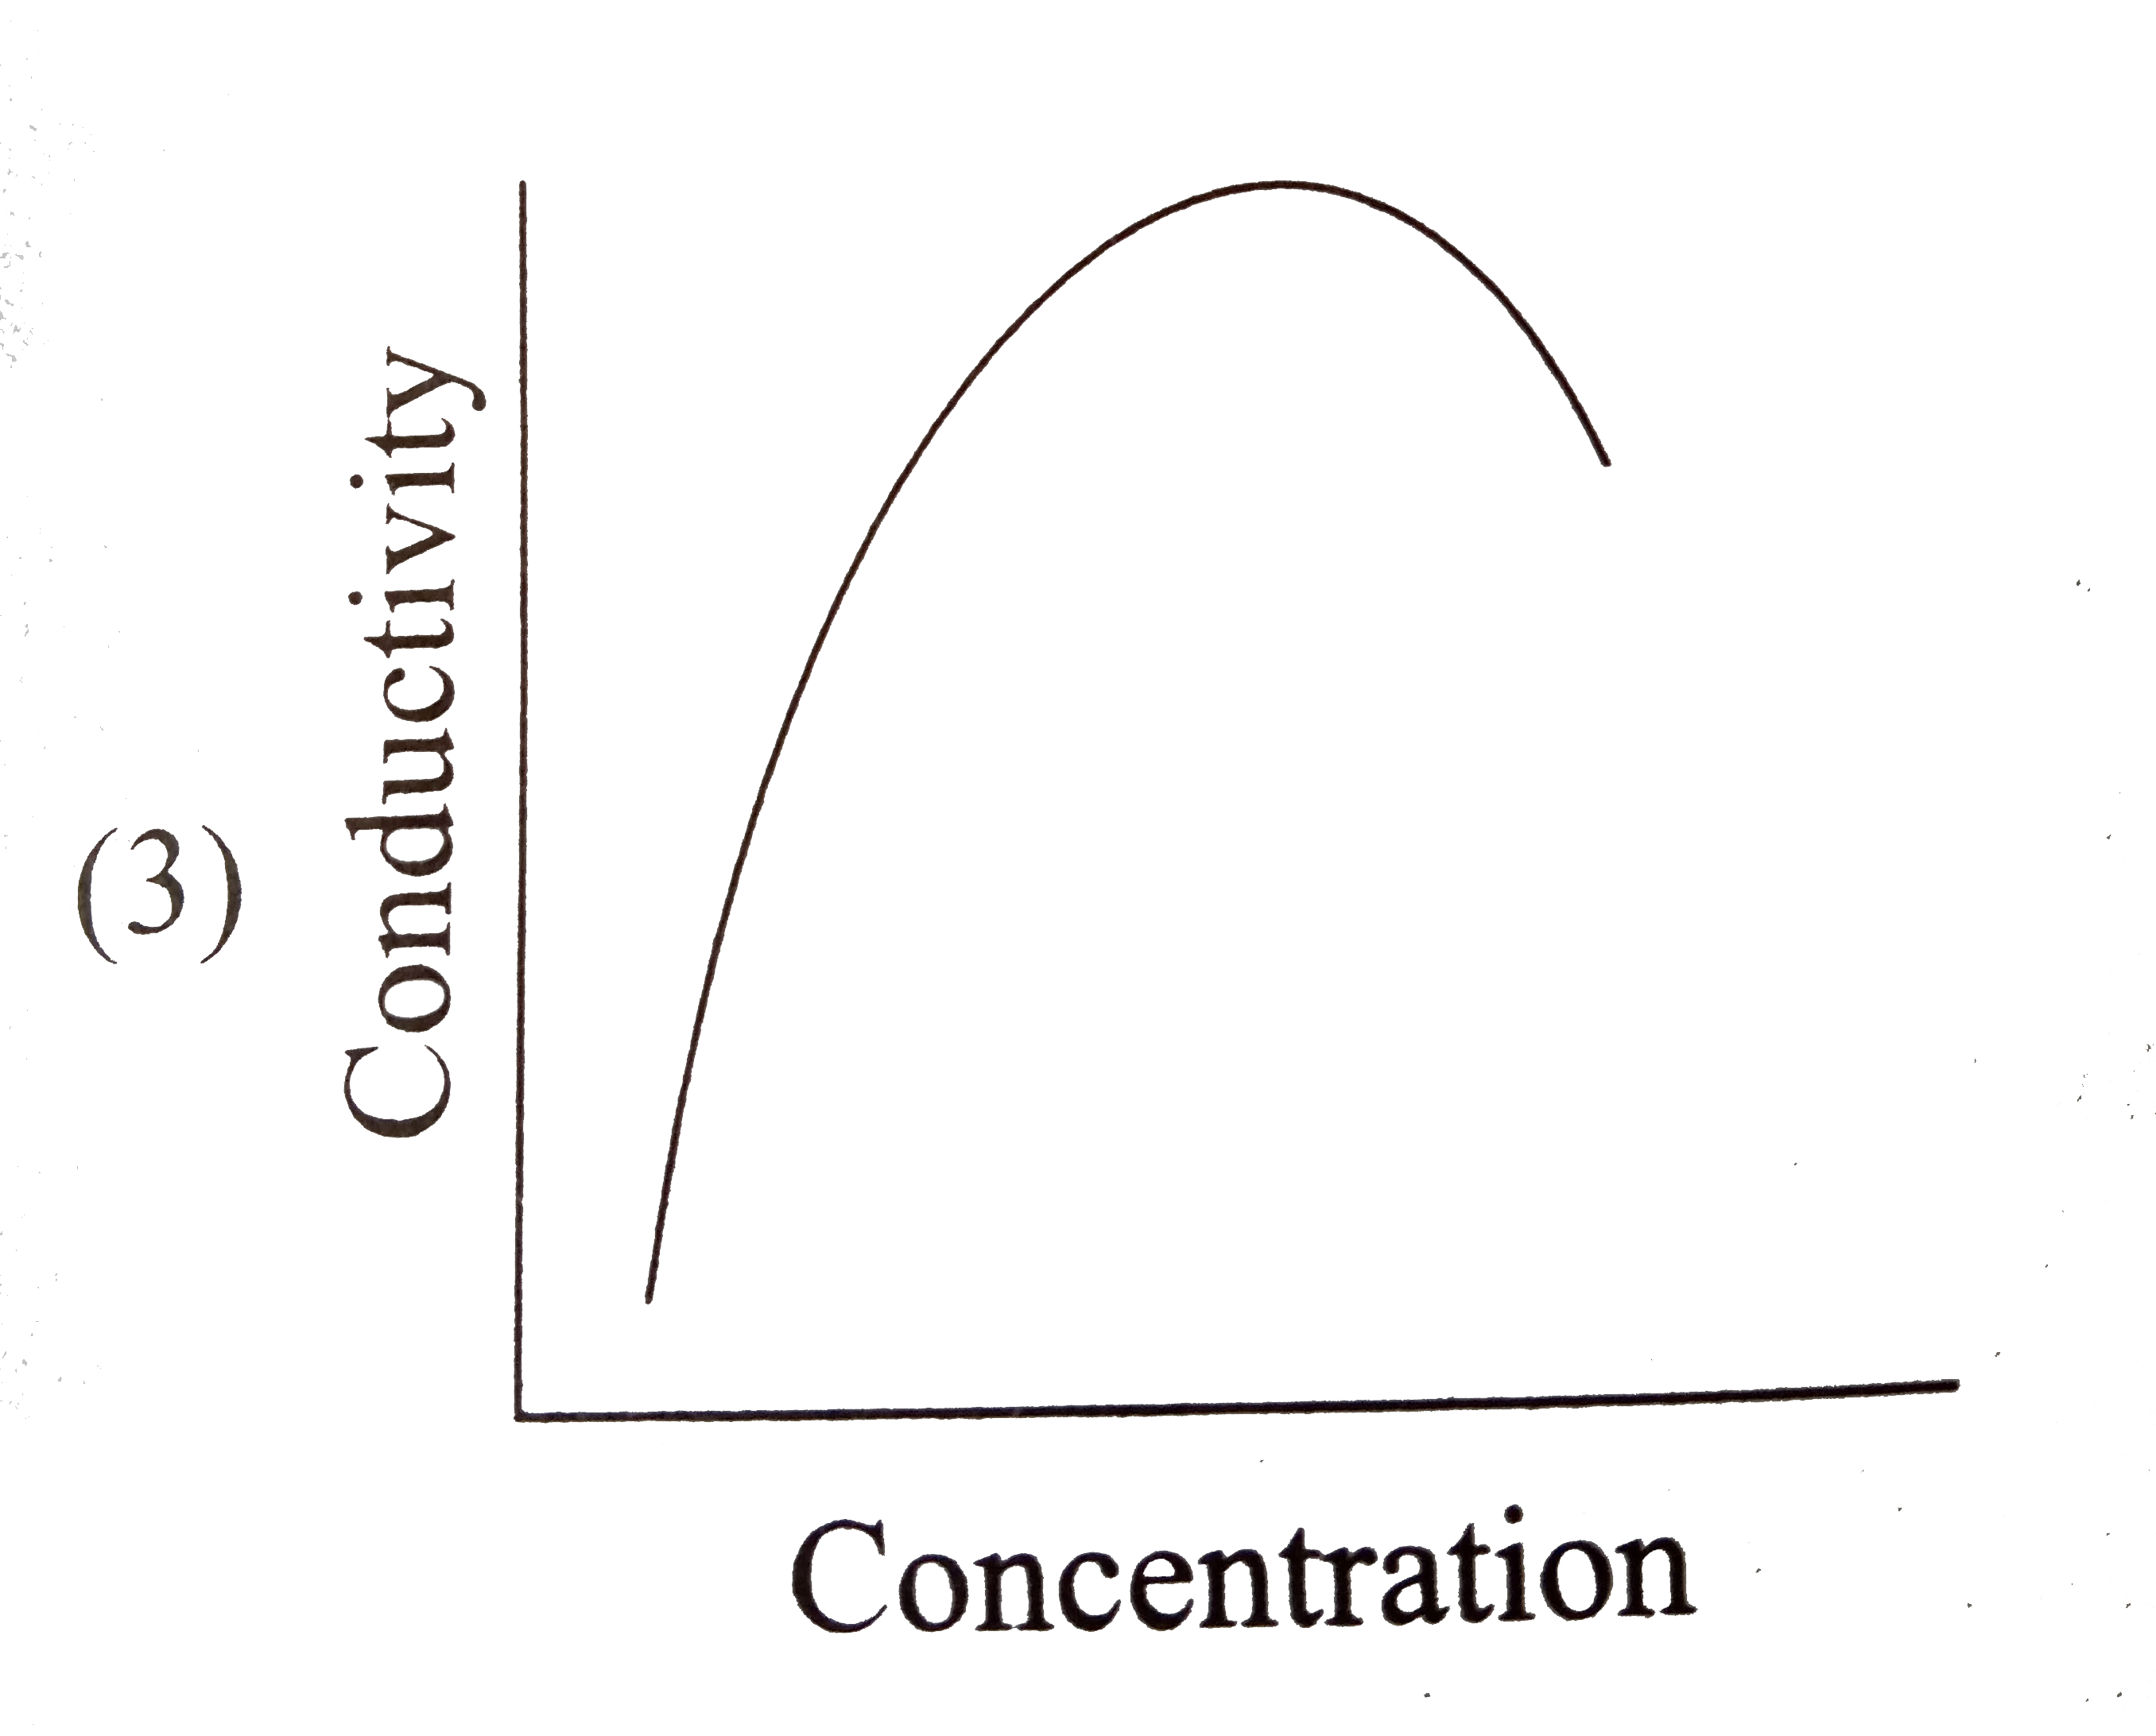 D
D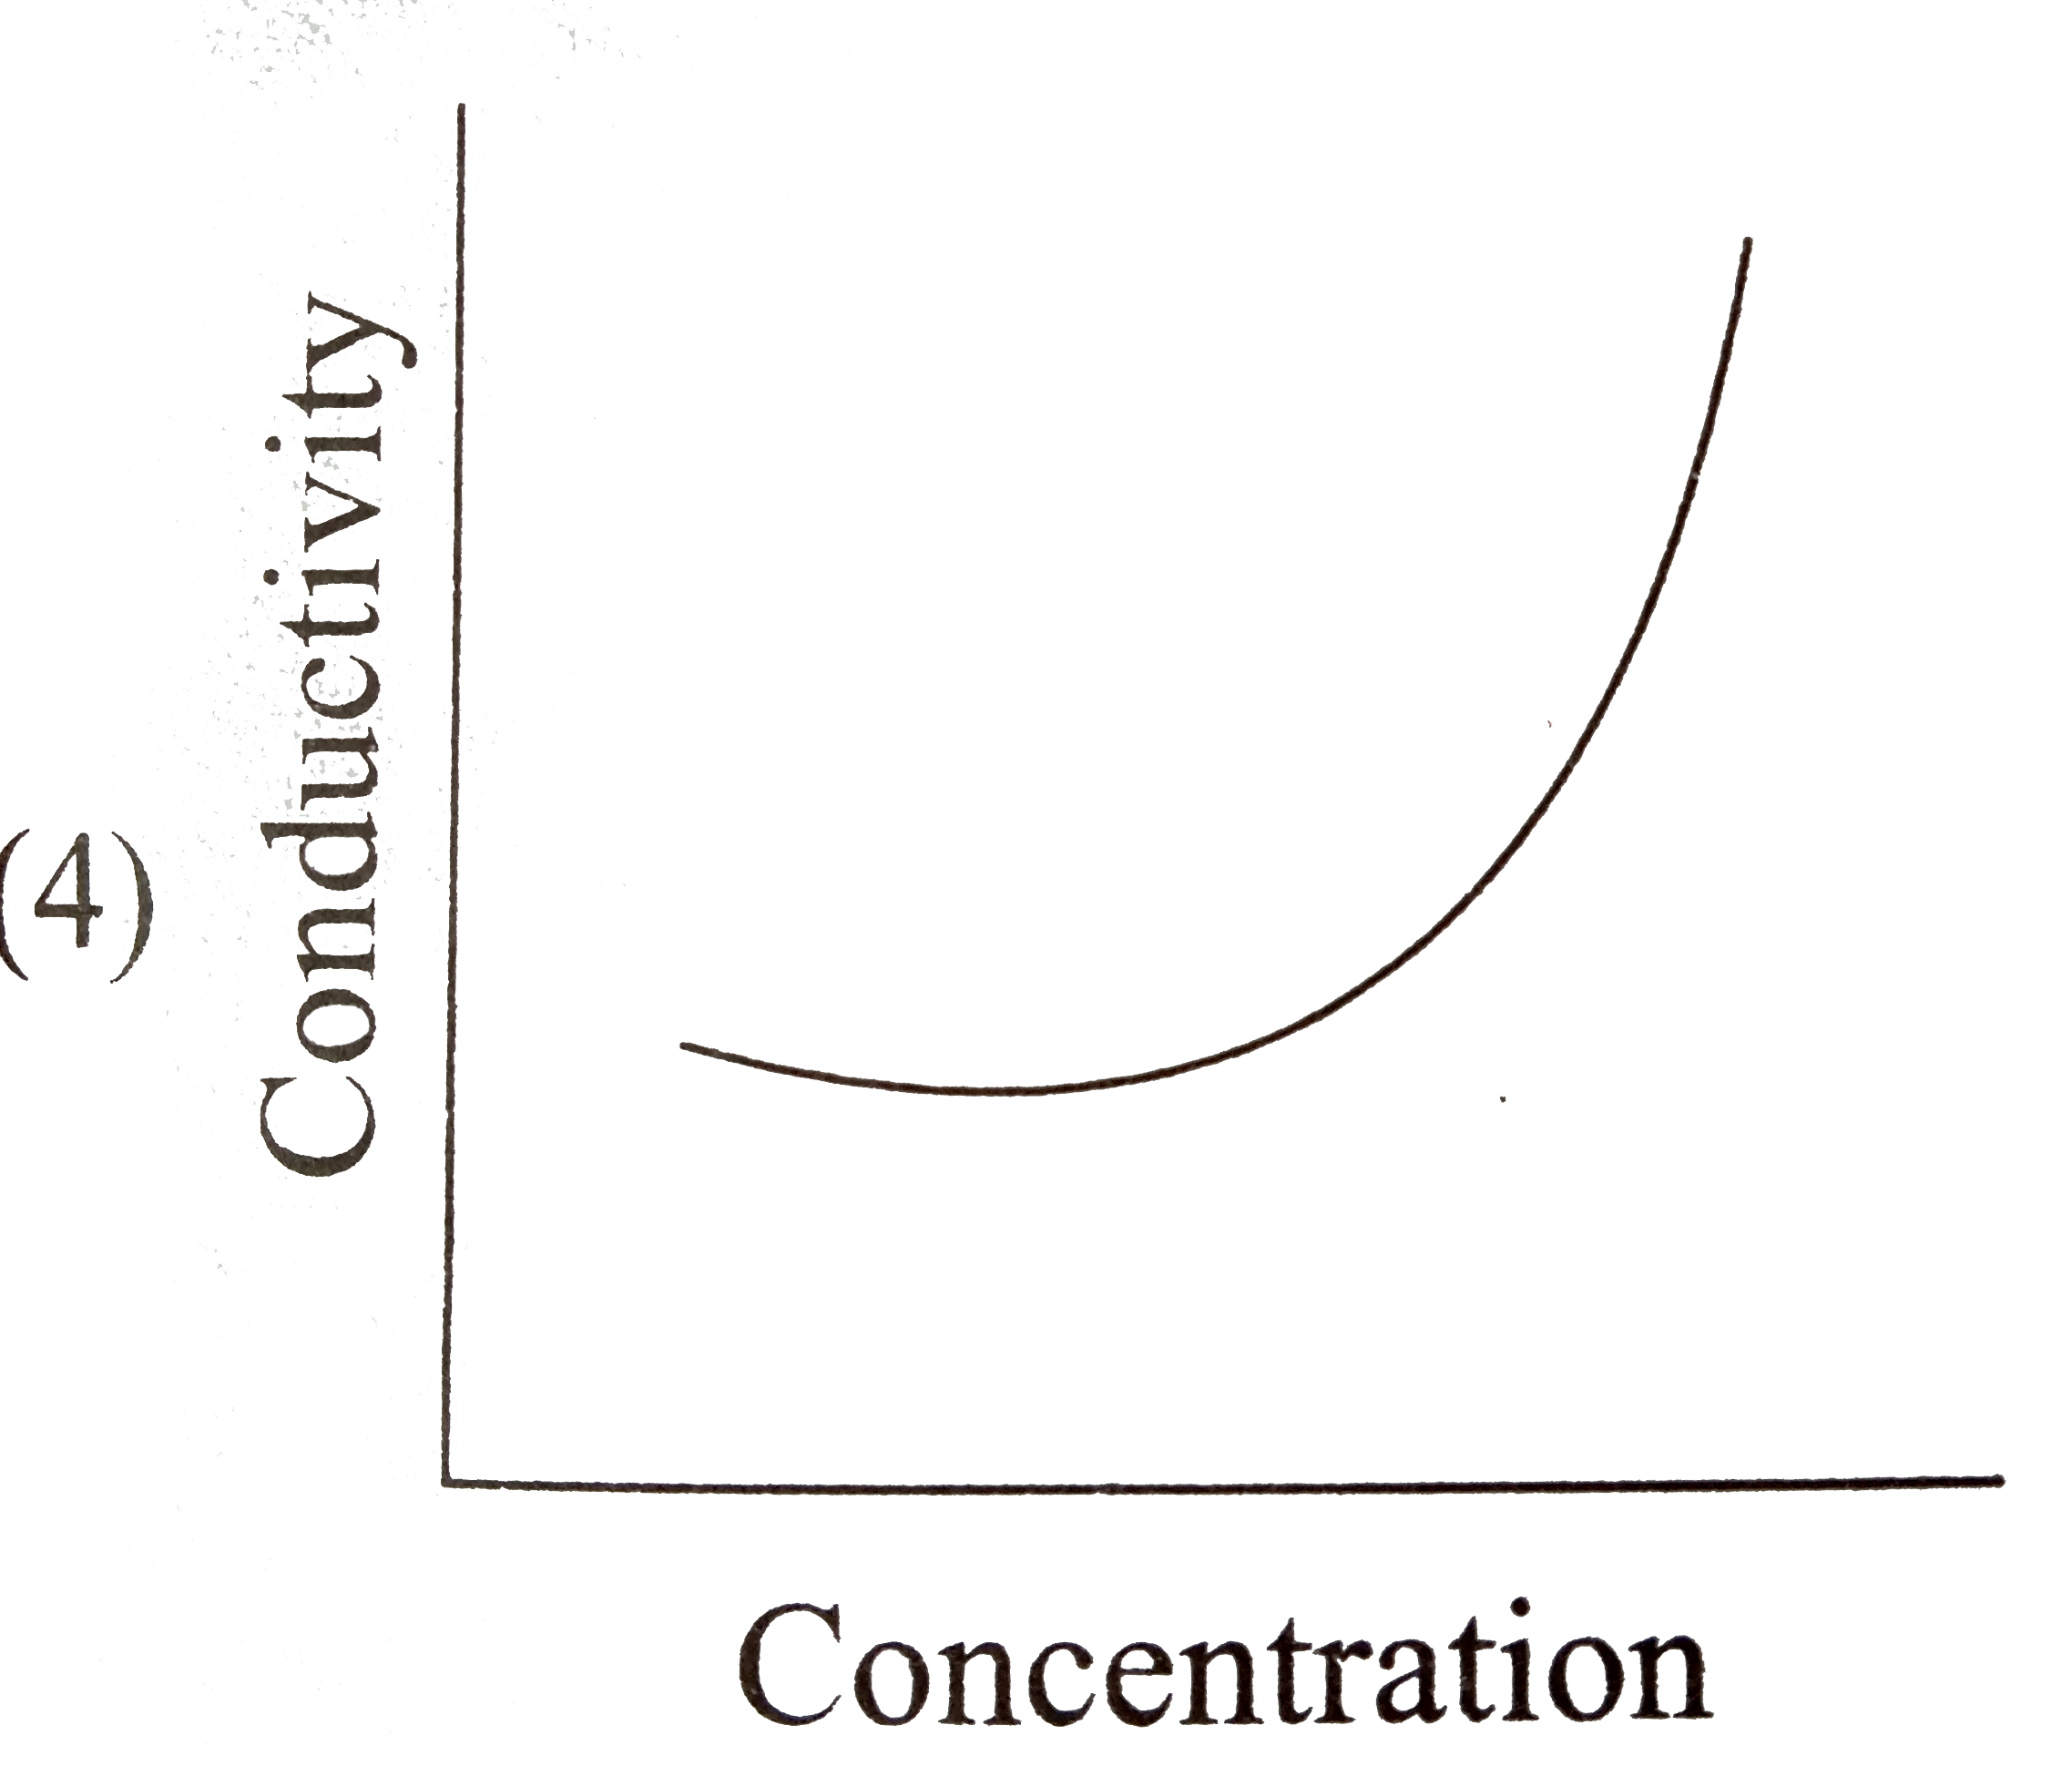
Which one of the following curves represents the graph pH during the titration of NaOH and HCl(aq)
A B
B C
C D
D
Which of the following curve represent variation of density of water with temperature best-
View SolutionWhich of the following curve gives the variation of Λm with √C for CH3COOH ?
View SolutionWhich of the following curve gives the variation of ∧∞m with √c for CH3COOH
View SolutionWhich of the following curve gives the variation of λm with √C for CH3COOH ?
View SolutionWhich of the following diagram correctly represent variation of pH of a solution of NH4OH by addition of increasing quantity (volume in ml) of a known HCl solution?
View Solution