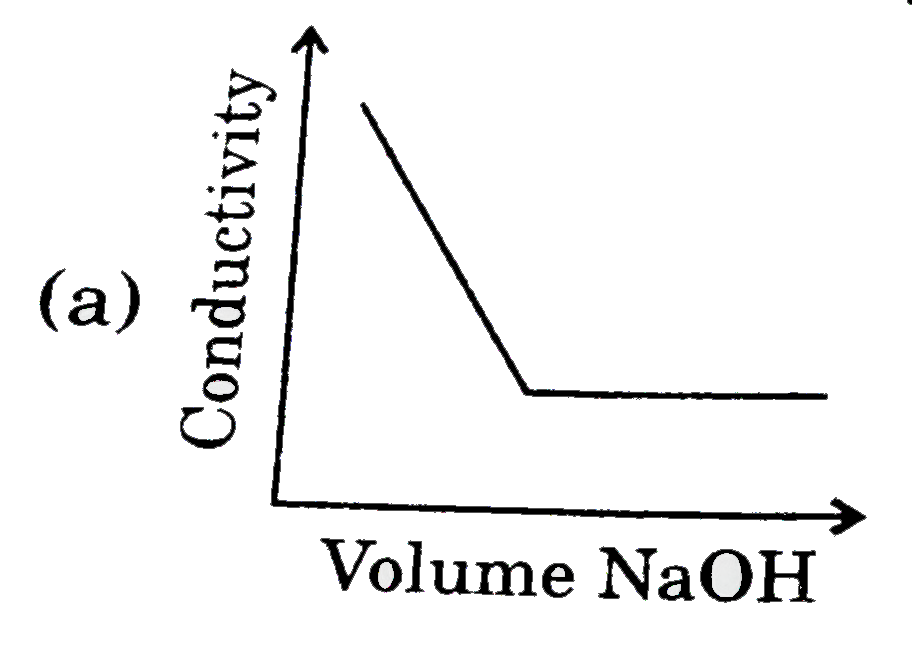
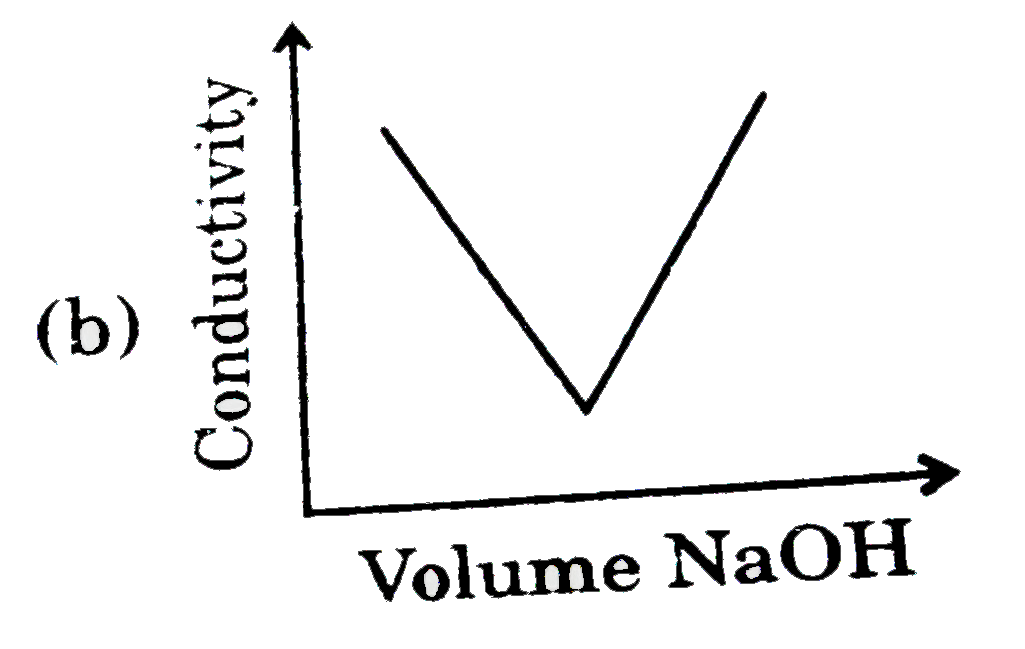
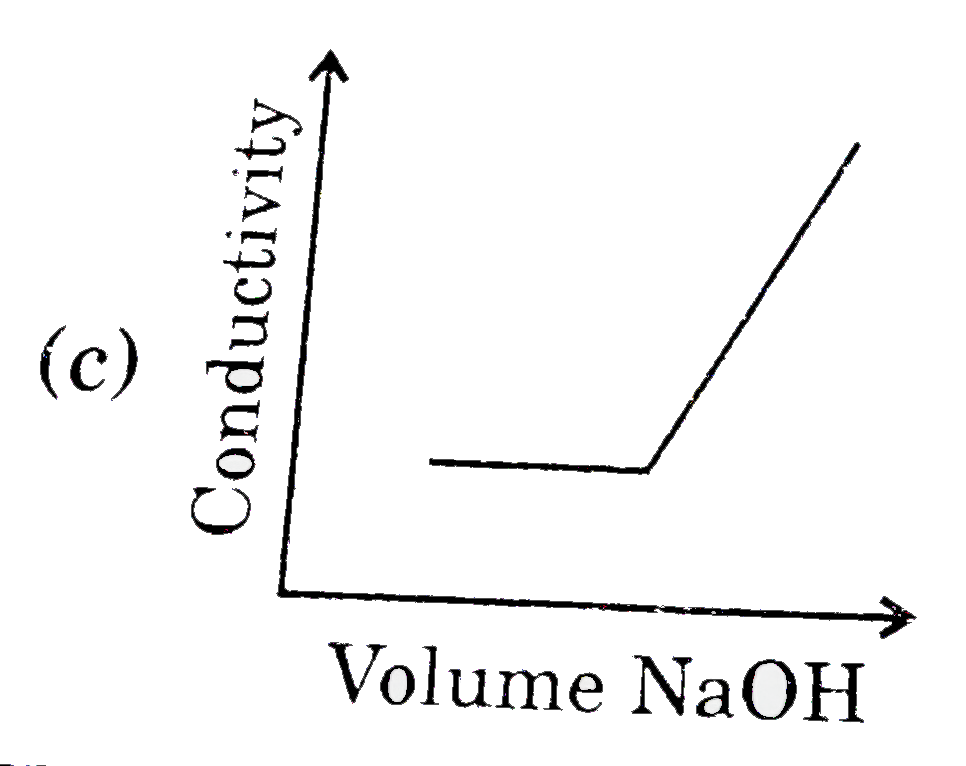
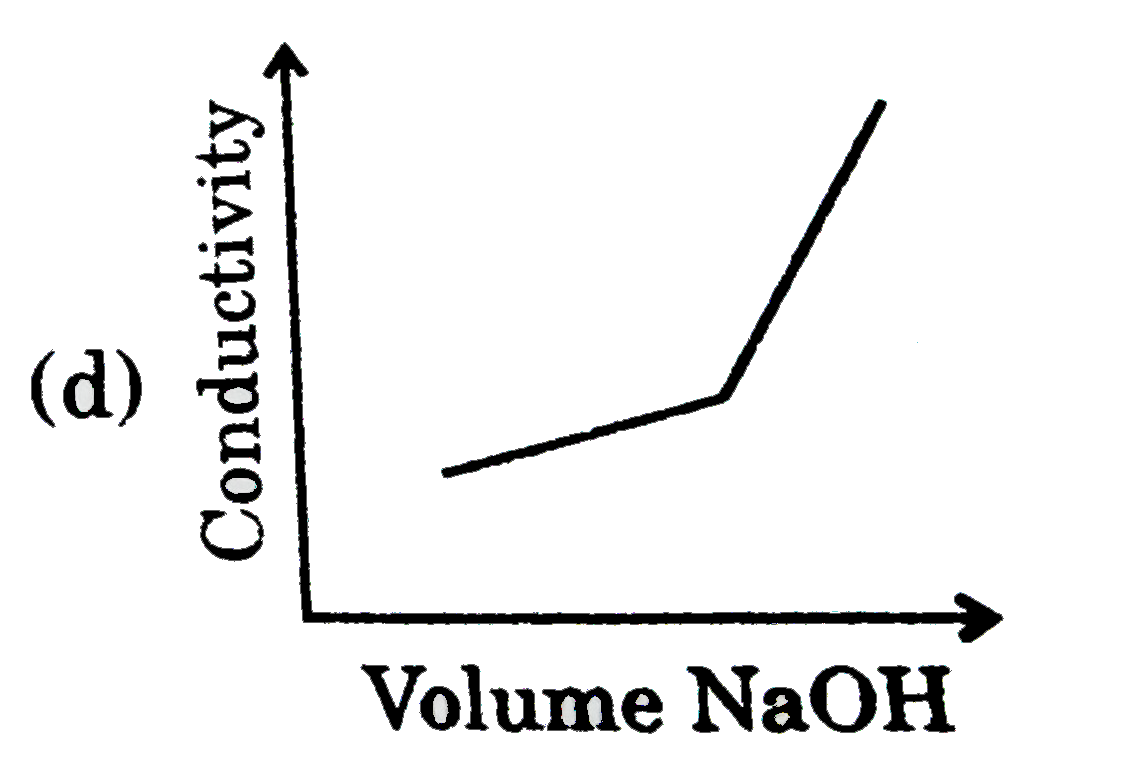
Which diagram best represents the change in electrical conductivity of a solution of acetic acid as a solution of sodium hydroxide is added?
A

B

C

D

Text Solution
The correct Answer is:D
|
Topper's Solved these Questions
- GRAPHICAL INTERPRETATIONBOOK - GRB PUBLICATIONCHAPTER - GRAPHICAL INTERPRETATIONEXERCISE - Multiple Objective Type
68 Videos
- GRAPHICAL INTERPRETATIONBOOK - GRB PUBLICATIONCHAPTER - GRAPHICAL INTERPRETATIONEXERCISE - Comprehension 1
1 Videos
- GRAPHICAL INTERPRETATIONBOOK - GRB PUBLICATIONCHAPTER - GRAPHICAL INTERPRETATIONEXERCISE - I.Electrochemistry
1 Videos
- F-BLOCK ELEMENTSBOOK - GRB PUBLICATIONCHAPTER - F-BLOCK ELEMENTSEXERCISE - Subjective type
7 Videos
- HYDROCARBON (ALIPHATIC)BOOK - GRB PUBLICATIONCHAPTER - HYDROCARBON (ALIPHATIC)EXERCISE - Previous years jee questions
28 Videos
Similar Questions
Knowledge Check
If NaOH is added to a solution of acetic acid
AH+ is ions increasesBpH decreasesC[CH3COO−] increases.D[CH3COOH] increases.In a solution of acetic acid, sodium acetate is added, then its pH value
ADecreasesBIncreasesCRemains unchangedD(a) and (b) both are correctWhen Al is added to sodium hydroxide solution:
Ano reaction takes placeBoxygen is evolvedCwater is producedDhydrogen is evolved
When Al is added to sodium hydroxide solution:
View SolutionName the product formed when acetic acid is treated with sodium hydroxide solution .
View Solutionwhat will happen when solution of sodium hydroxide is added to solution of sodium carbonate ?
View SolutionThe reaction of acetic acid and sodium hydroxide results in the formation of
View SolutionHydroxide of which metal is soluble in sodium hydroxide solution?
View Solution
