Which of the graphs shown below would best represent the changes when 0.10 M barium hydroxide was titrated with 0.10 M sulphuric acid?
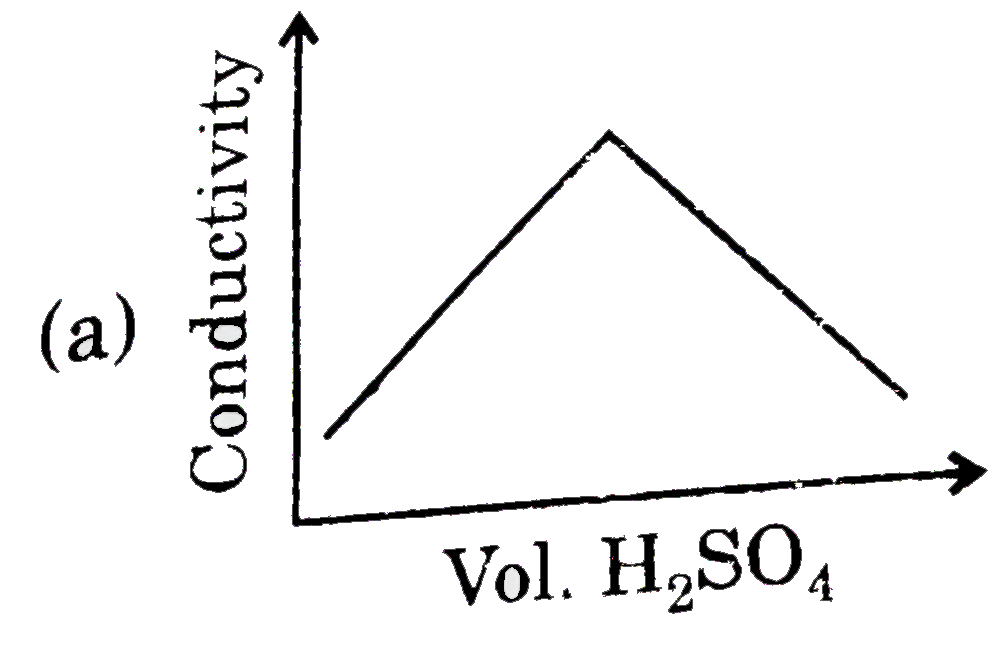
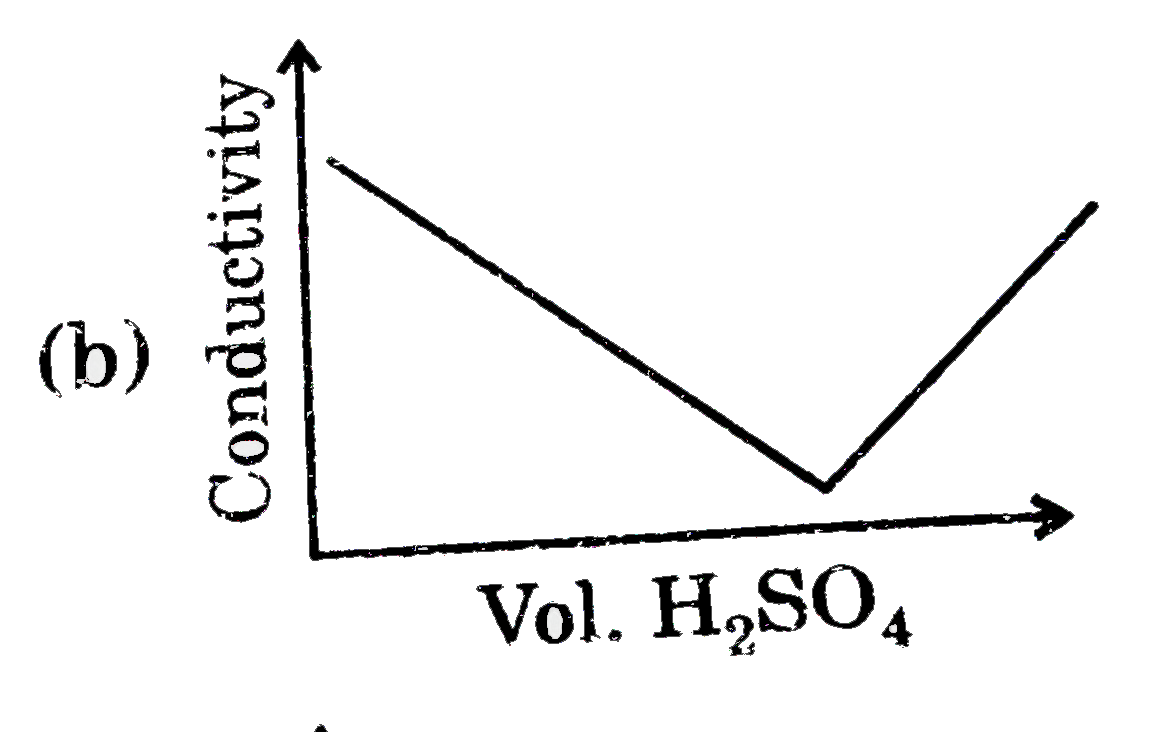
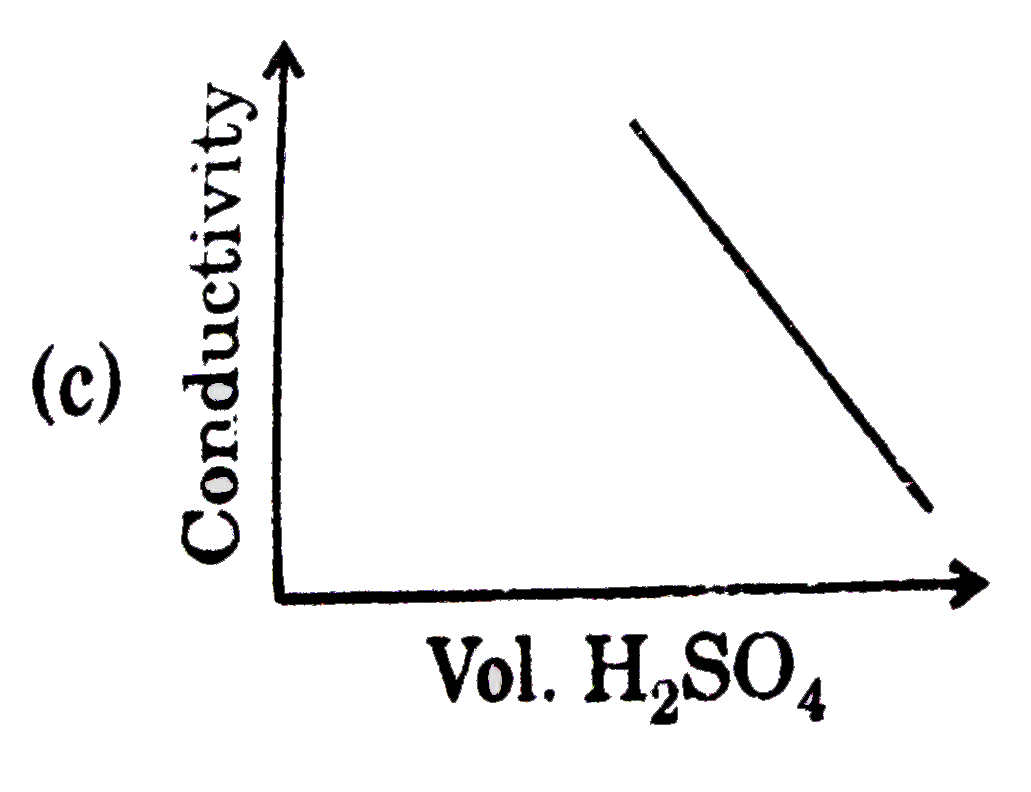
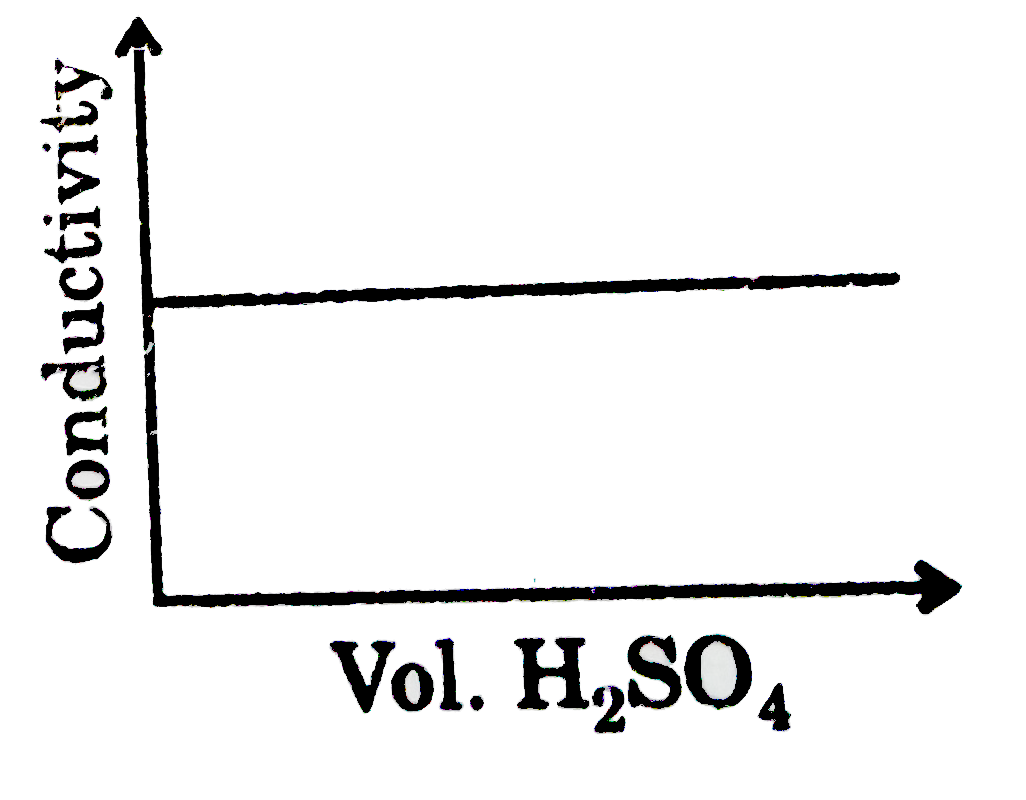
The correct Answer is:B
Topper's Solved these Questions
- GRAPHICAL INTERPRETATIONBOOK - GRB PUBLICATIONCHAPTER - GRAPHICAL INTERPRETATIONEXERCISE - Multiple Objective Type
68 Videos
- GRAPHICAL INTERPRETATIONBOOK - GRB PUBLICATIONCHAPTER - GRAPHICAL INTERPRETATIONEXERCISE - Comprehension 1
1 Videos
- GRAPHICAL INTERPRETATIONBOOK - GRB PUBLICATIONCHAPTER - GRAPHICAL INTERPRETATIONEXERCISE - I.Electrochemistry
1 Videos
- F-BLOCK ELEMENTSBOOK - GRB PUBLICATIONCHAPTER - F-BLOCK ELEMENTSEXERCISE - Subjective type
7 Videos
- HYDROCARBON (ALIPHATIC)BOOK - GRB PUBLICATIONCHAPTER - HYDROCARBON (ALIPHATIC)EXERCISE - Previous years jee questions
28 Videos
Similar Questions
Knowledge Check
What will be the pH of 0.05M barium hydroxide solution ?
A8B9C7D13Which of the graphs shown in the figure below best represents the relationship between the radioactive decay rare [−(dN/dt)] and population N?
A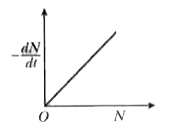 B
B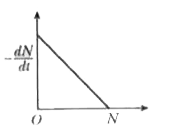 C
C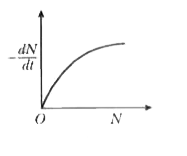 D
D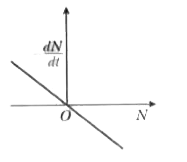
In the circuit shown, the switch is closed at time t = 0.
Which of the graphs shown below best represents the voltage across the inductor, as seen on an oscilloscope ?
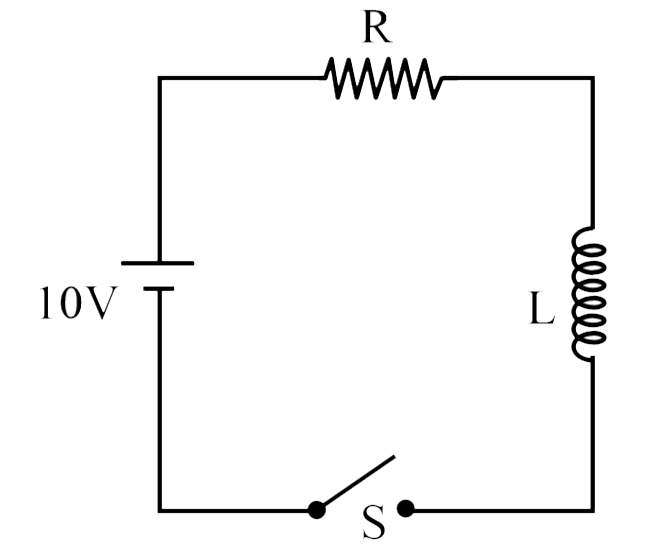
 AIBIICIIIDIV
How much gas (in litres) will be produced at 0∘C and 760 m m of pressure when 10 g of oxalic acid was heated with concentrated sulphuric acid ?
View SolutionCalculate the pH at equivalence point when a solution of 0.10M acetic acid is titrated with a solution of 0.10 M hydroxide
(Ka for acetic acid is 1.9×10⁻⁵)
View SolutionIn an experiment to determine the enthalpy of neutralisation of sodium hydroxide with sulphuric acid, 50cm3 of 0.4M sodium hydroxide were titreated thermometrically with 0.25M sulphuric acid. Which of the following plots gives the correct representation ?
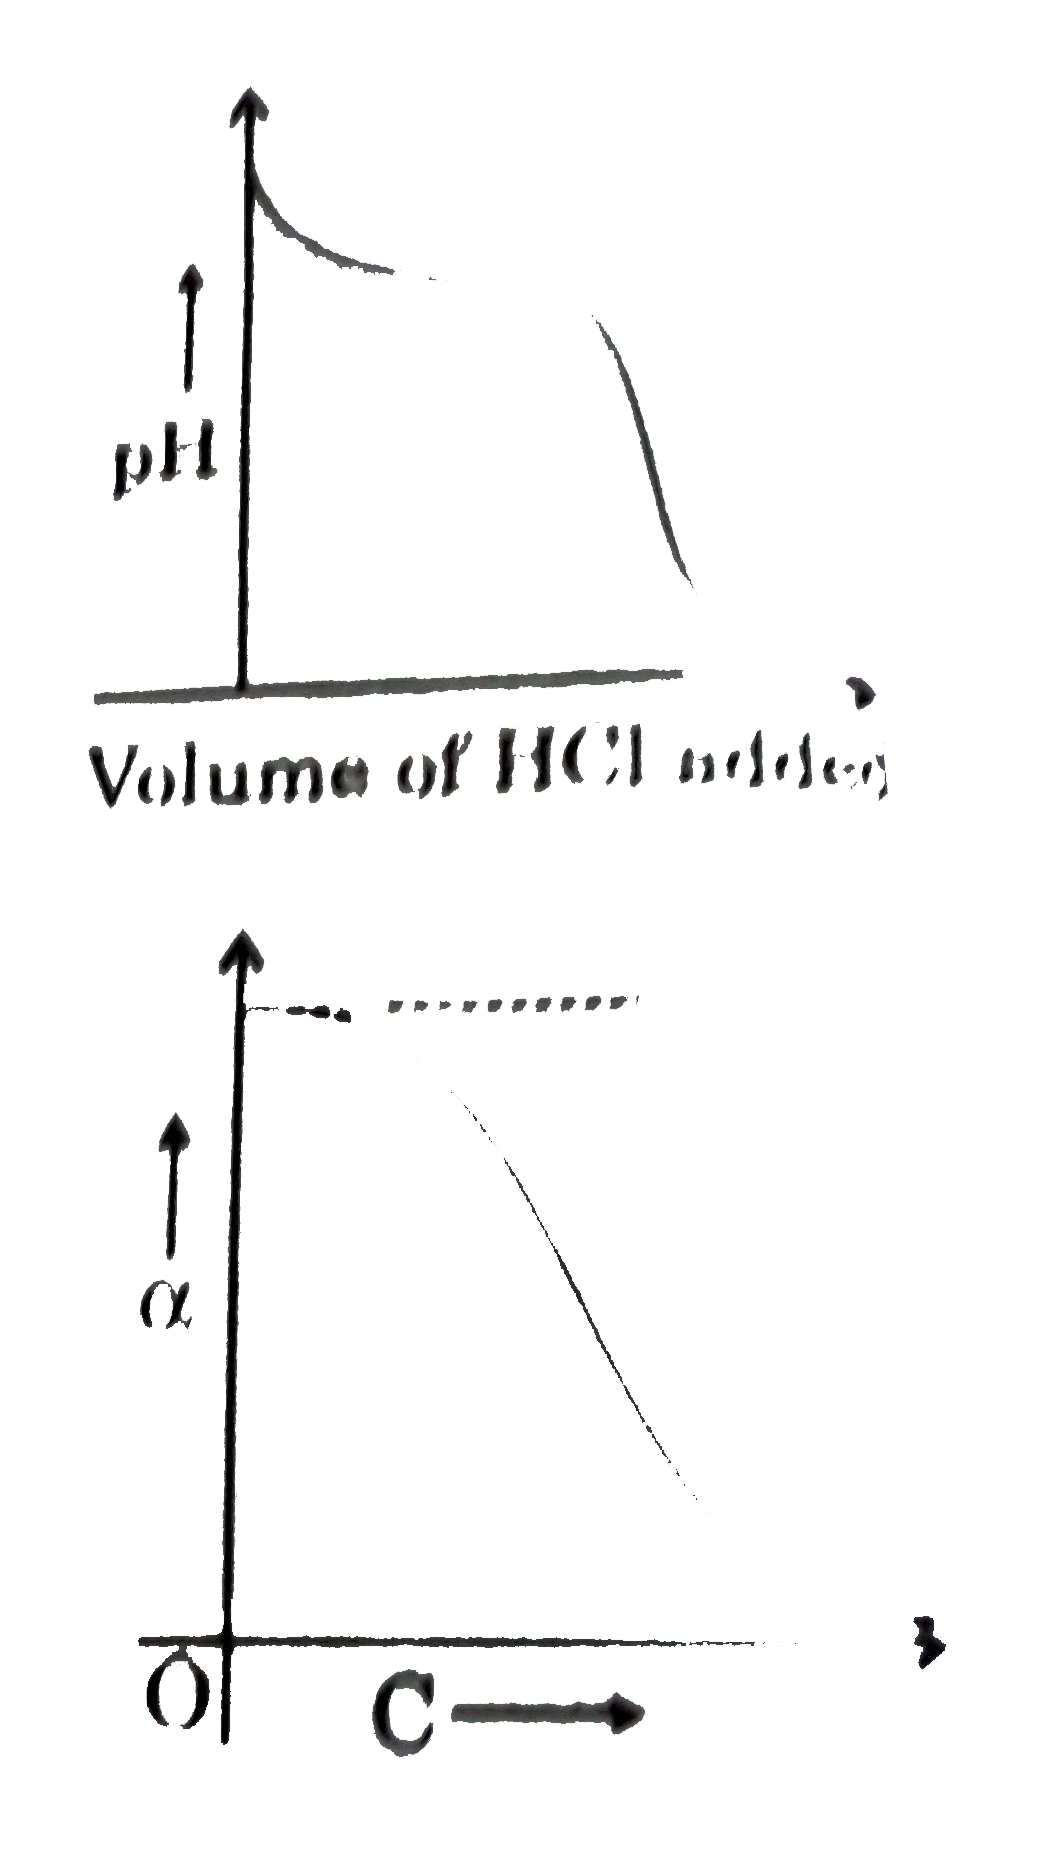
View Solution(a)When 100 ml of 0.1M NaCN solution is titrated with 0.1 M HCl solution the variation of pH of solution with volume of HCl added will be :
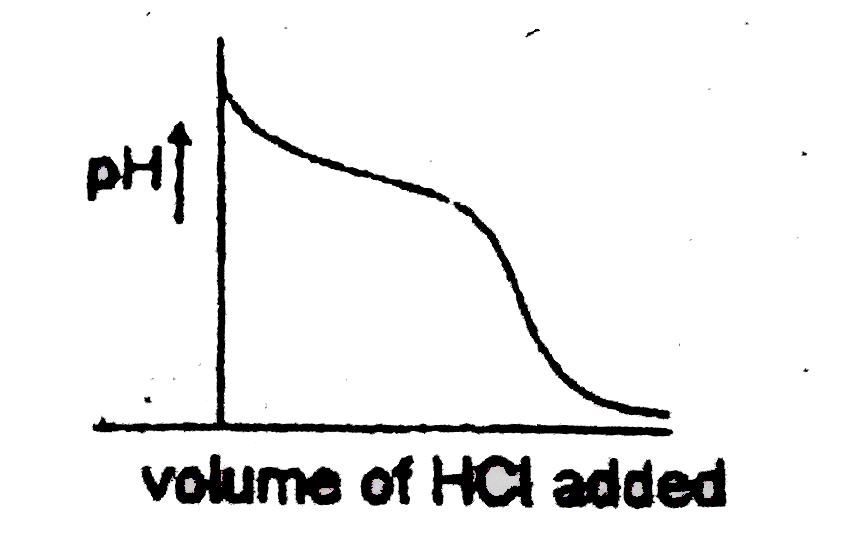
(b)Variation of degree of dissociation α with concentration for a weak electrolyte at a particular temperature is best represented by :
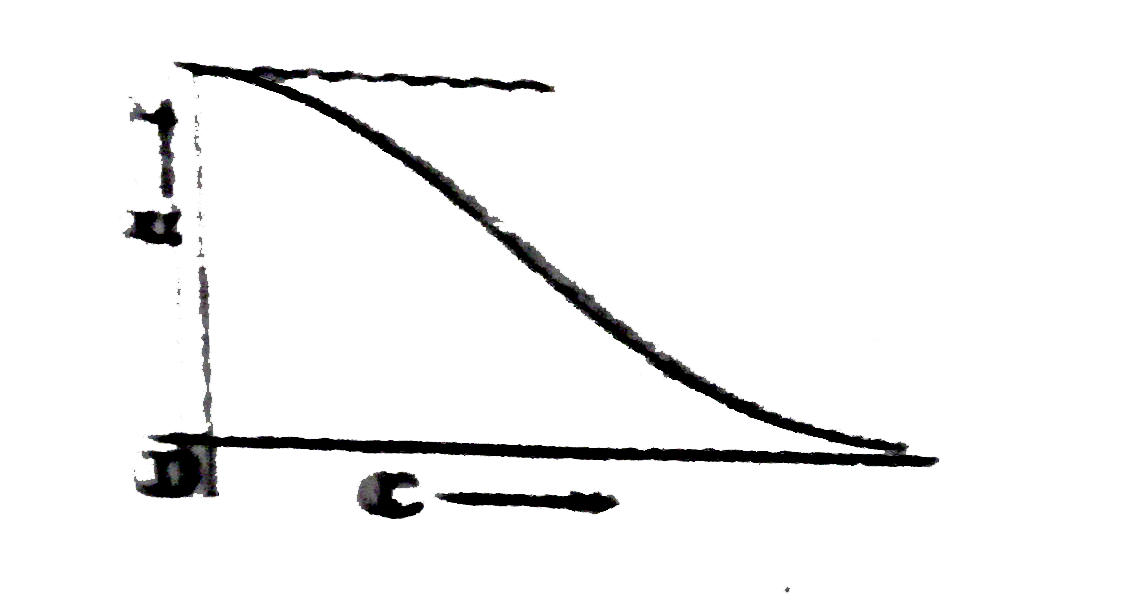
( c)0.1 M acetic acid solution is titrated against 0.1 M NaOH solution. The difference in pH between 1/4 and 3/4 stages of neutralization of acid will be 2 log 3.
View SolutionWhich is/are correct statement ?
(P) When 100 mL of 0.1MNaCN solution is titrated with 0.1MHCI solution the variation of pH of solution with volume added will be (as shown in fig.)
(Q) Variation of degree of dissociation α with concentration for a weak electrolyte at a particular temperature is best represented by (as shown in fig.)
(R) 0.1M acetic acid solution is titrated aganist 0.1MNaOH solution. the difference in pH between 1/4 and 3/4 stages of neutralization of acid will be 2 log 3.
View Solution

