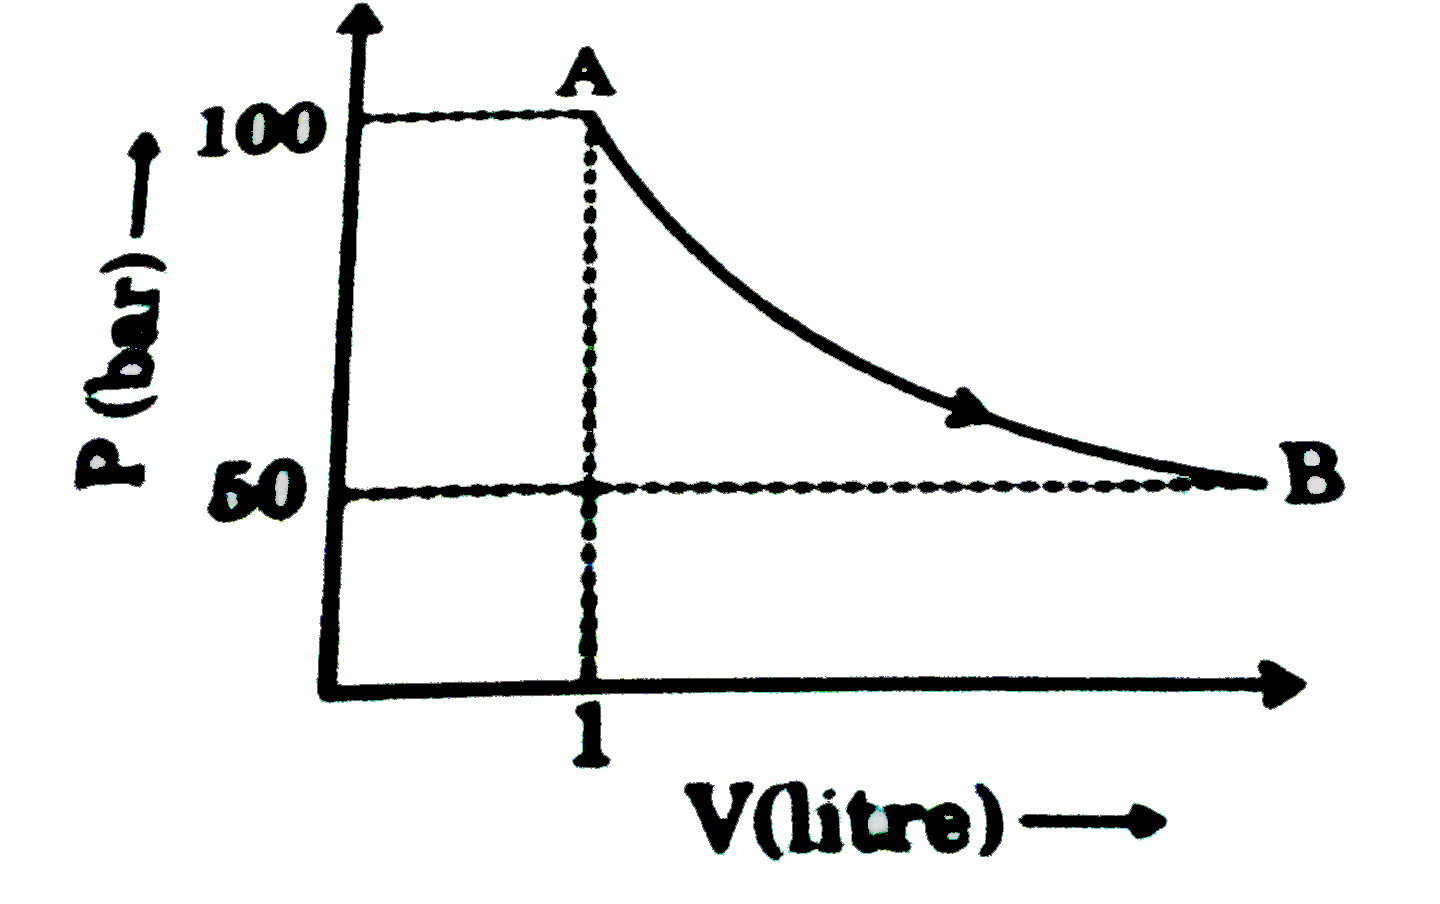
Calculate ΔG (in L atm) from the graph of an ideal gas undergoing process AB. [Take: ln 2 = 0.7]
![Calculate DeltaG (in L atm) from the graph of an ideal gas undergoing process AB. [Take: ln 2 = 0.7]](https://d10lpgp6xz60nq.cloudfront.net/physics_images/GRB_PHY_CHM_P2_V03_QB_C13_E01_423_Q01.png)
The correct Answer is:14
Step by step video, text & image solution for Calculate DeltaG (in L atm) from the graph of an ideal gas undergoing process AB. [Take: ln 2 = 0.7] by Chemistry experts to help you in doubts & scoring excellent marks in Class 12 exams.
Topper's Solved these Questions
- BOOK - GRB PUBLICATIONCHAPTER - GRAPHICAL INTERPRETATIONEXERCISE - Match The Column Type15videos
GRAPHICAL INTERPRETATION
- BOOK - GRB PUBLICATIONCHAPTER - F-BLOCK ELEMENTSEXERCISE - Subjective type7videos
F-BLOCK ELEMENTS
- BOOK - GRB PUBLICATIONCHAPTER - HYDROCARBON (ALIPHATIC)EXERCISE - Previous years jee questions28videos
HYDROCARBON (ALIPHATIC)
Similar Questions
Calculate ΔH (in atm-litre) for a real gas undergoing a change from (10 L, 20 atm) to (50 L,40 atm)
Given : (∂H∂P)v=10litre,(∂H∂V)=5atmView SolutionCalculate magnitude of ΔH in calorie for 1 mol of an ideal gas undergoing adiabatic reversible process from 8 atm, 300 K to 2 atm. (Given : γ=2,R=2Cal/K/mol)
View Solution
Knowledge Check
- Question 1 - Select One or More
During the process AB of an ideal gas
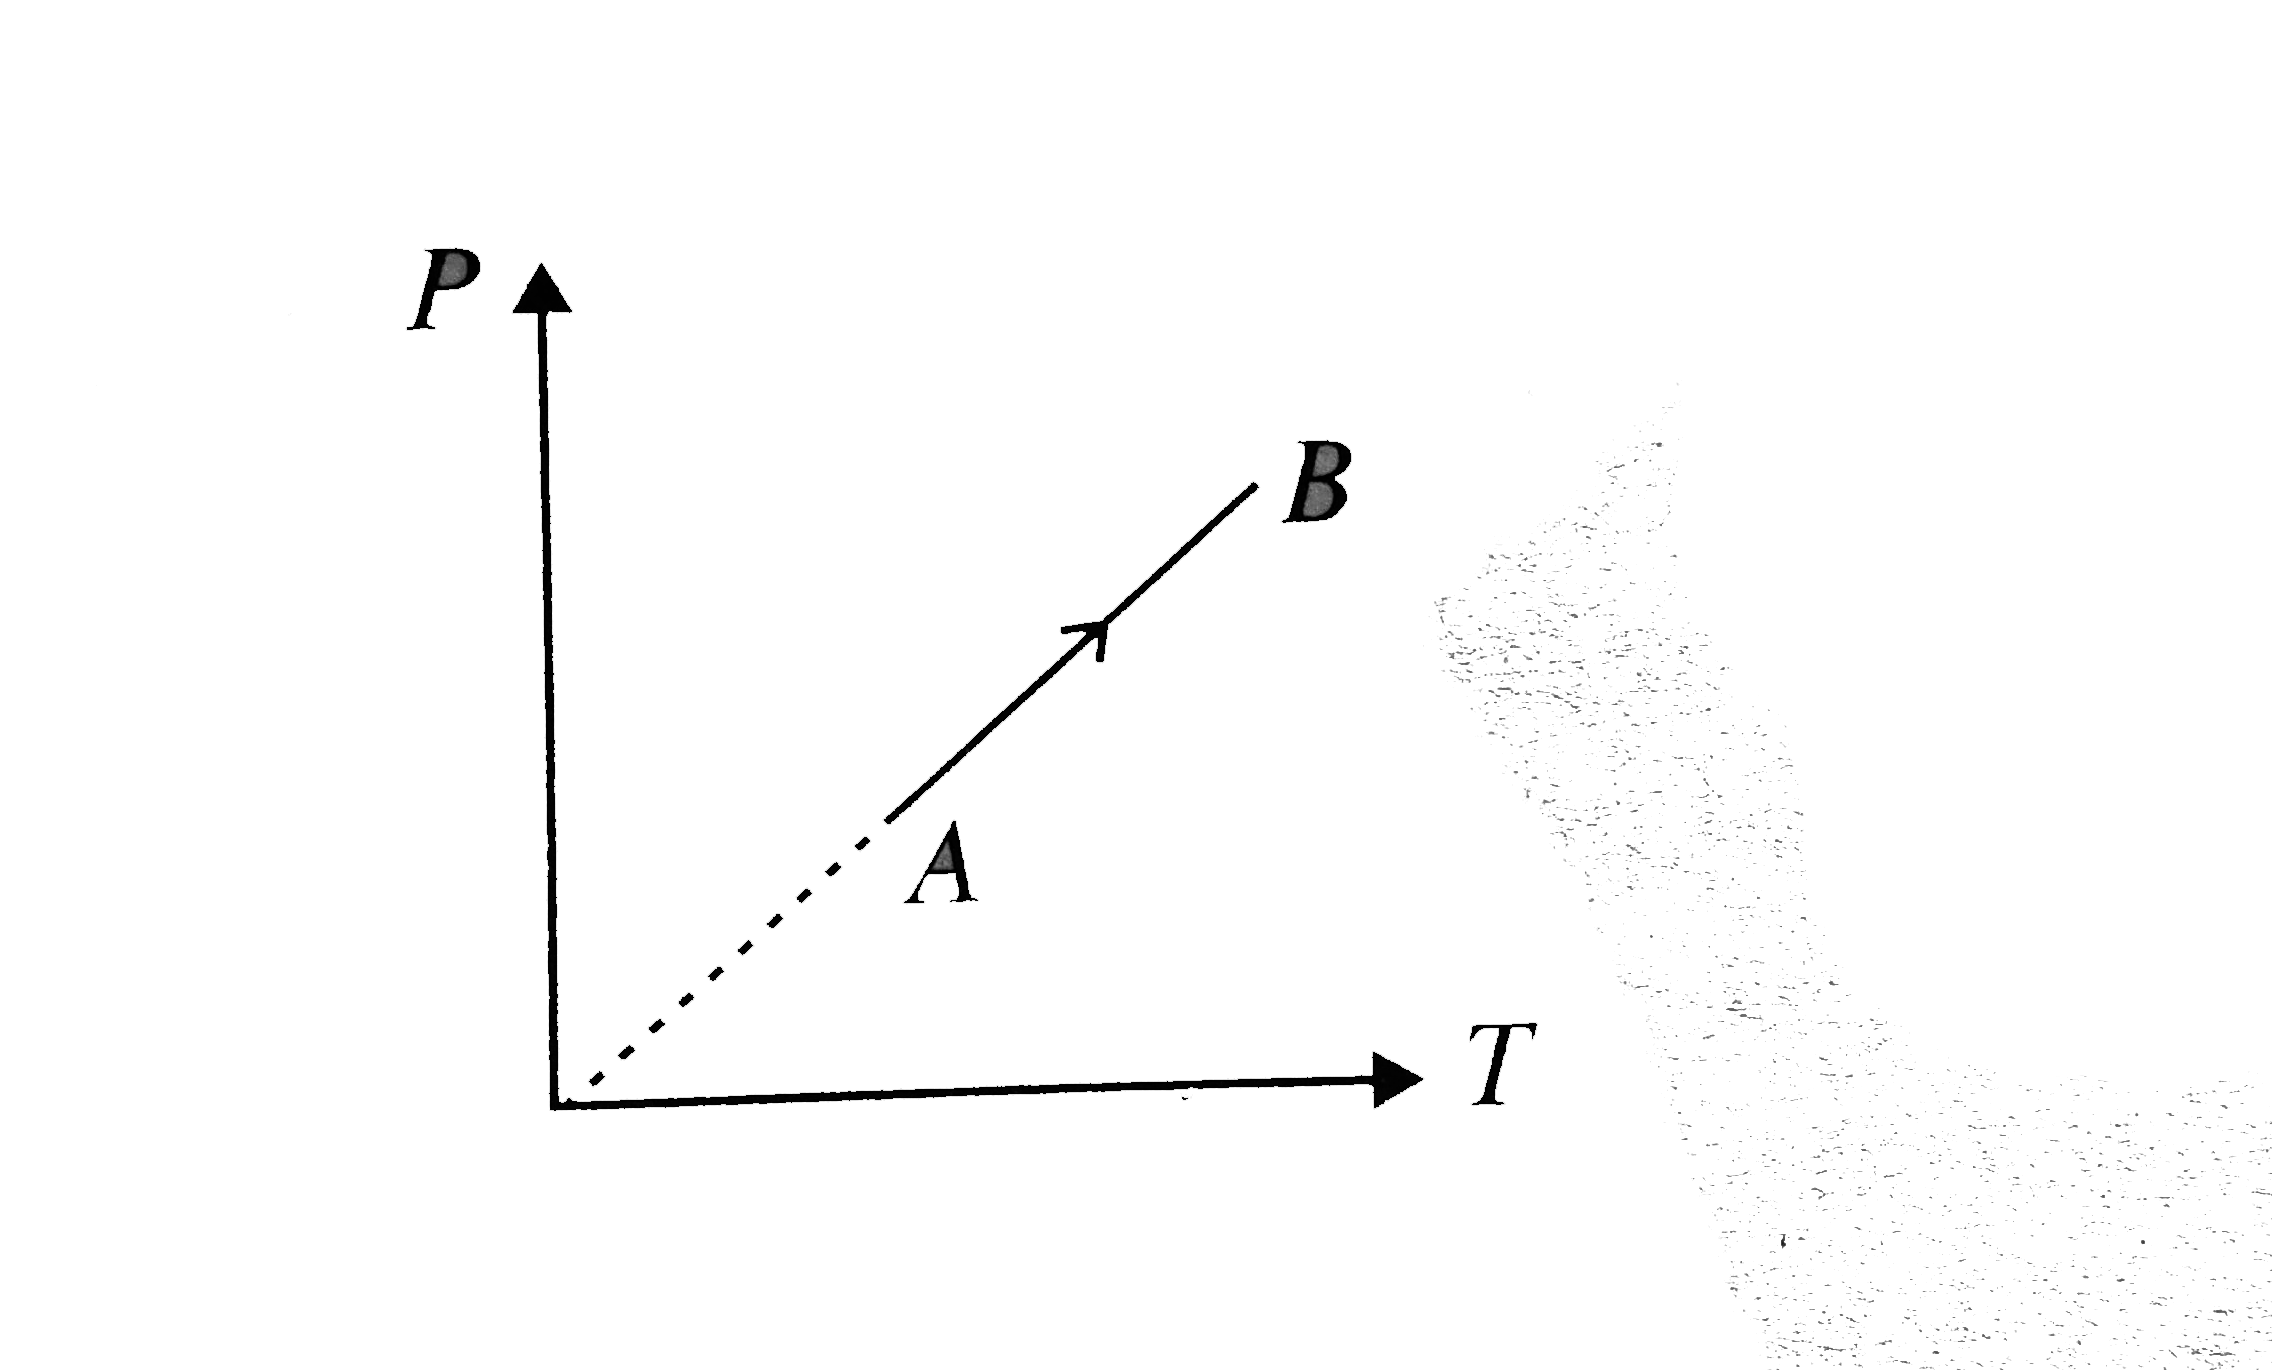 Awork done on the gas is zeroBdensity of the gas is constantCslope of line AB from the T-axis is inversely proportional to the number of moles of the gasDslope of line AB from the T-axis is directly proportional to the number of moles of the gas
 - Question 2 - Select One
A monoatomic ideal gas undergoes a process ABC. The heat given to the gas is
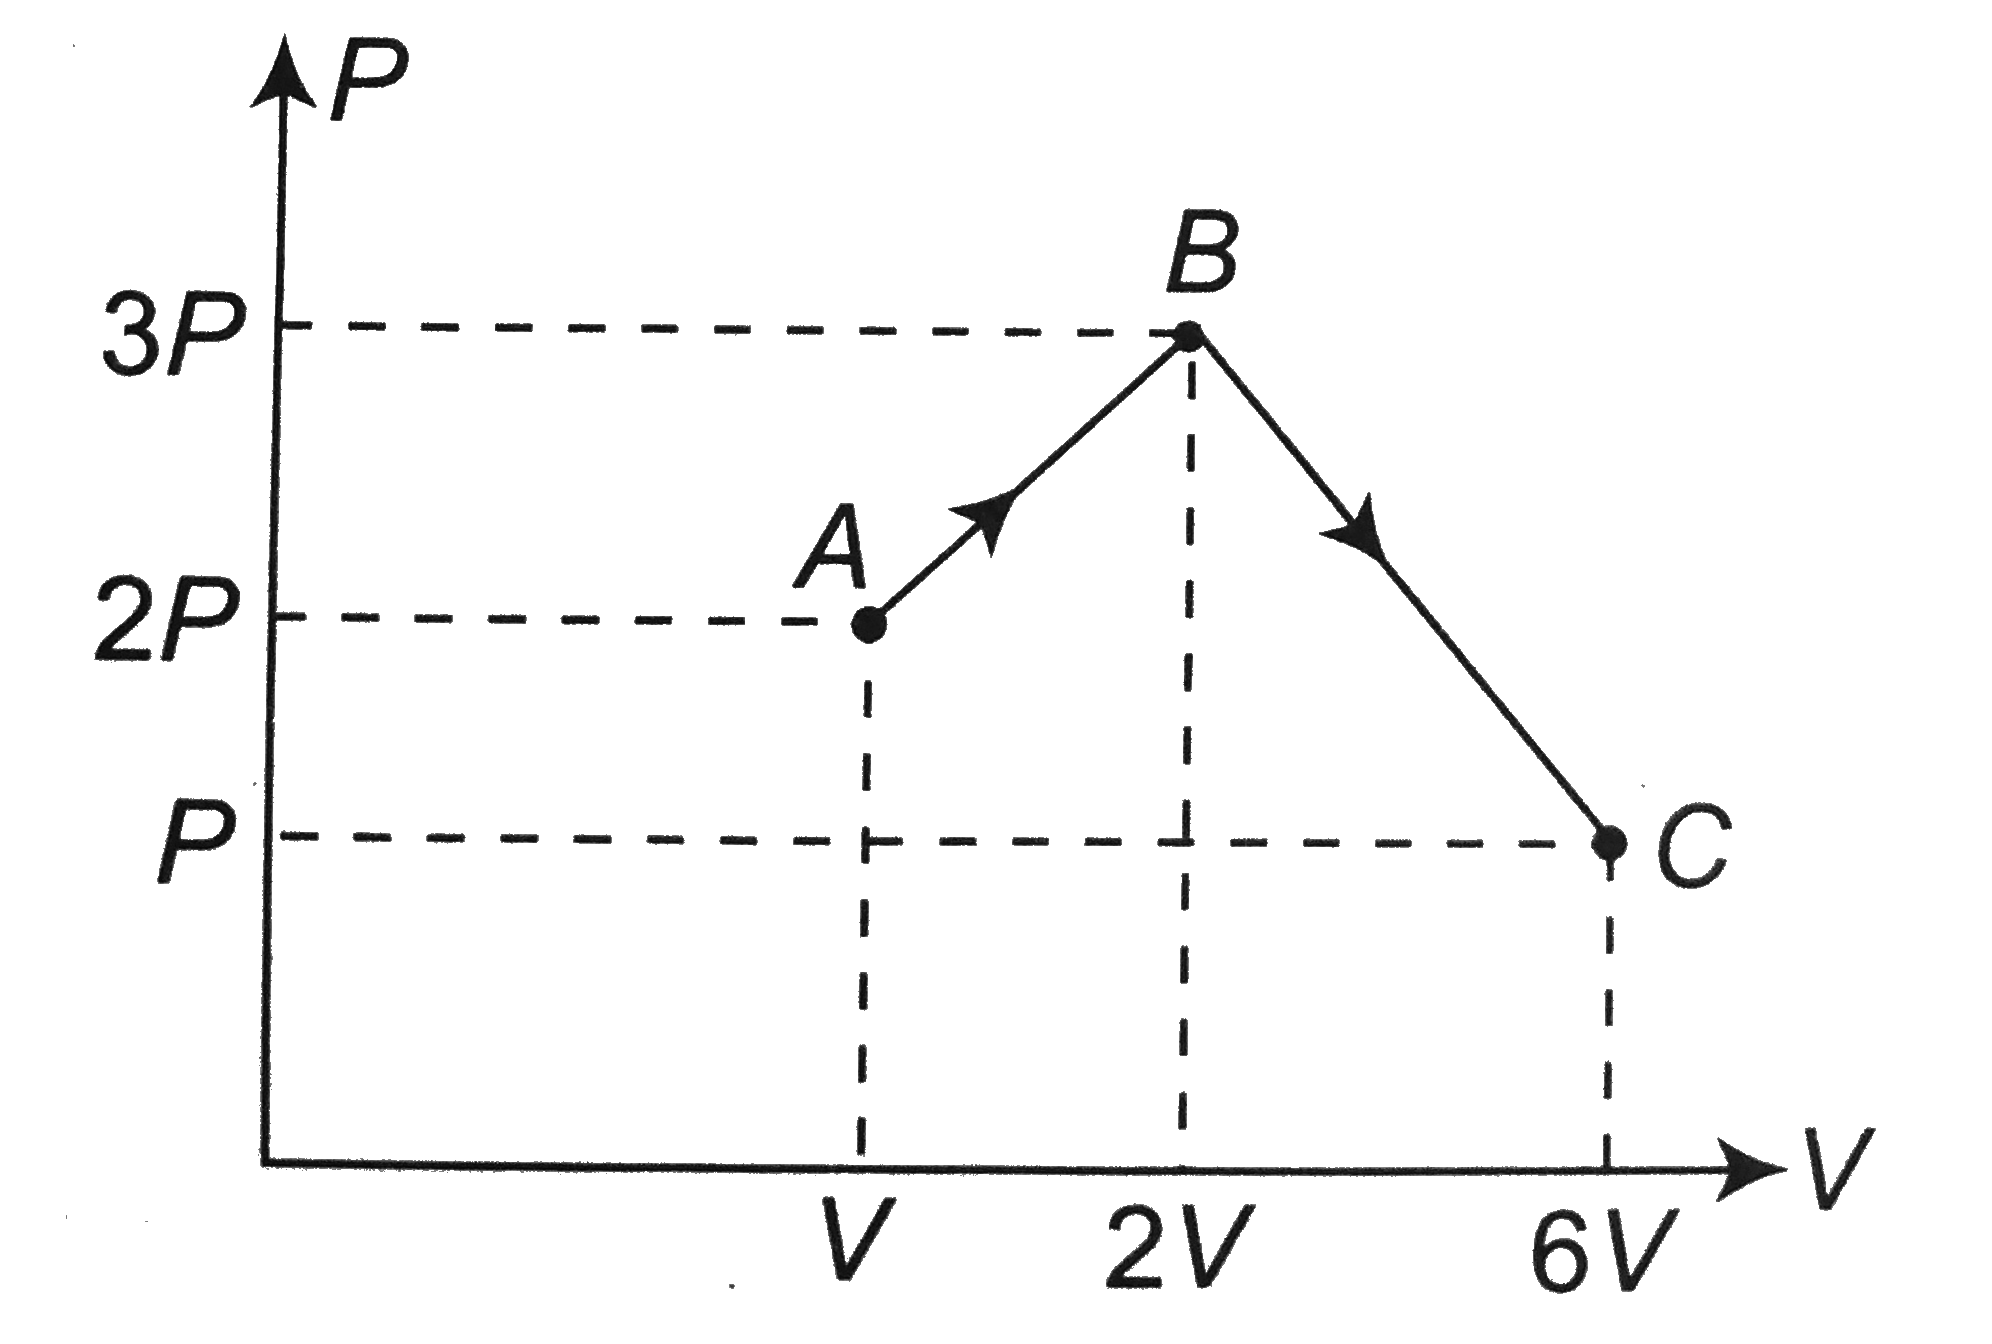 A7.5PVB12.5PVC16.5PVD20.5PV
 - Question 3 - Select One or More
An ideal gas undergoes the cyclic process shown in a graph below :
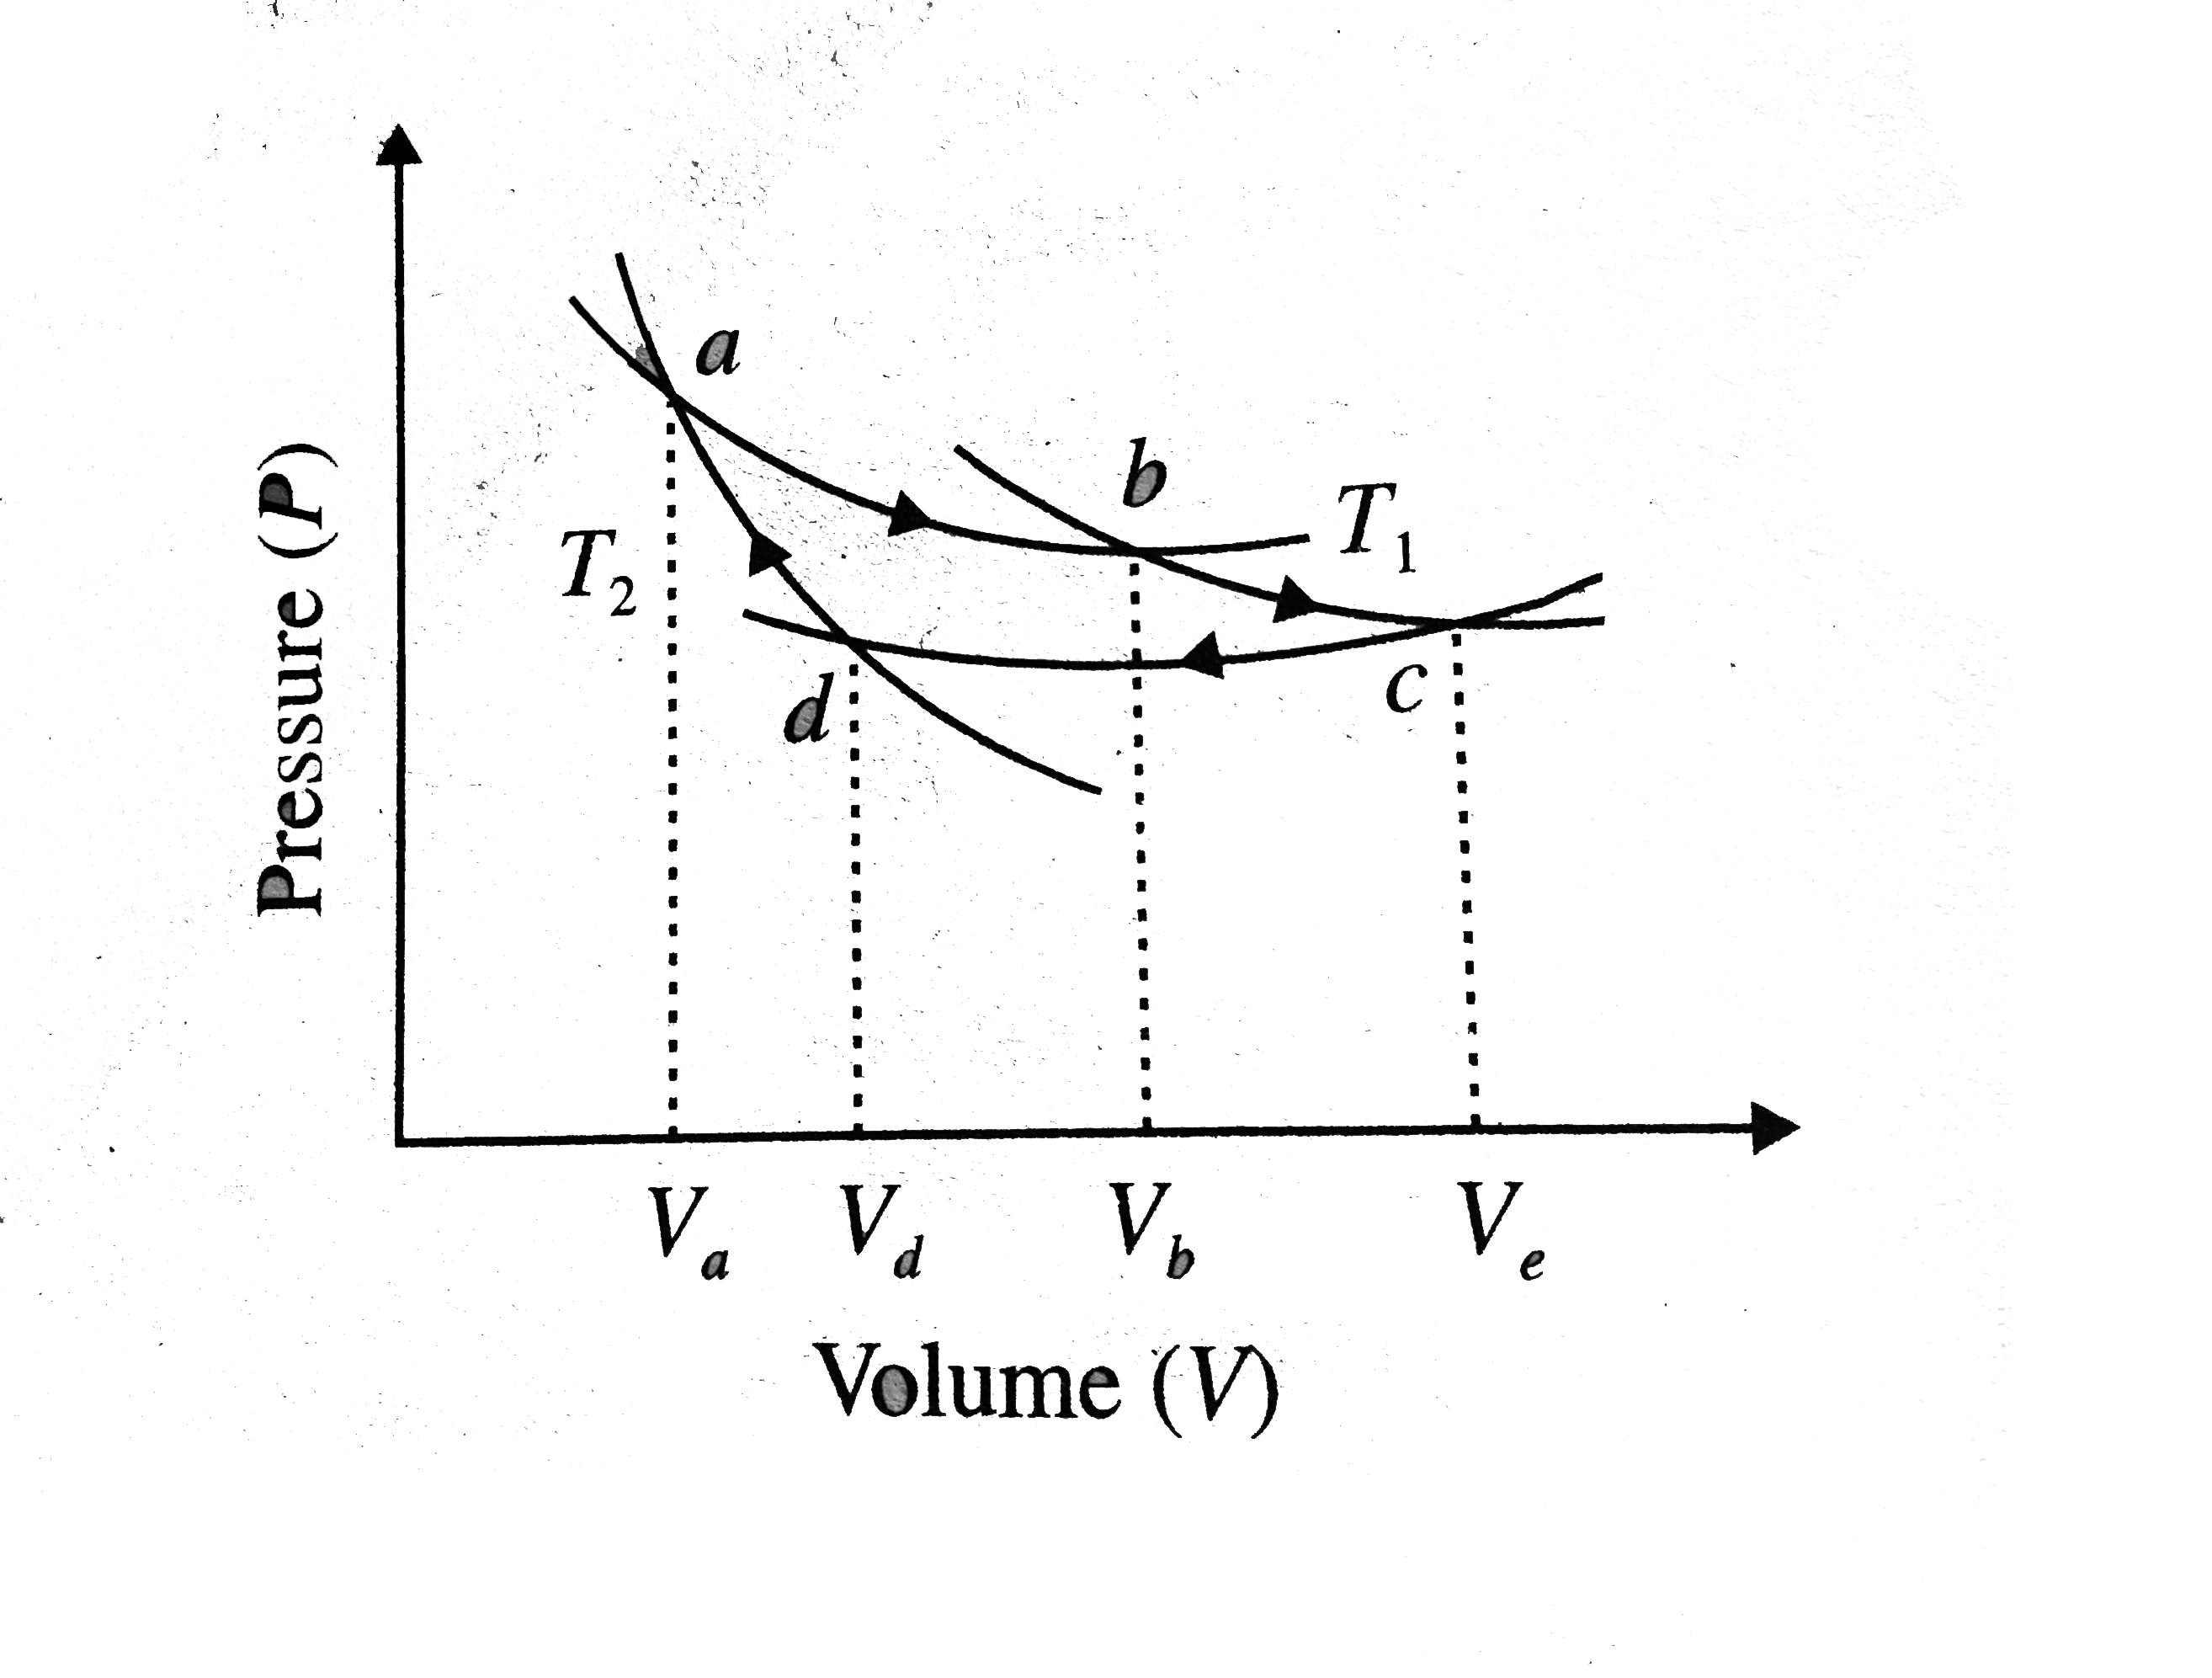 AT1=T2BT1>T2CVaVc=VbVdDVaVb=VcVd
Three moles of an ideal gas undergo a cyclic process shown in figure. The work done by the gas during the process is [Take ln (2)=0.693]
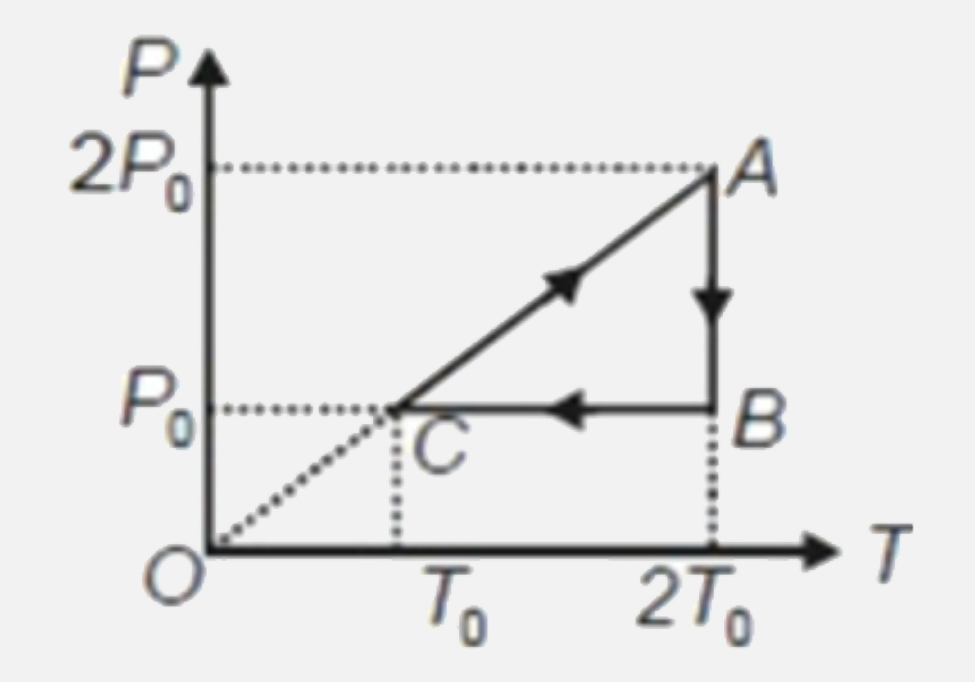 View Solution
Calculate ΔG (in bar-L) when a definite mass of a monoatomic ideal gas at 1 bar and 27∘C is expanded adiabatically against vacuum from 10 L to 20 L (In 2=0.7).
View SolutionFind the heat absorbed by an ideal gas (in kJ)w it follows the graph (given below) during isothermal expansion [ln 2 = 0.7]
[Tale: 1 litre-bar = 0.1 kJ]
 View Solution
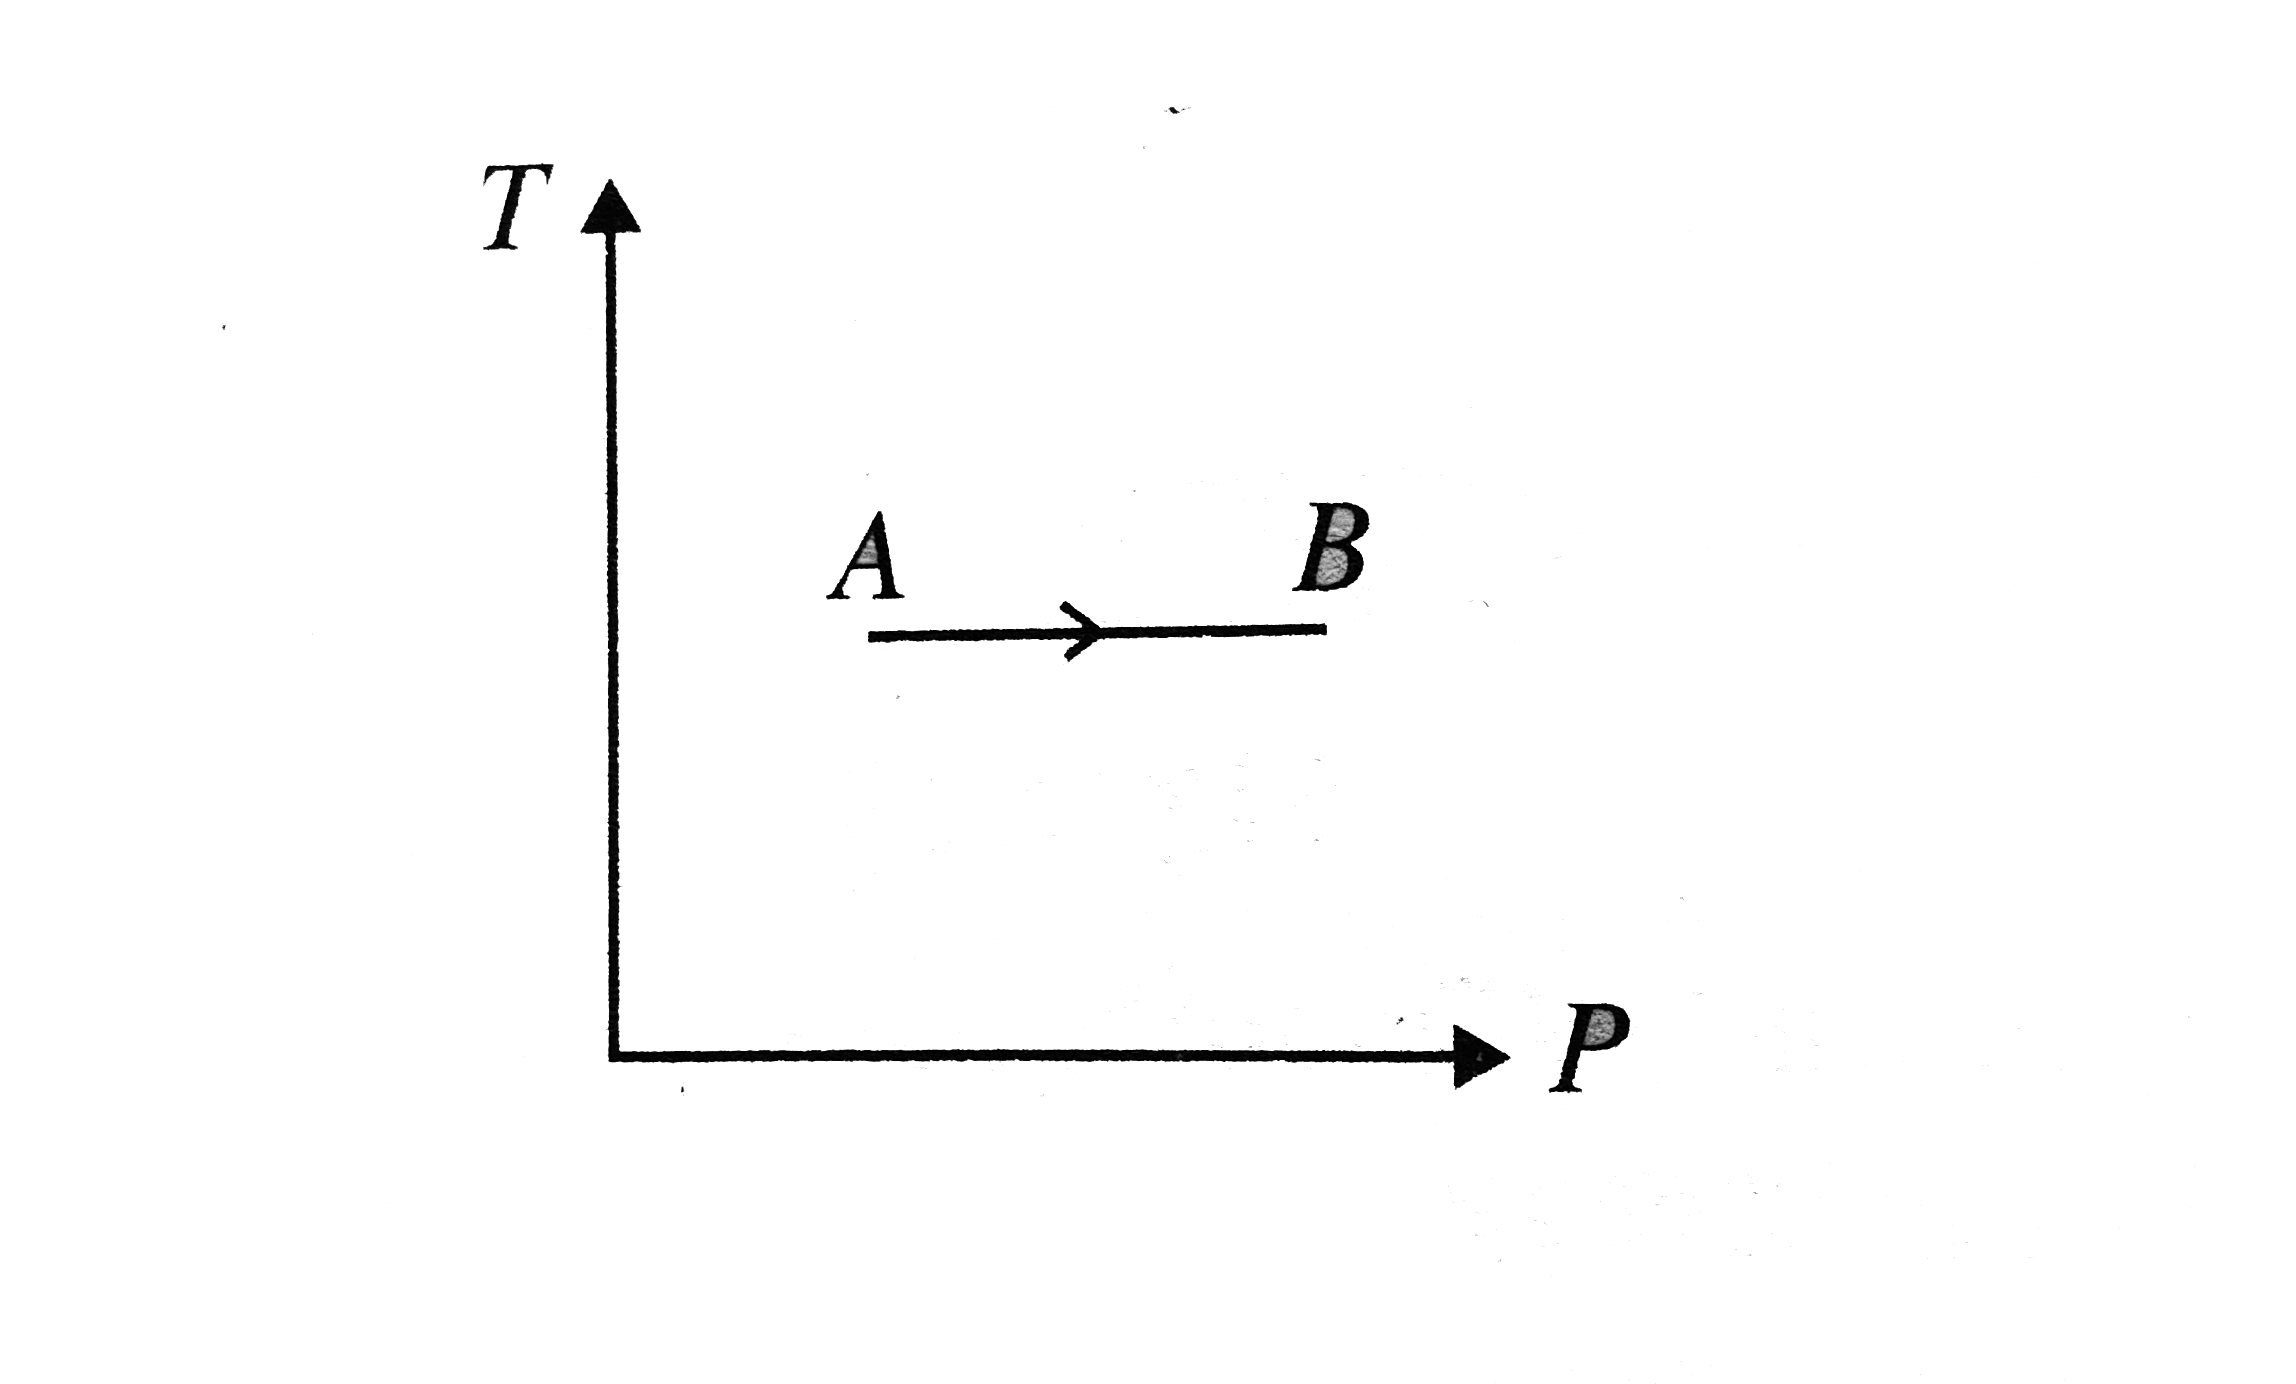
Temperature versus pressure graph of an ideal gas is shown in Fig. During the process AB
 View Solution
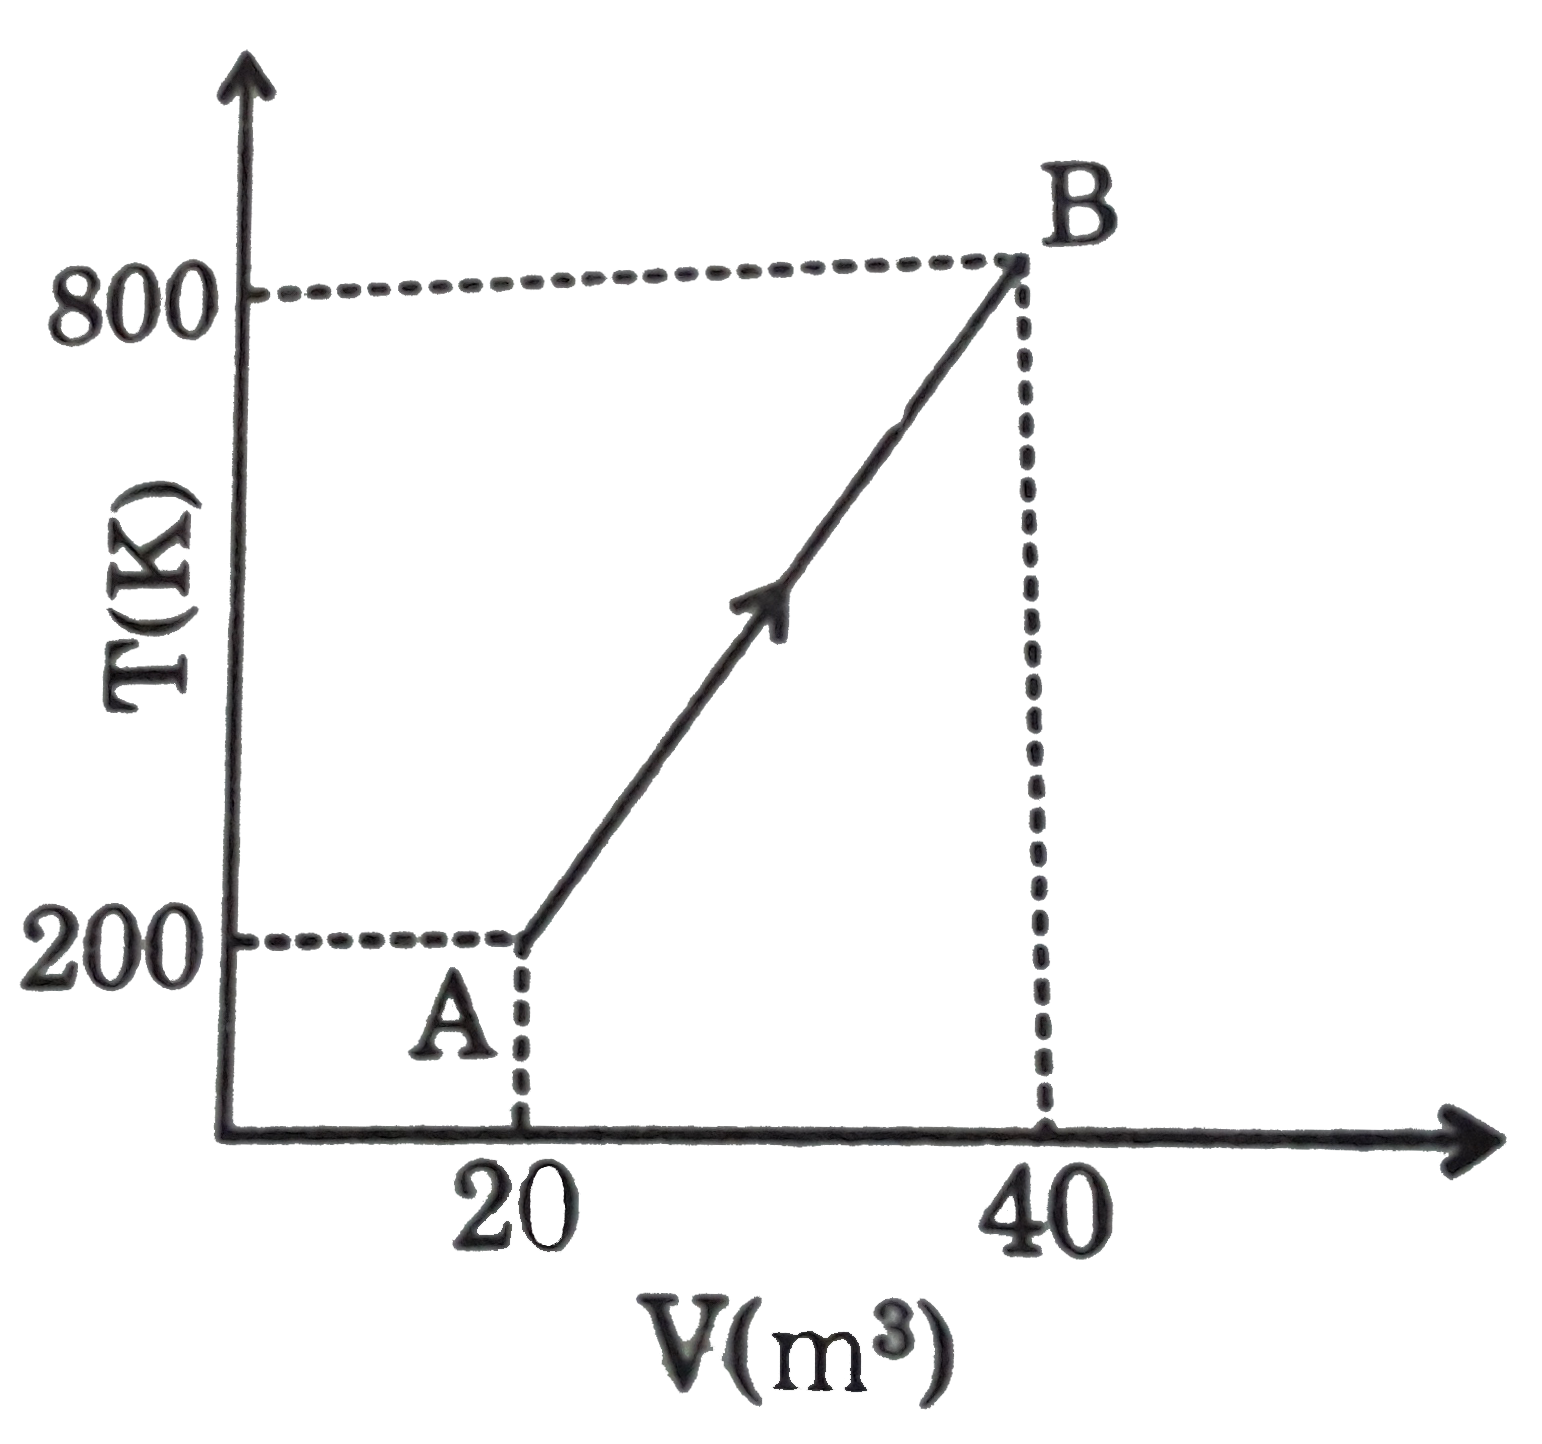
Calculate magnitude of work done in calorie for one mole of an ideal gas subjected to the process as shown in figure. [Use: R=2cal/mol−K and ln 2=0.7]
 View Solution

