10 moles of an ideal gas is subjected to an isochoric process (volume constant) and a graph of log P us log T is plotted where P is in 'atm' and is in 'Kelvin'. If volume of the container is 82.1 ml then calculate sum of a,b and c.
Where : a = slope of the graph
b = x intercept of the graph
c = y intercept of the graph
The correct Answer is:1
Step by step video, text & image solution for 10 moles of an ideal gas is subjected to an isochoric process (volume constant) and a graph of log P us log T is plotted where P is in 'atm' and is in 'Kelvin'. If volume of the container is 82.1 ml then calculate sum of a,b and c. Where : a = slope of the graph b = x intercept of the graph c = y intercept of the graph by Chemistry experts to help you in doubts & scoring excellent marks in Class 12 exams.
Topper's Solved these Questions
- BOOK - GRB PUBLICATIONCHAPTER - GRAPHICAL INTERPRETATIONEXERCISE - Match The Column Type15videos
GRAPHICAL INTERPRETATION
- BOOK - GRB PUBLICATIONCHAPTER - F-BLOCK ELEMENTSEXERCISE - Subjective type7videos
F-BLOCK ELEMENTS
- BOOK - GRB PUBLICATIONCHAPTER - HYDROCARBON (ALIPHATIC)EXERCISE - Previous years jee questions28videos
HYDROCARBON (ALIPHATIC)
Similar Questions
Draw a graph of log P vs log (1/V) for a fixed amount of a gas at constant temperature.
View SolutionOne mole of an ideal gas is subjected to a process in which P=18.21 V where P is in atm & V in litre.If the process is operating from 1 atm to finally 10 atm ( no higher pressure achieved during the process ) then what would be the maximum temperature obtained &at what instant will it occur in the process.
View Solution
Knowledge Check
- Question 1 - Select One
The slope of P-V graph for isochoric process is
AZeroBInfiniteCOneDTwo - Question 2 - Select One
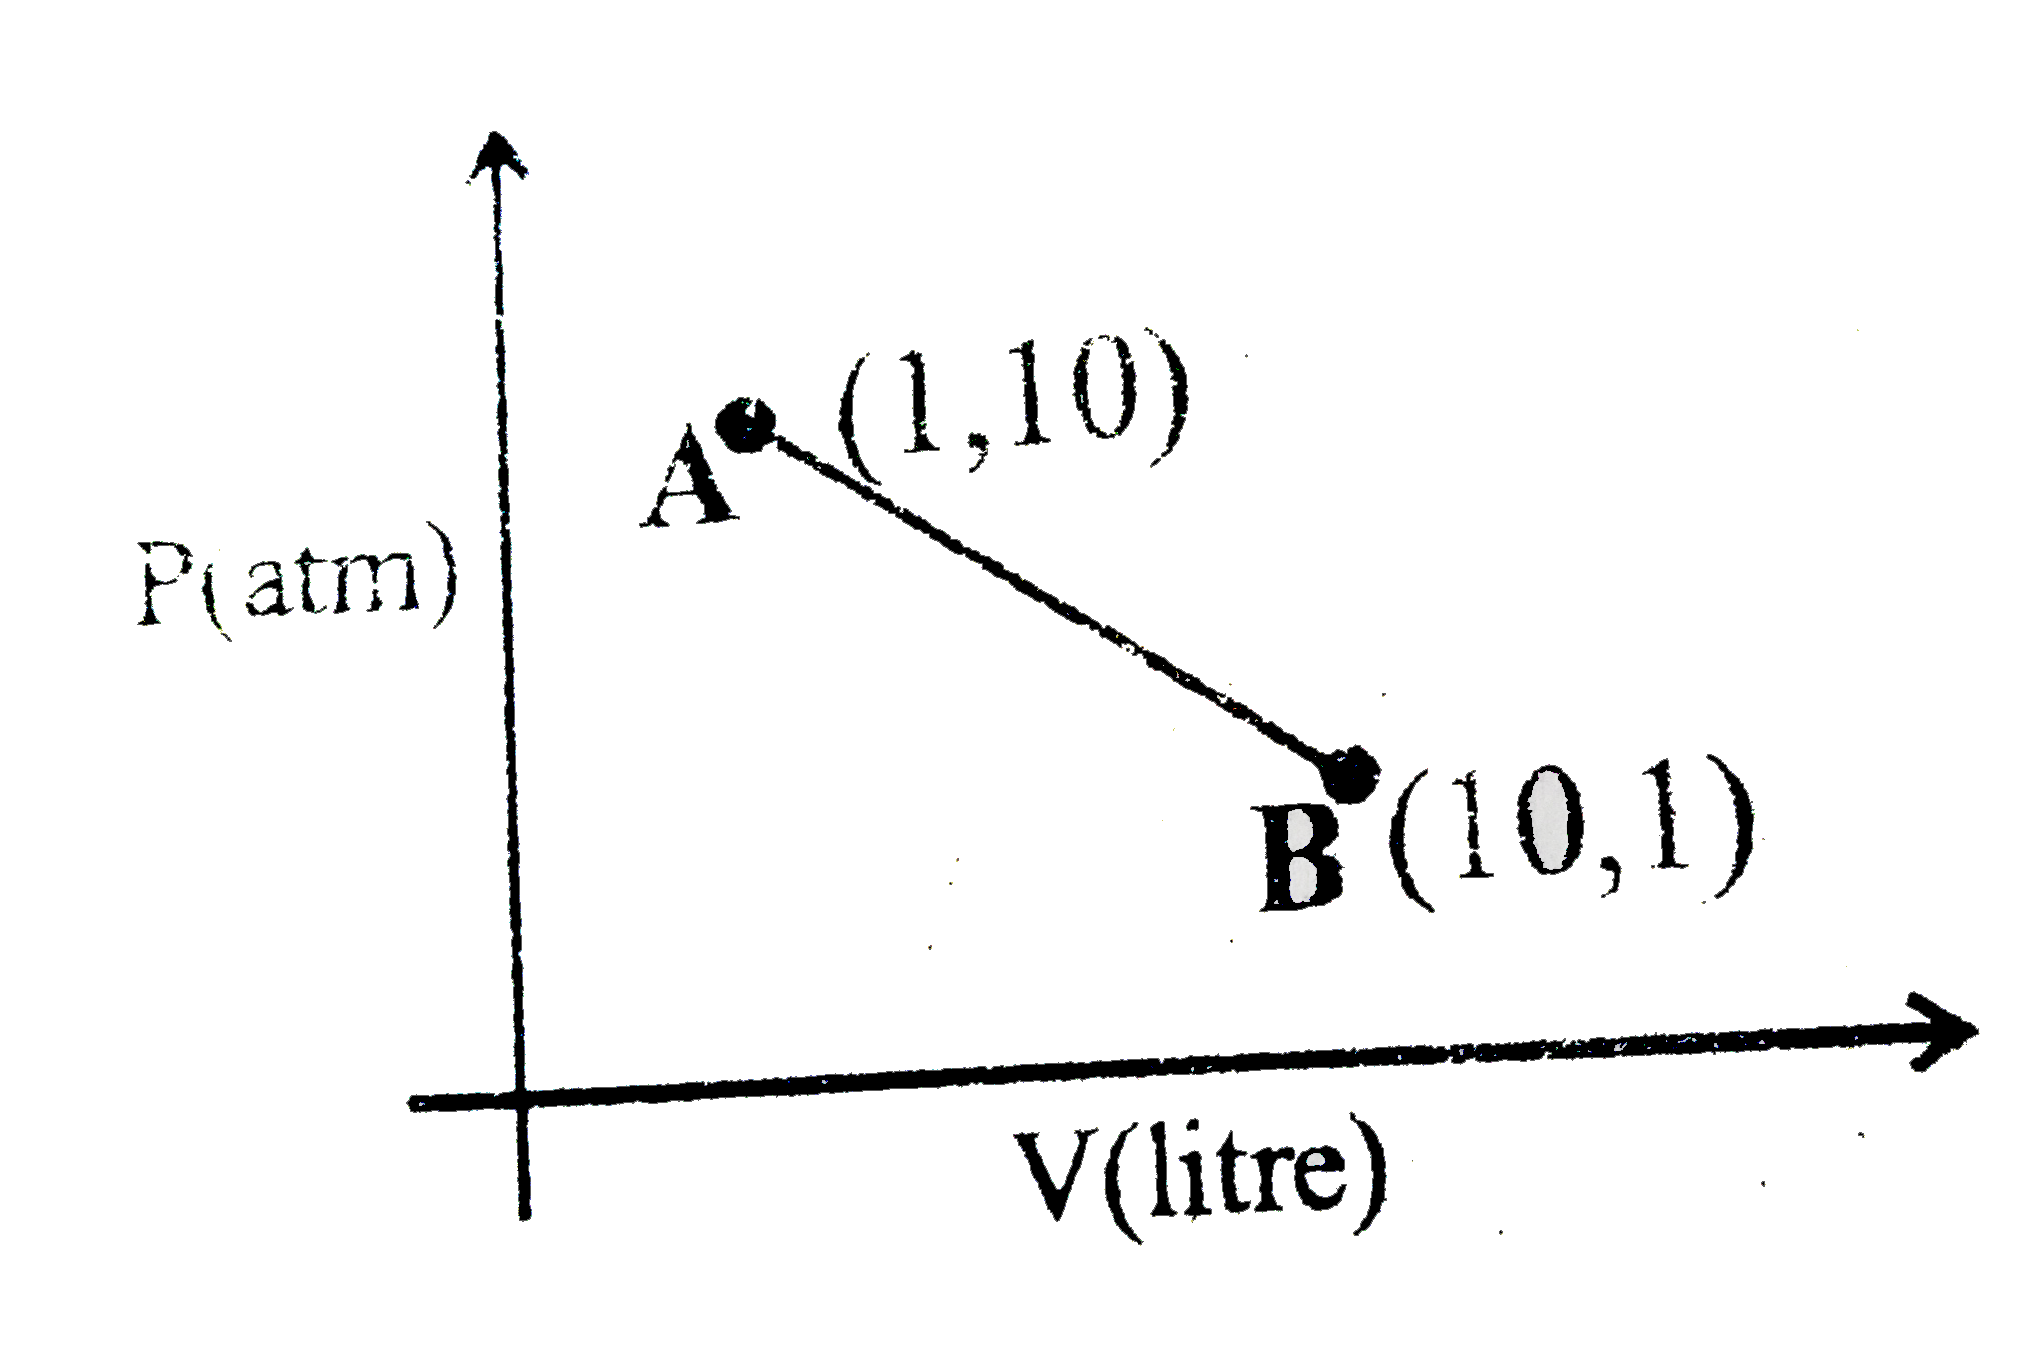
For 1 mole of an ideal gas, a graph of pressure vs volume is plotted as shown. Which of the following option is correct ?
 AAB process is isothermal.BMaximum temperature of the gas can be 100.0821K.CMinimum temperature of the gas can be 114×0.0821K.DNone of the above
 - Question 3 - Select One
For 1 mole of an ideal gas, a graph of pressure vs volume is plotted as shown. Which of the following options is correct ?
 AAB process is isothermalBMaximum temperature of the gas can be 100.0821KCMinimum temperature of the gas can be 114×0.0821KDNone of these
4 moles of an ideal gas (Cv=15J) is subjected to the following process represented on P – T graph. From the given data find out whether the process is isochoric or not ? also calculate q, w, ΔU,ΔH,
View SolutionFor an ideal gas, under isobaric condition, a graph between log V vs log T :
View SolutionIf the graph is plotted for 1 mole gas in such a way that PV is plotted against 'P', then intercept of the graph for real gas will be:
View SolutionThe intercept on Y - axis in the graph of log xm versus log P gives
View SolutionThe intercept of Y -axis in the graph of logxm versus log P gives
View Solution

