Time versus temperature graph for two thermometers is plotted as shown below.

For which of the thermometers, variation of temperature vs time, is depicted by plot (I)?
Thermometer B.
Topper's Solved these Questions
- BOOK - TARGET PUBLICATIONCHAPTER - HEATEXERCISE - Solve the following problems22videos
HEAT
- BOOK - TARGET PUBLICATIONCHAPTER - HEATEXERCISE - Practice problems20videos
HEAT
- BOOK - TARGET PUBLICATIONCHAPTER - HEATEXERCISE - Complete the given chart2videos
HEAT
- BOOK - TARGET PUBLICATIONCHAPTER - GRAVITATIONEXERCISE - ASSESSMENT19videos
GRAVITATION
- BOOK - TARGET PUBLICATIONCHAPTER - LENSES EXERCISE - Chapter Assessment21videos
LENSES
Similar Questions
Knowledge Check
- Question 1 - Select One
Pressure versus temperature graph of an ideal gas of equal number of moles of different volumes is plotted as shown in figure. Choose the correct alternatives.
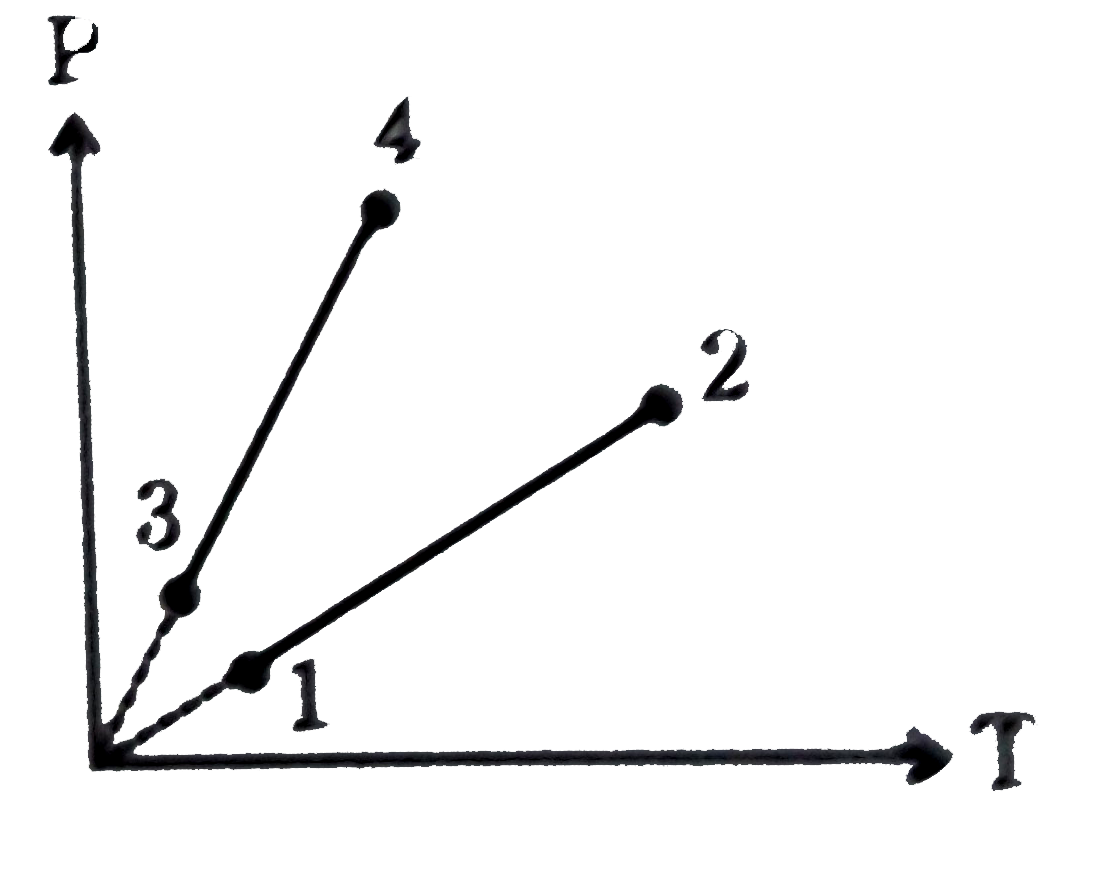 AV1=V2,V3=V4 and V2>V3BV1=V2,V3=V4 and V2<V3CV1=V2=V3=V4DV4>V3>V2>V1
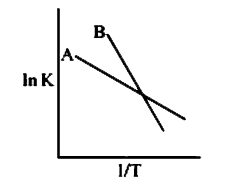
Plot ln K vs. 1/T for two reactions A and B are given below. Which reaction is more sensitive to temperature :-
 View Solution
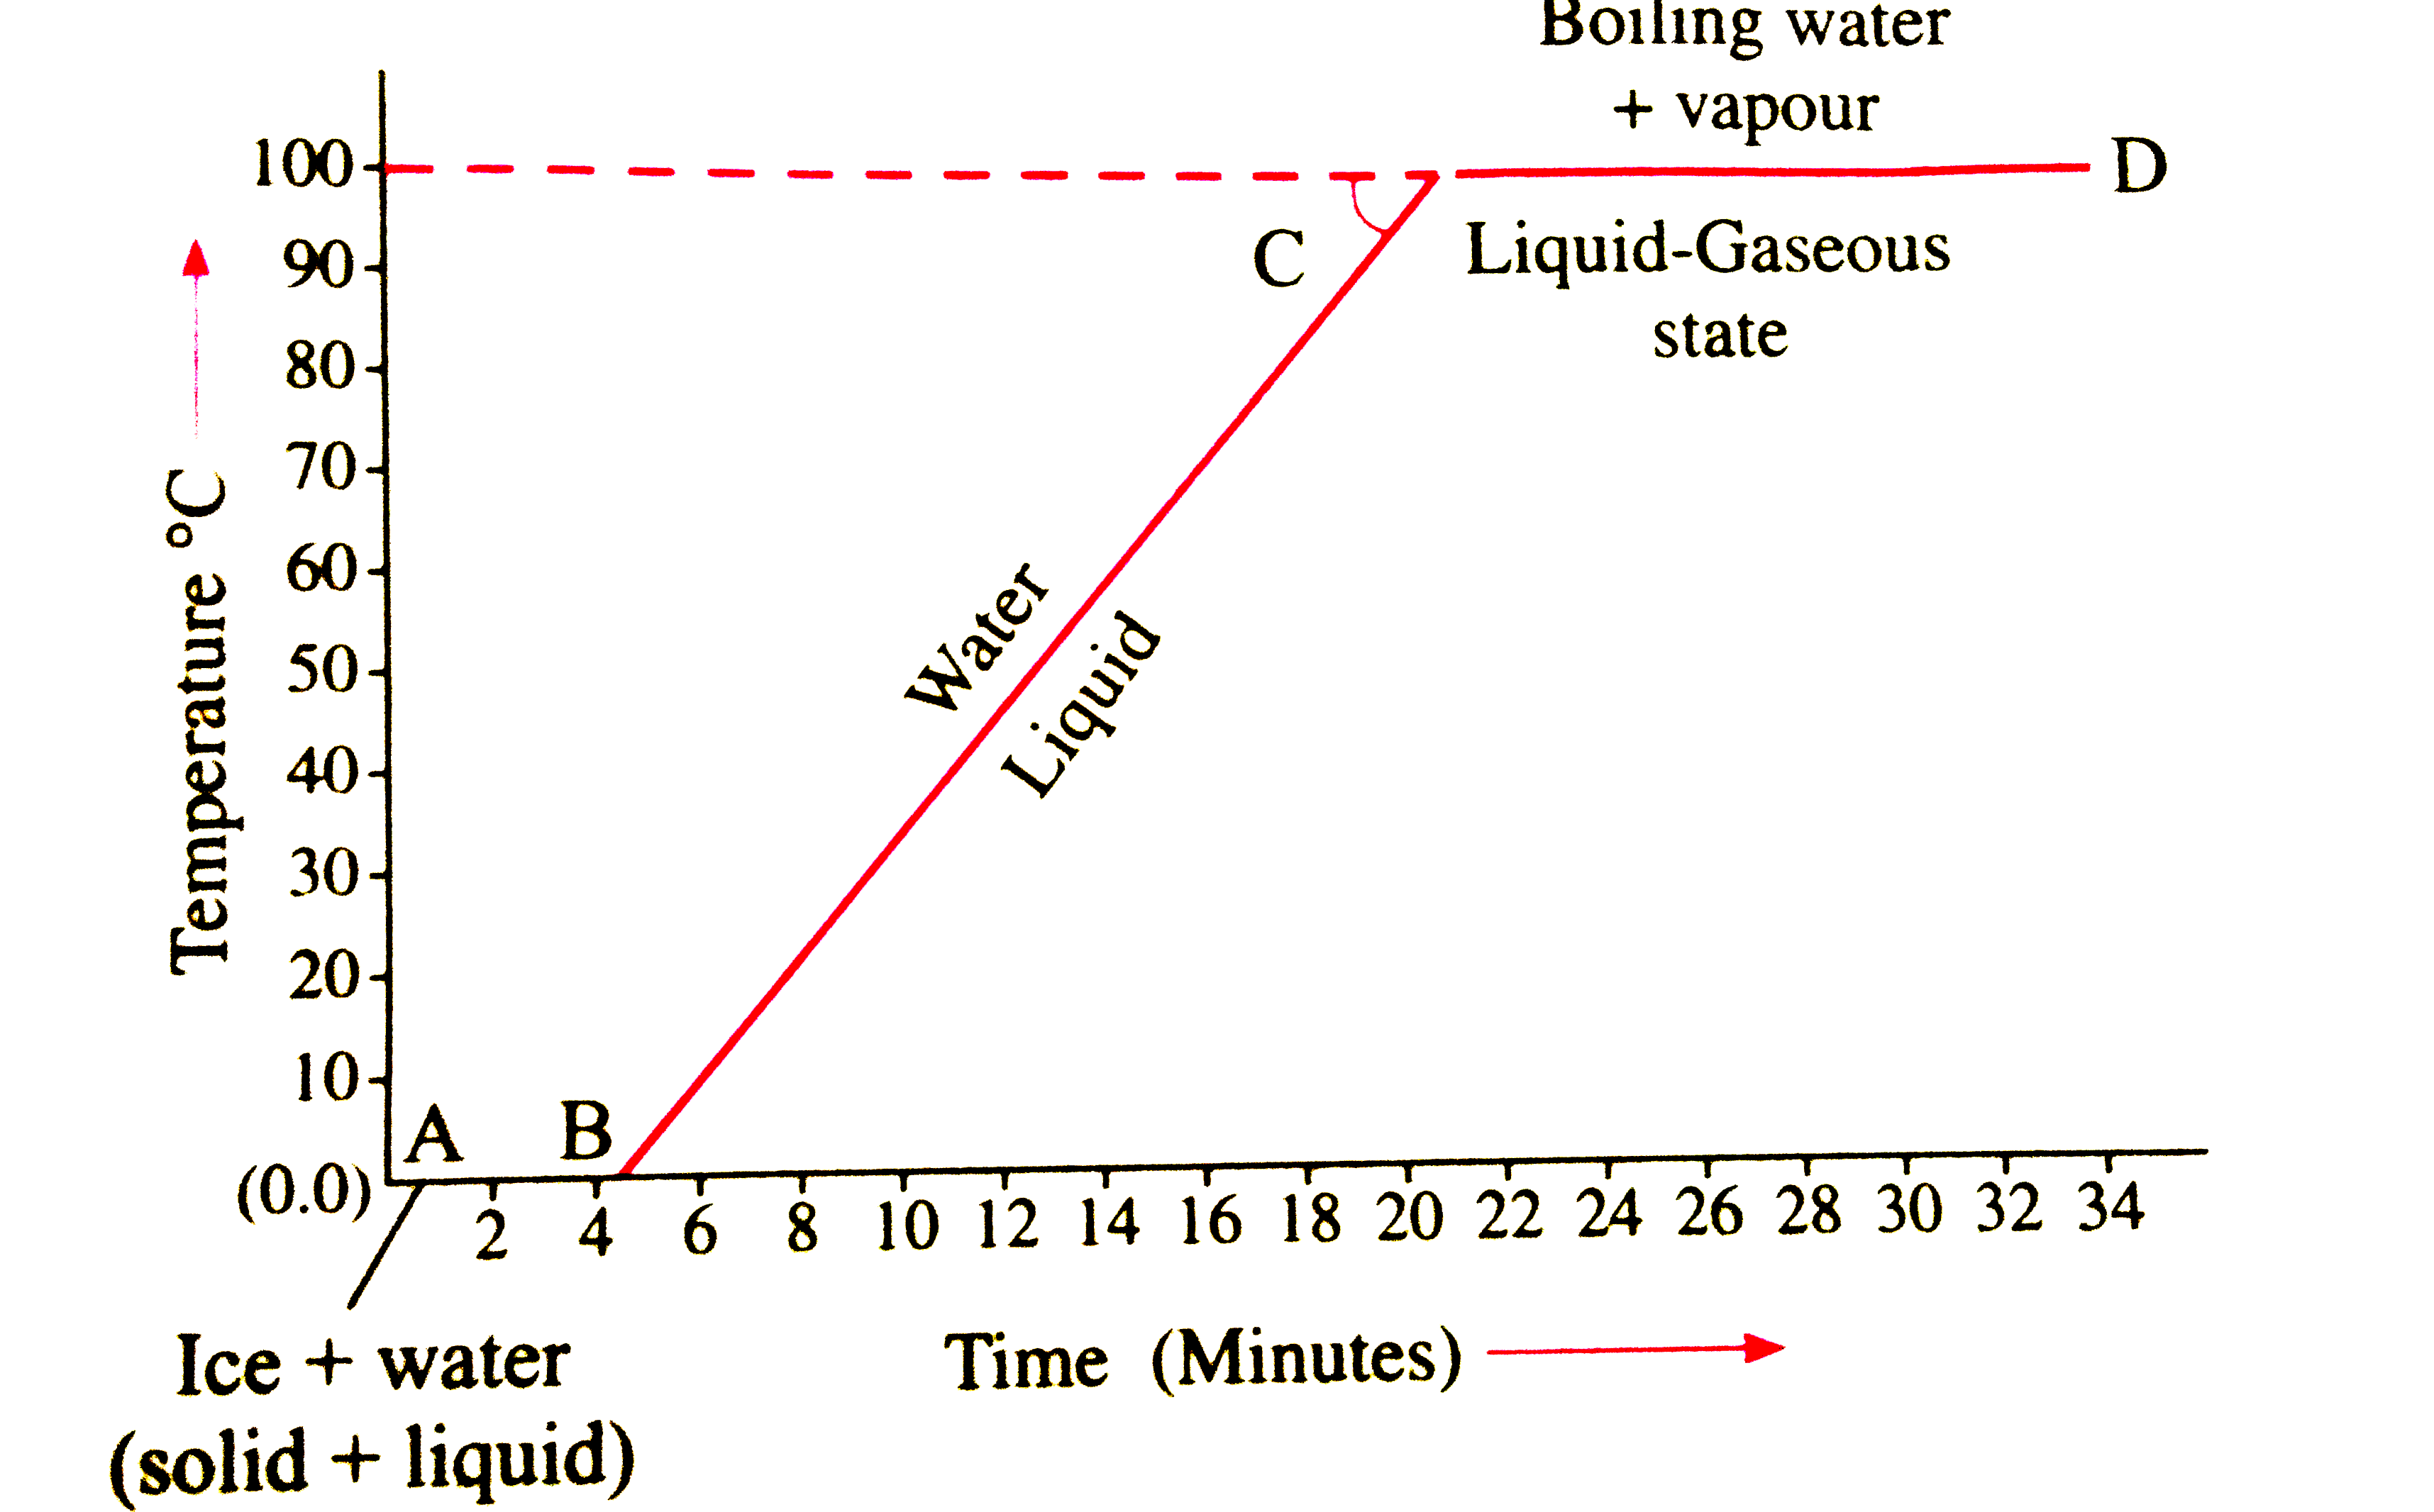
Explain the following temperature Vs. time graph:
 View Solution
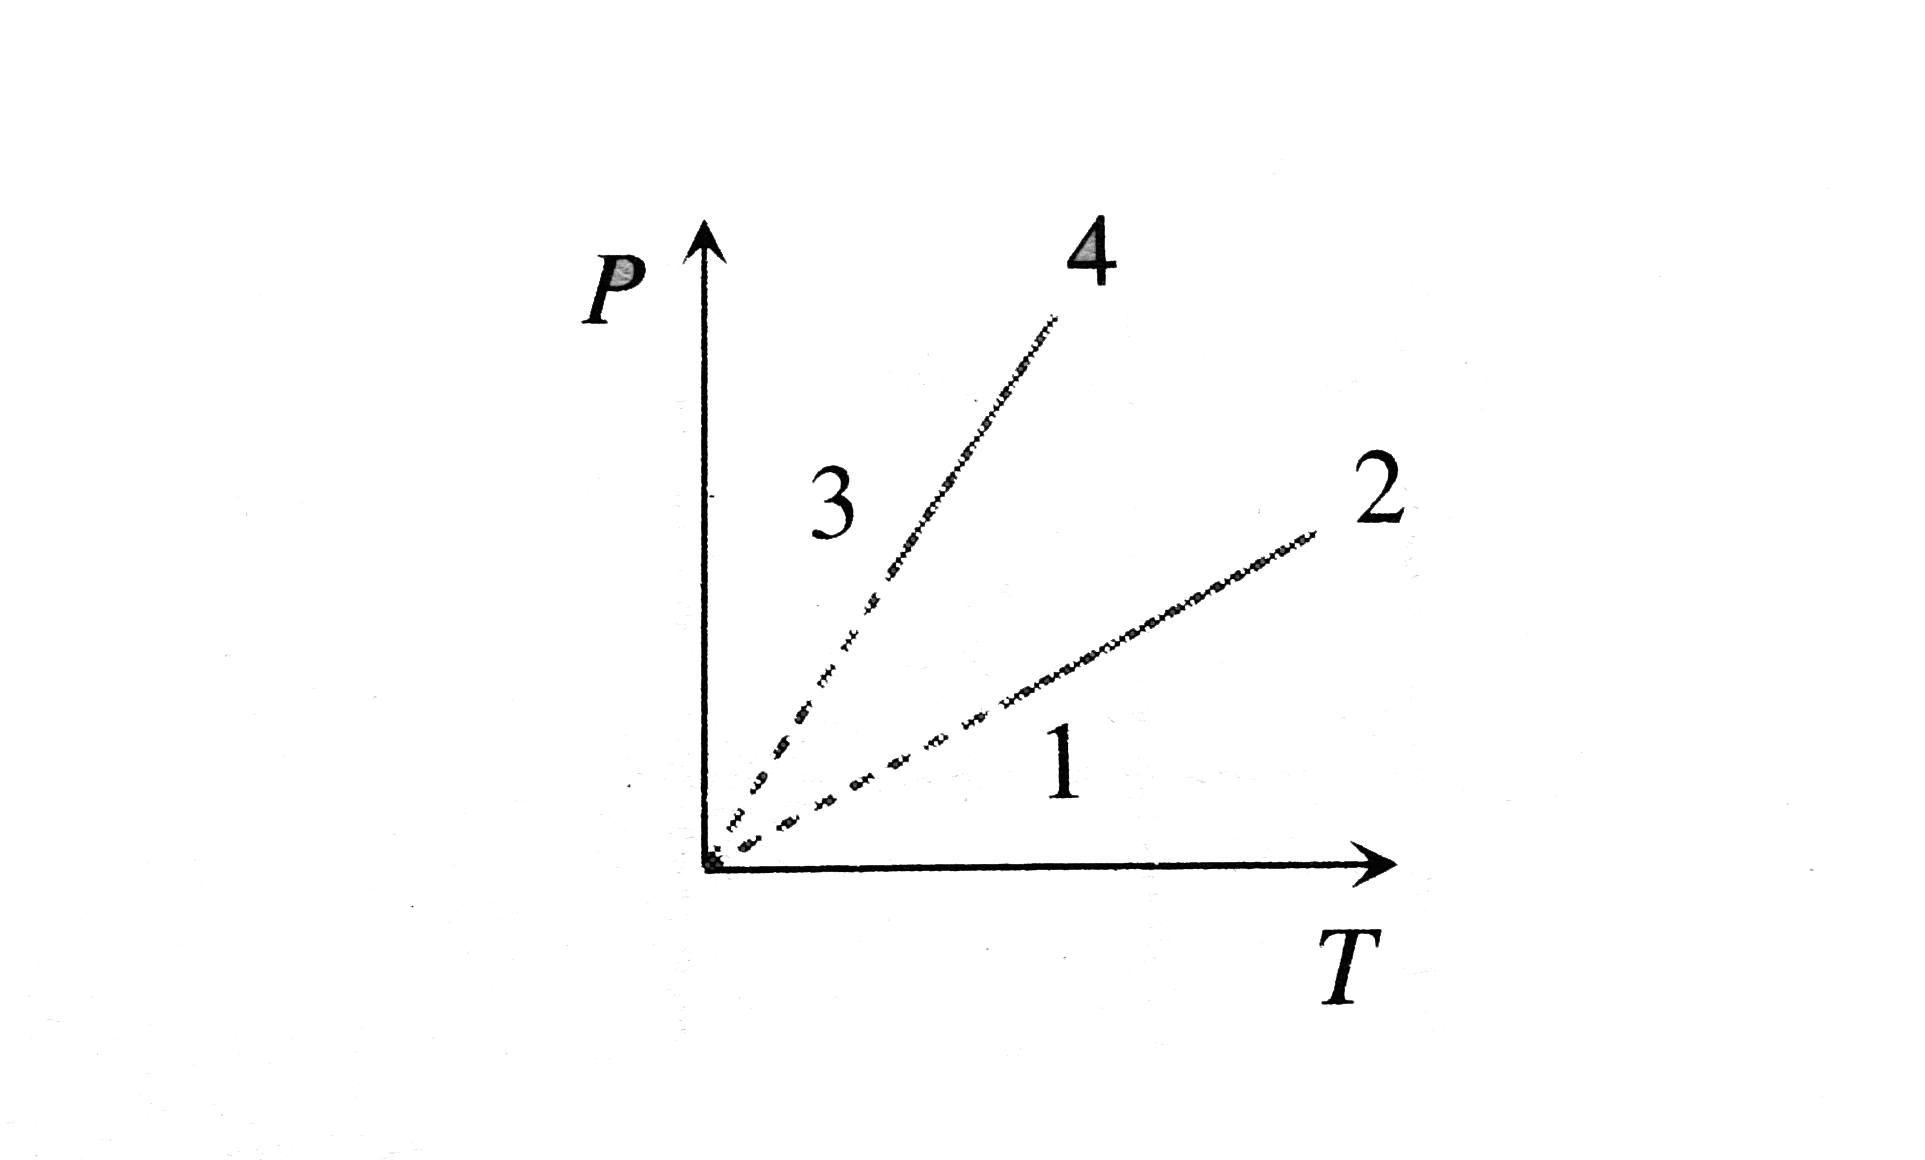
Pressure versus temperature graph of an ideal gas of equal number of moles of different volumes is plotted as shown in Fig. Choose the correct alternative.
 View Solution
Give a plot of Fahrenheit temperature versus Celsius temperature.
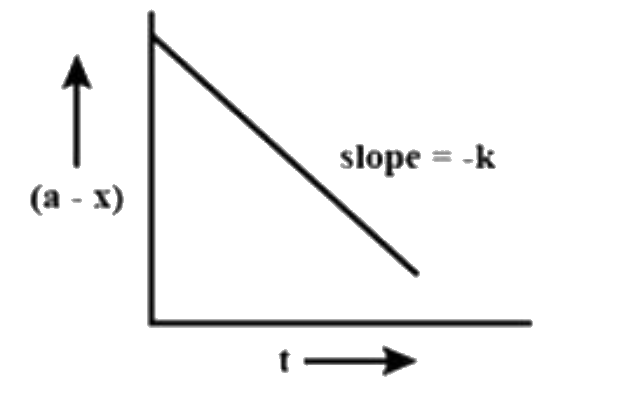
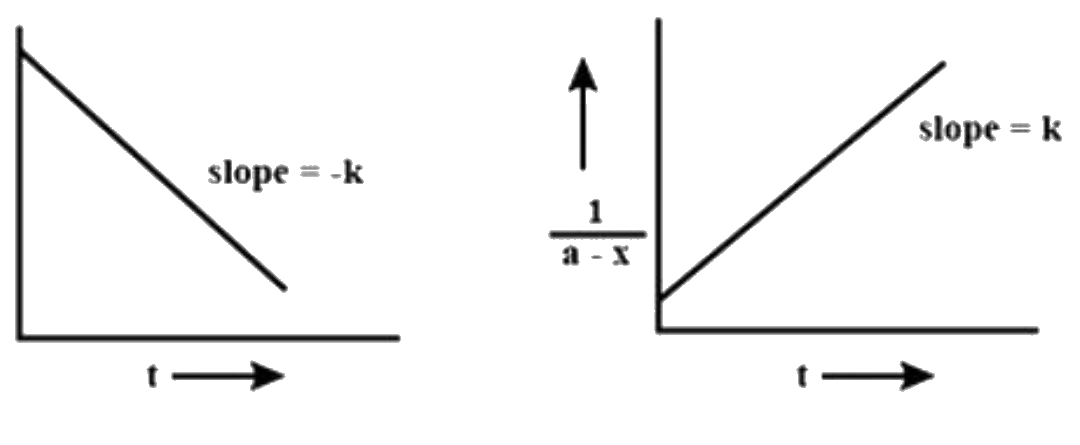
View SolutionTwo plots are shown below between concentration and time t. Which of the given orders are shown by the graph respectively?
 View Solution
Two plots are shown below between concentration and time t. Which of the given orders are shown by the graph respectively?

 View Solution
Two plots are shown below between concentration and time t. Which of the given orders are shown by the graphs respectively?
 View Solution
