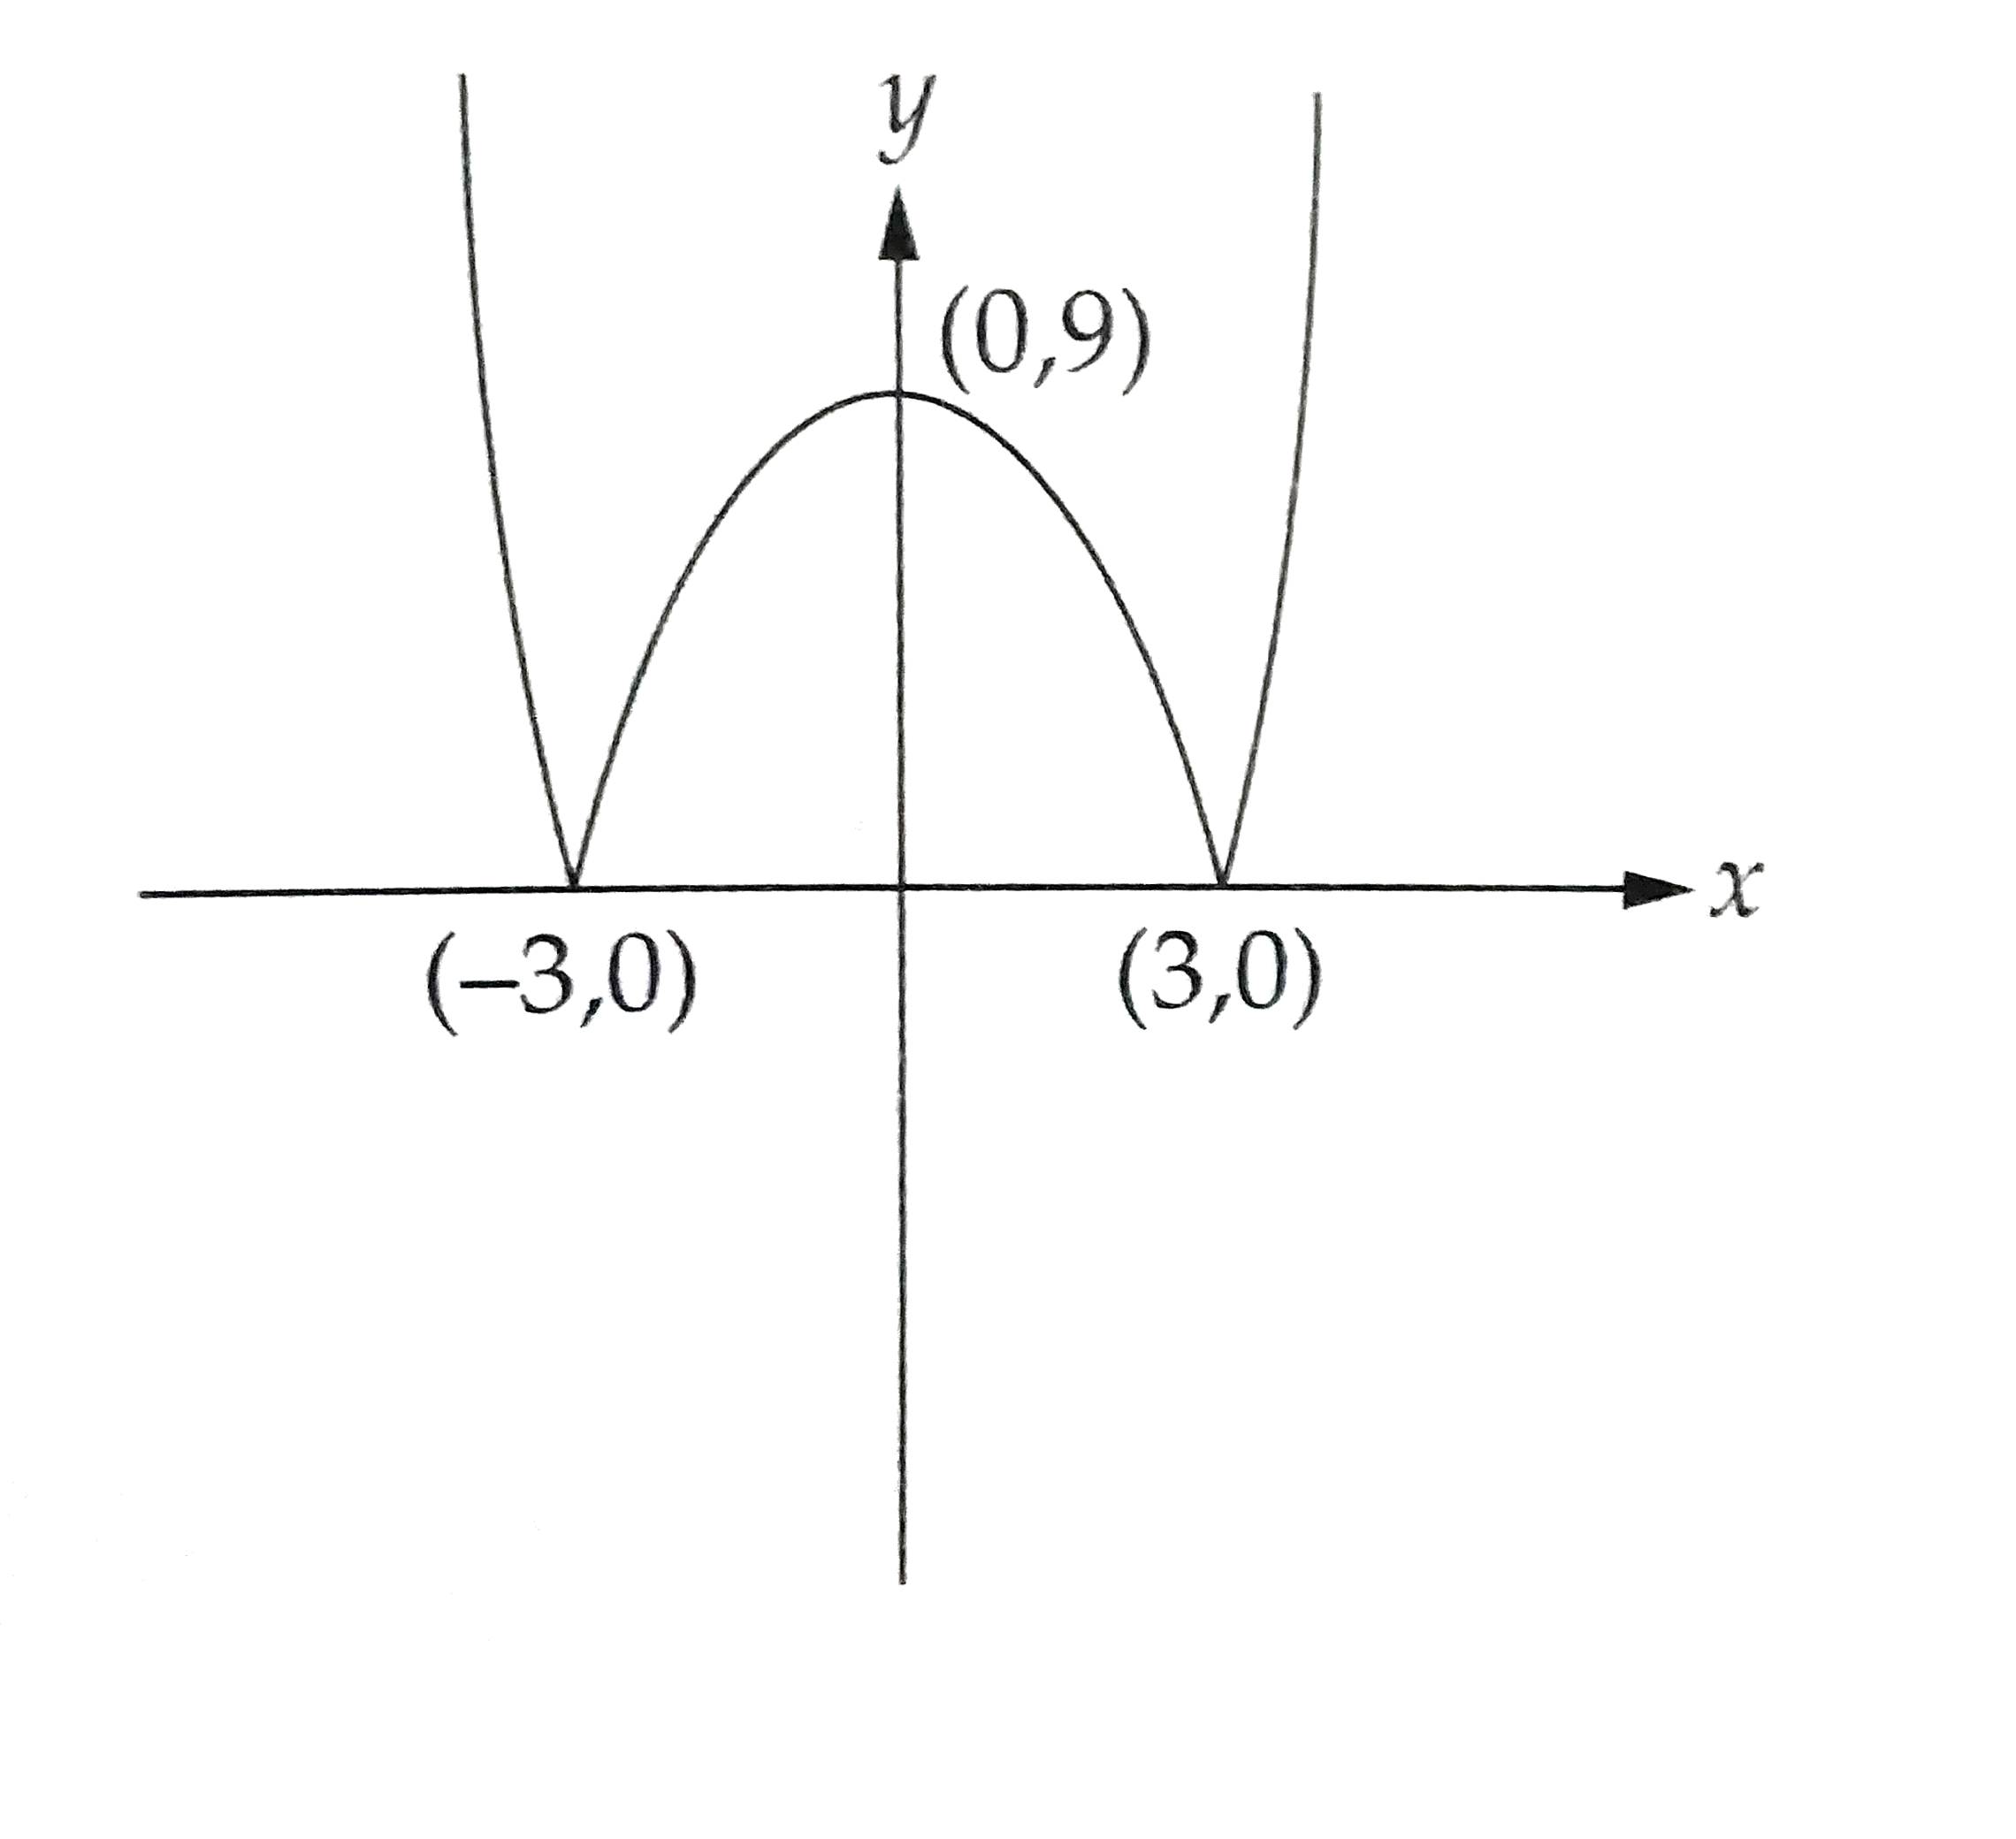
The graph of f(x) is shown below :
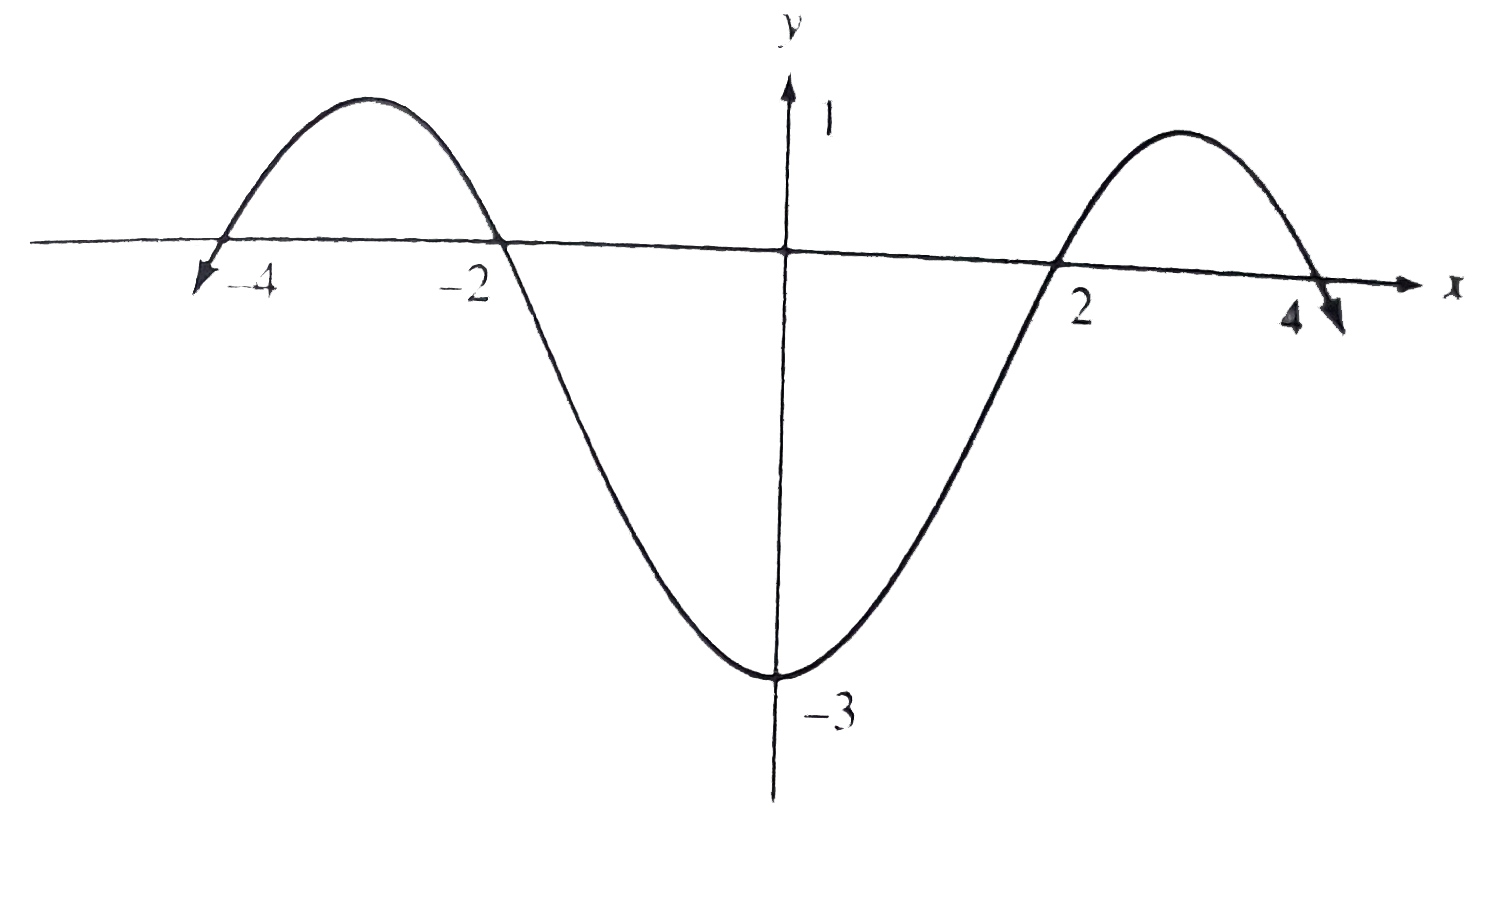
A transformation is applied that results in the following graph :
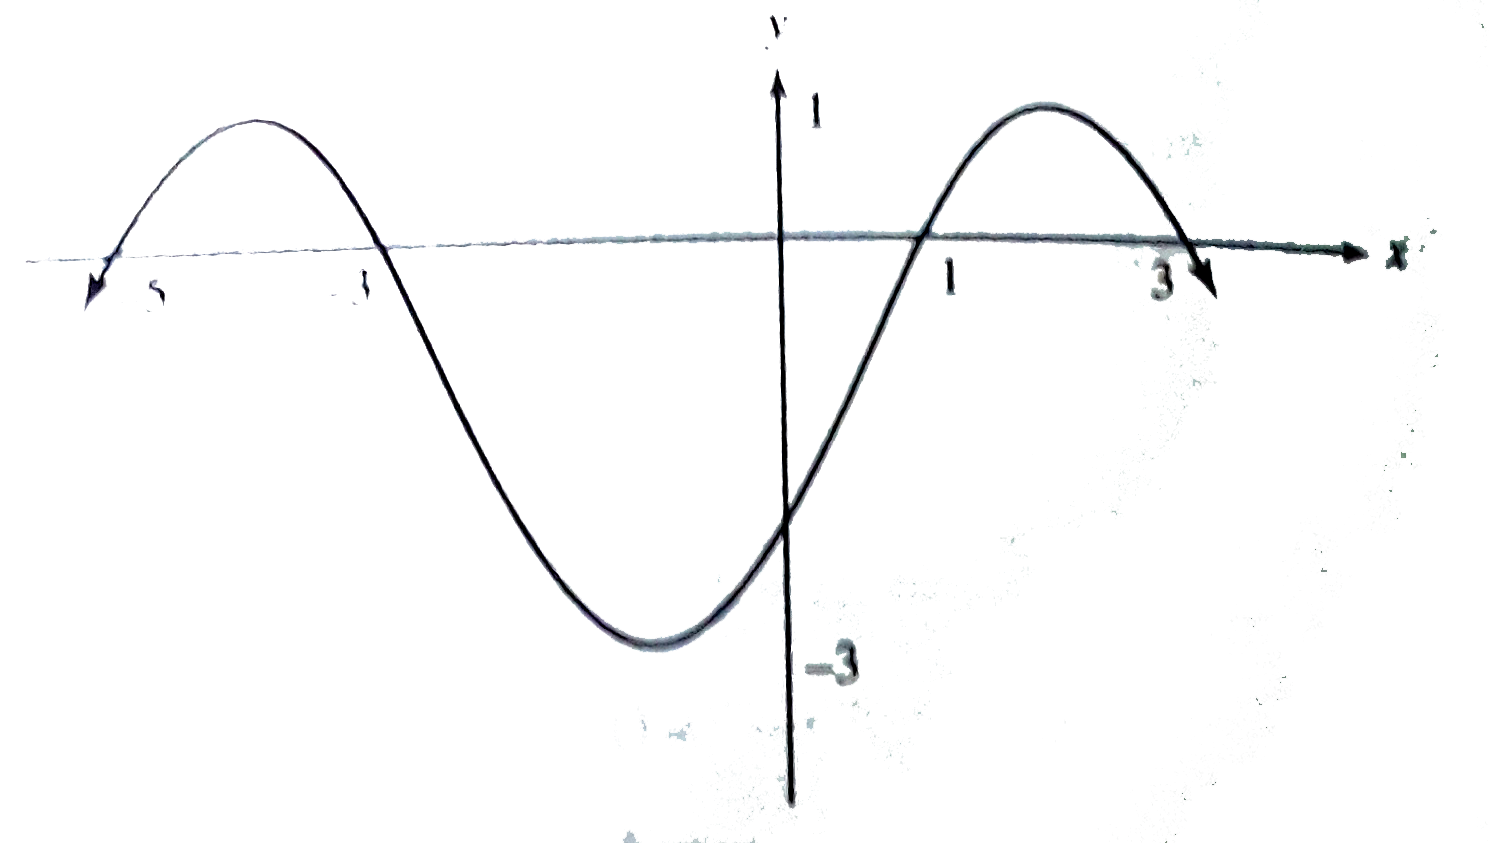
Which of the following functions describes this graph ?
A
f(x-1)
B
f(x+1)
C
f(x)-1
D
f(x)+1
Video Solution
Text Solution
The correct Answer is:B
|
Answer
Step by step video, text & image solution for The graph of f(x) is shown below : A transformation is applied that results in the following graph : Which of the following functions describes this graph ? by Maths experts to help you in doubts & scoring excellent marks in Class 12 exams.
Updated on:21/07/2023Topper's Solved these Questions
Similar Questions
Knowledge Check
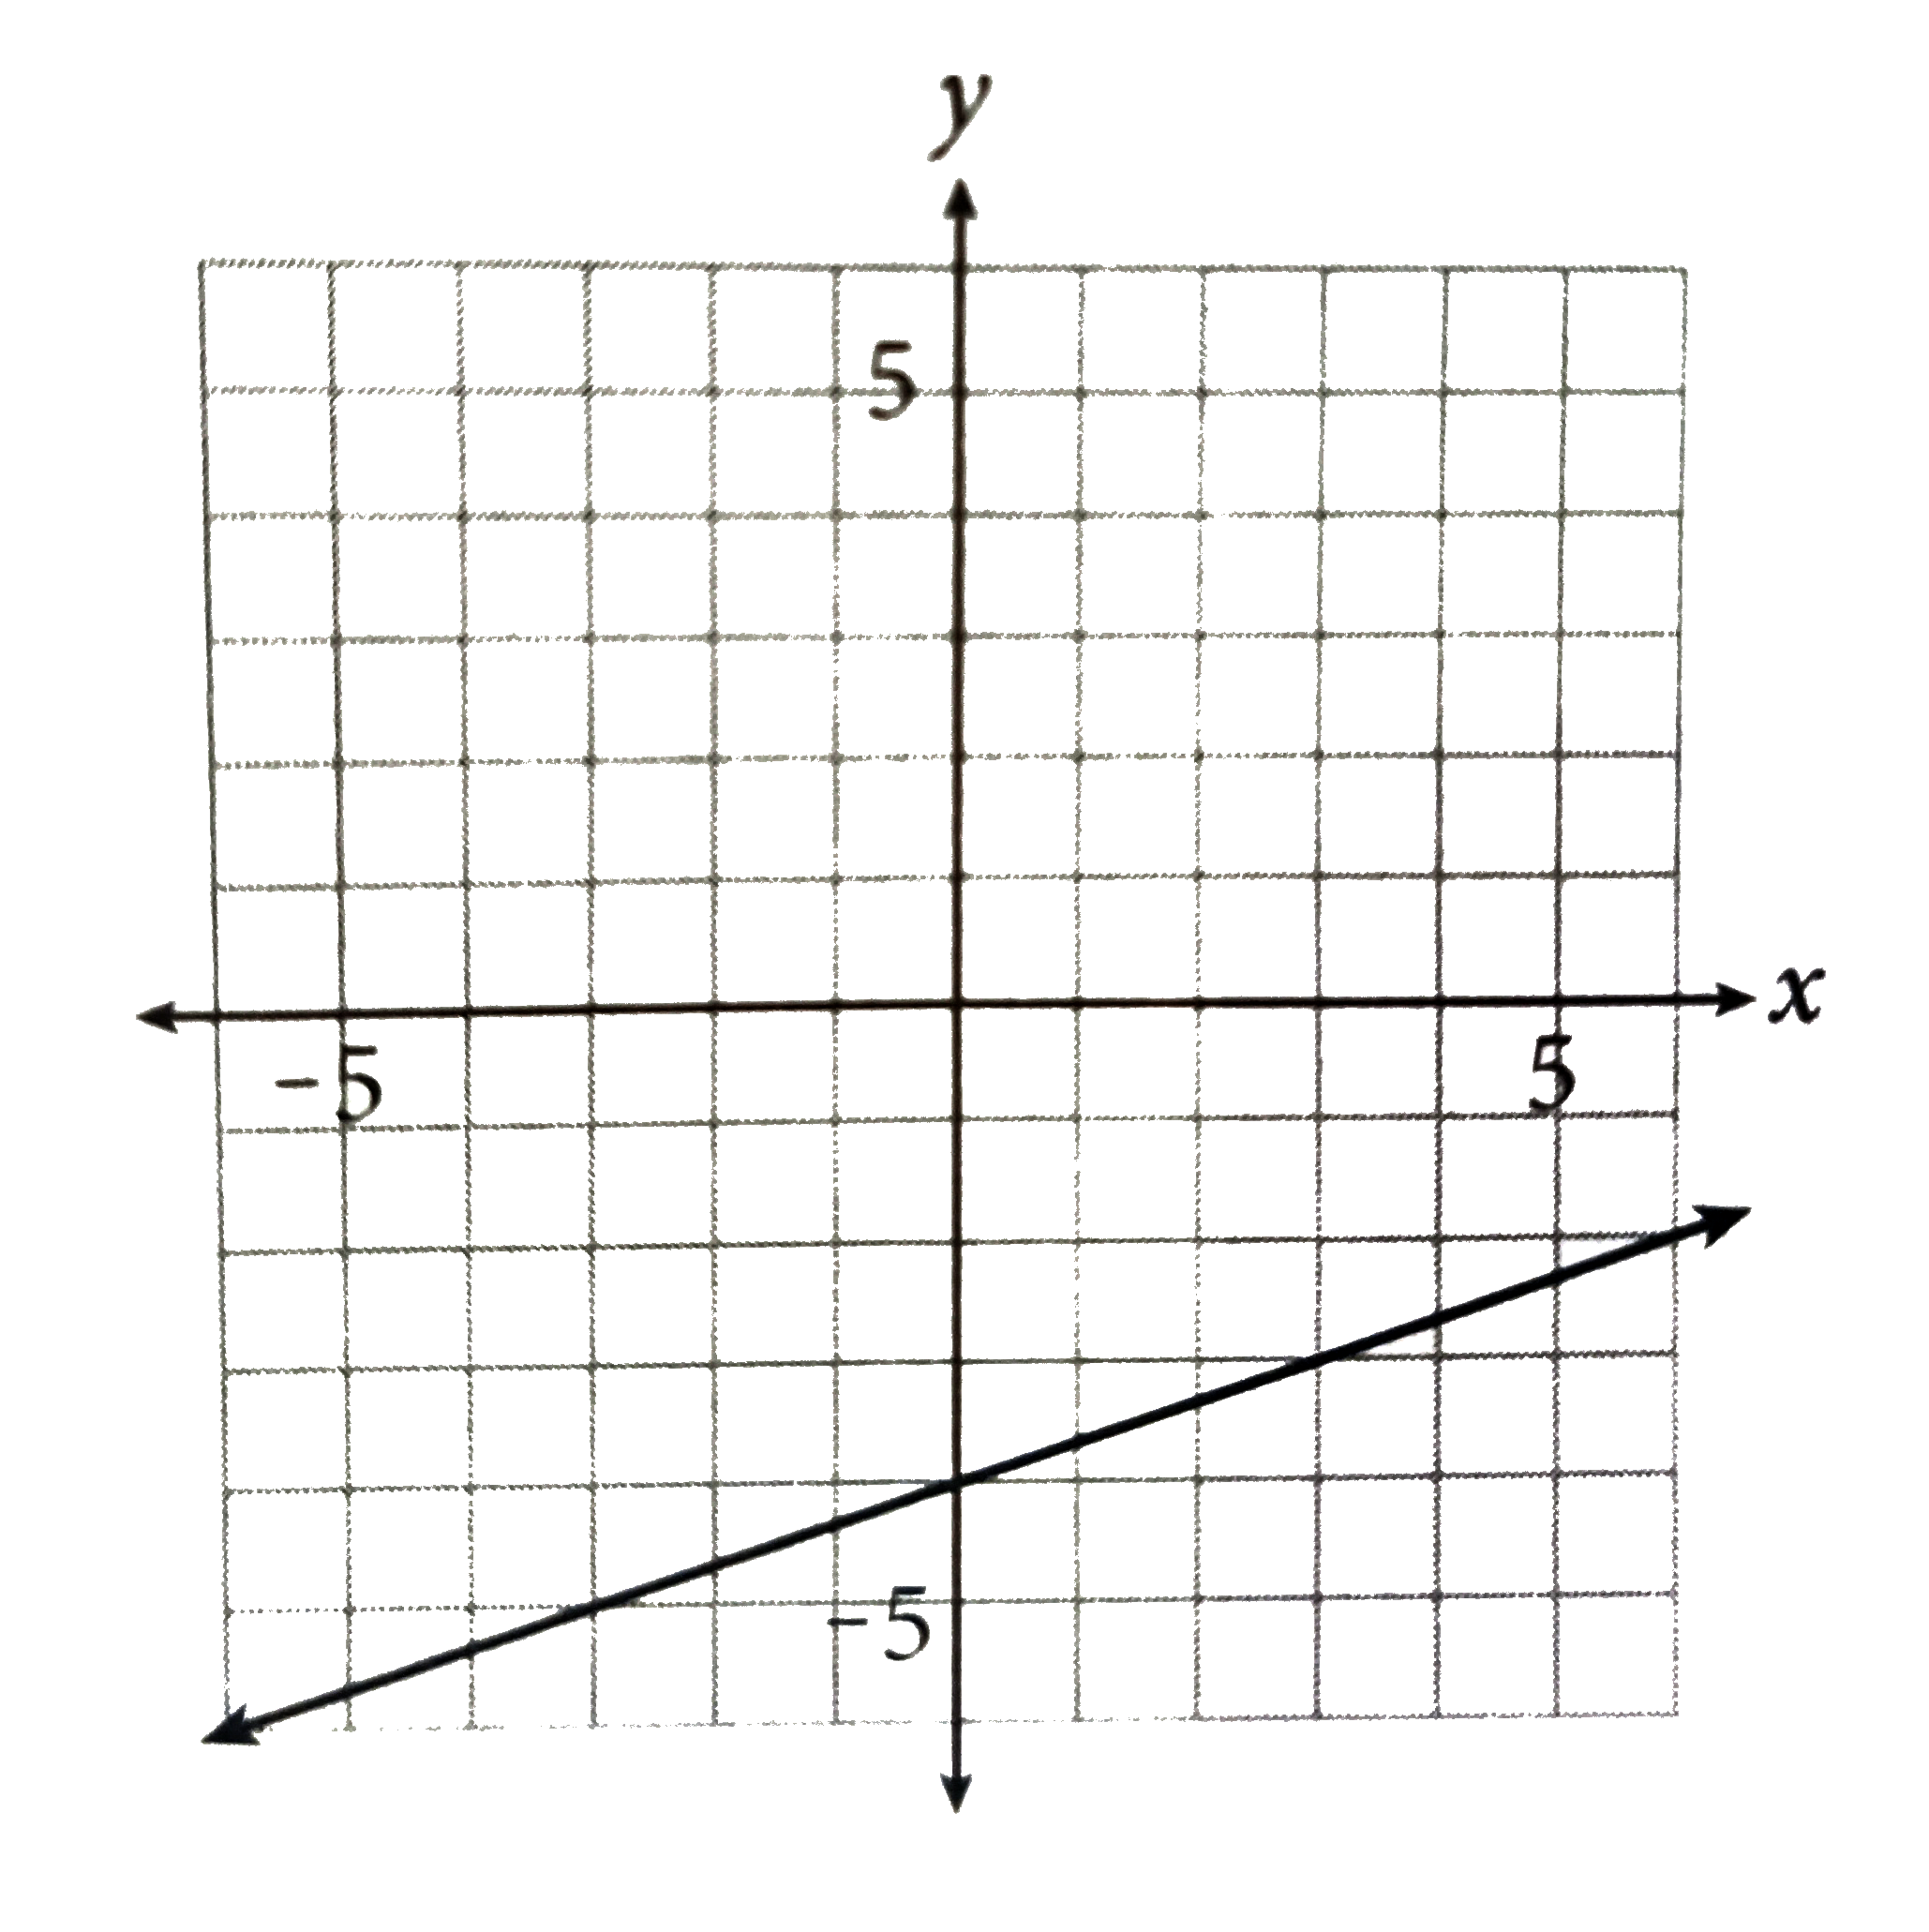
The graph shown represents which of the following equations ?Ay=−3x+4By=−13x+4Cy=13x−4Dy=3x−4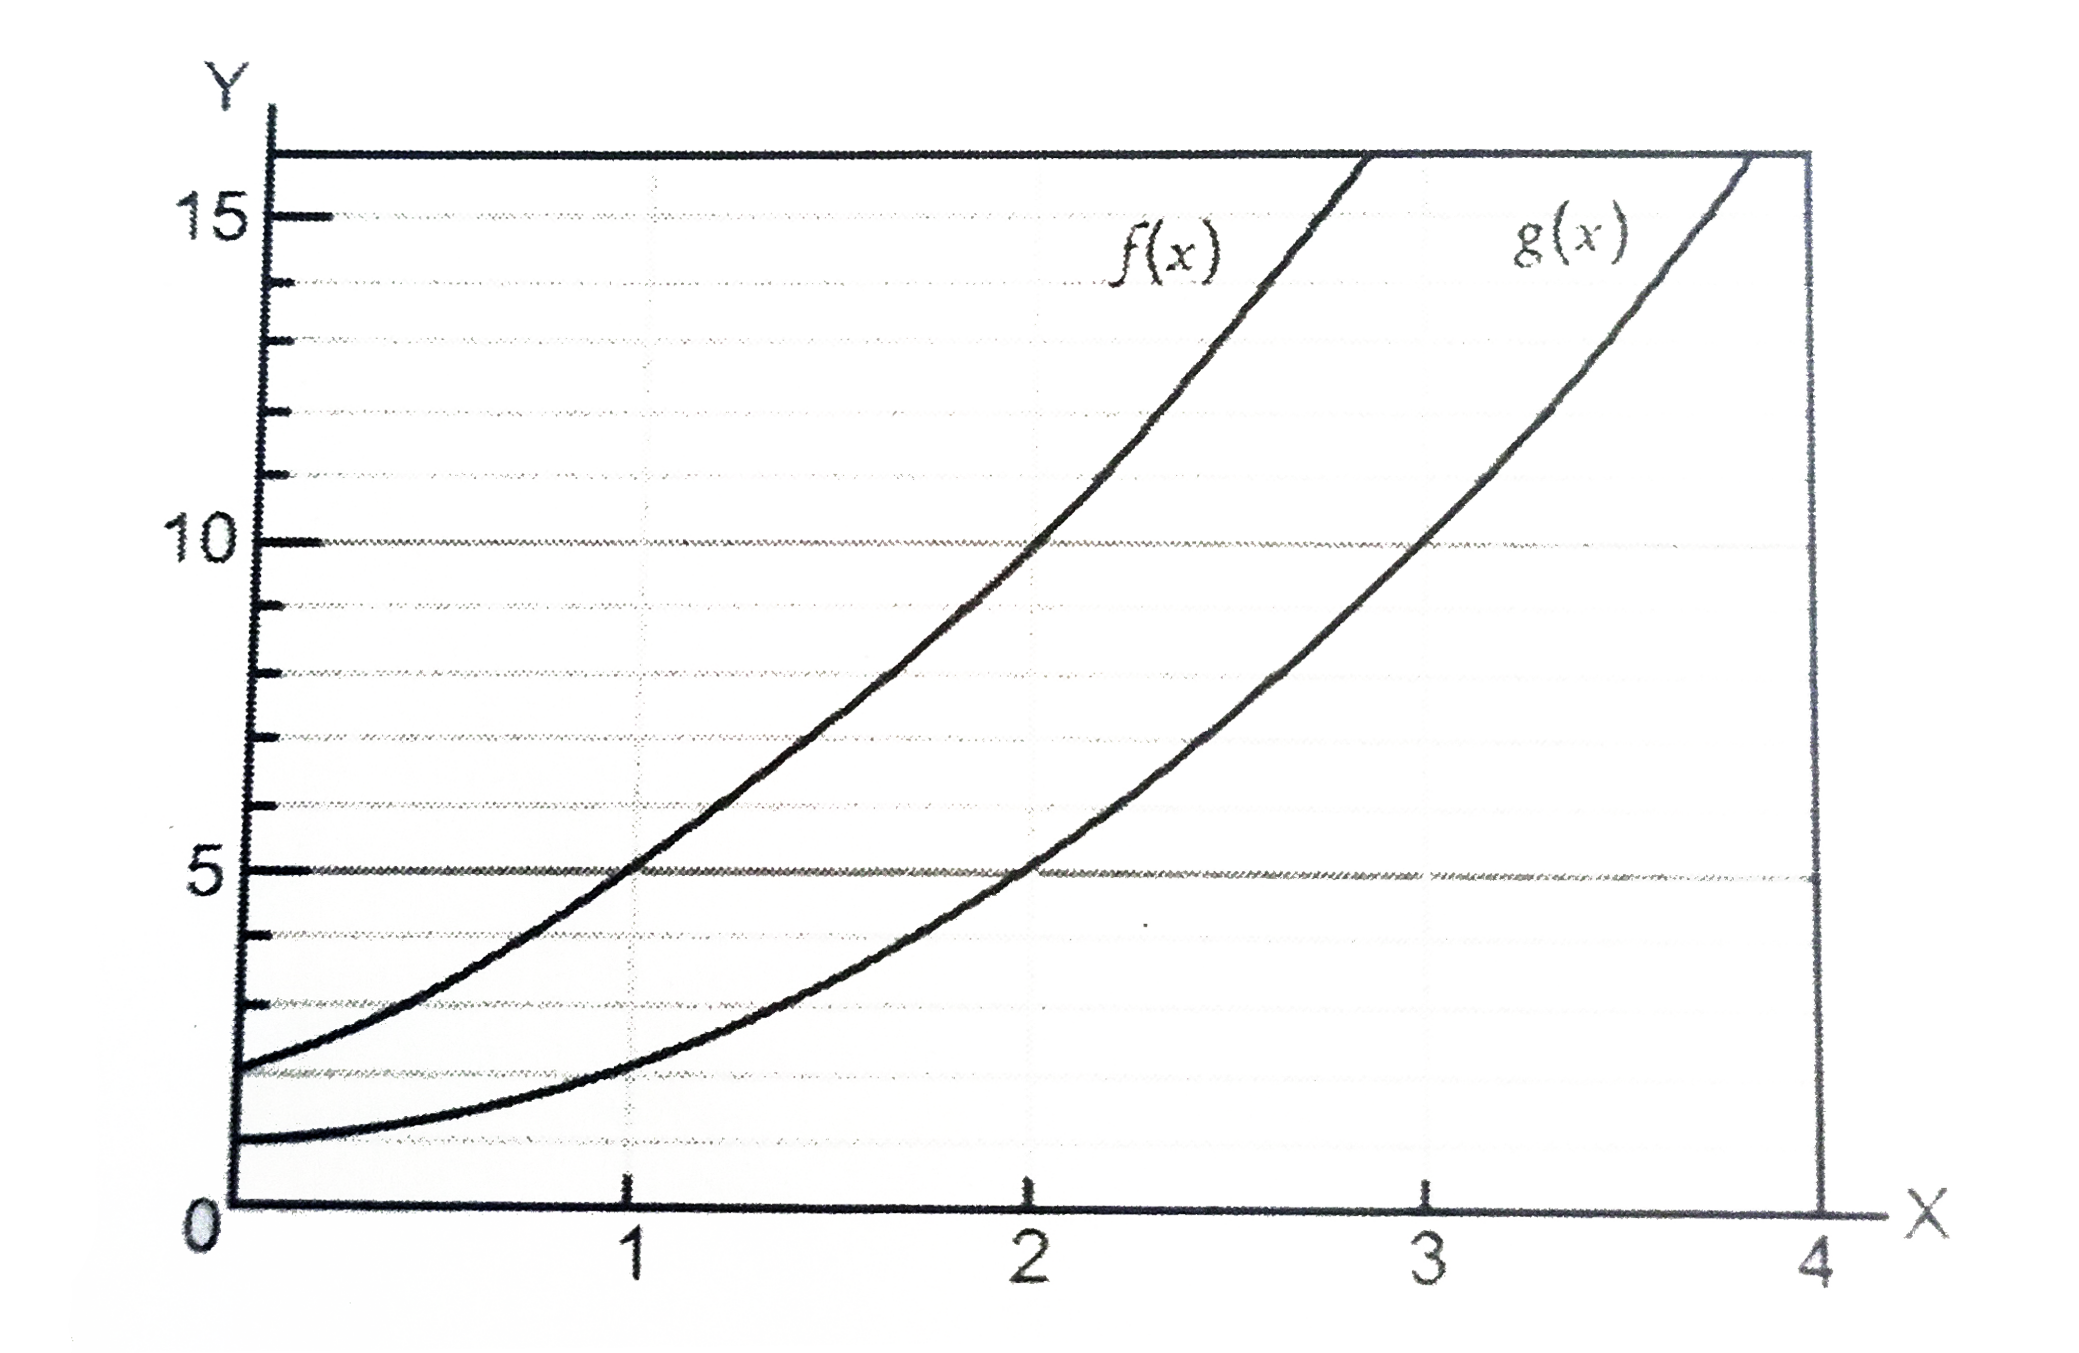
The graph of f(x) and g(x) are shown below. Which option is true?Af(x)=(x+2)2Bf(x)=x2+1Cg(x)=x2Dg(x)=x2+1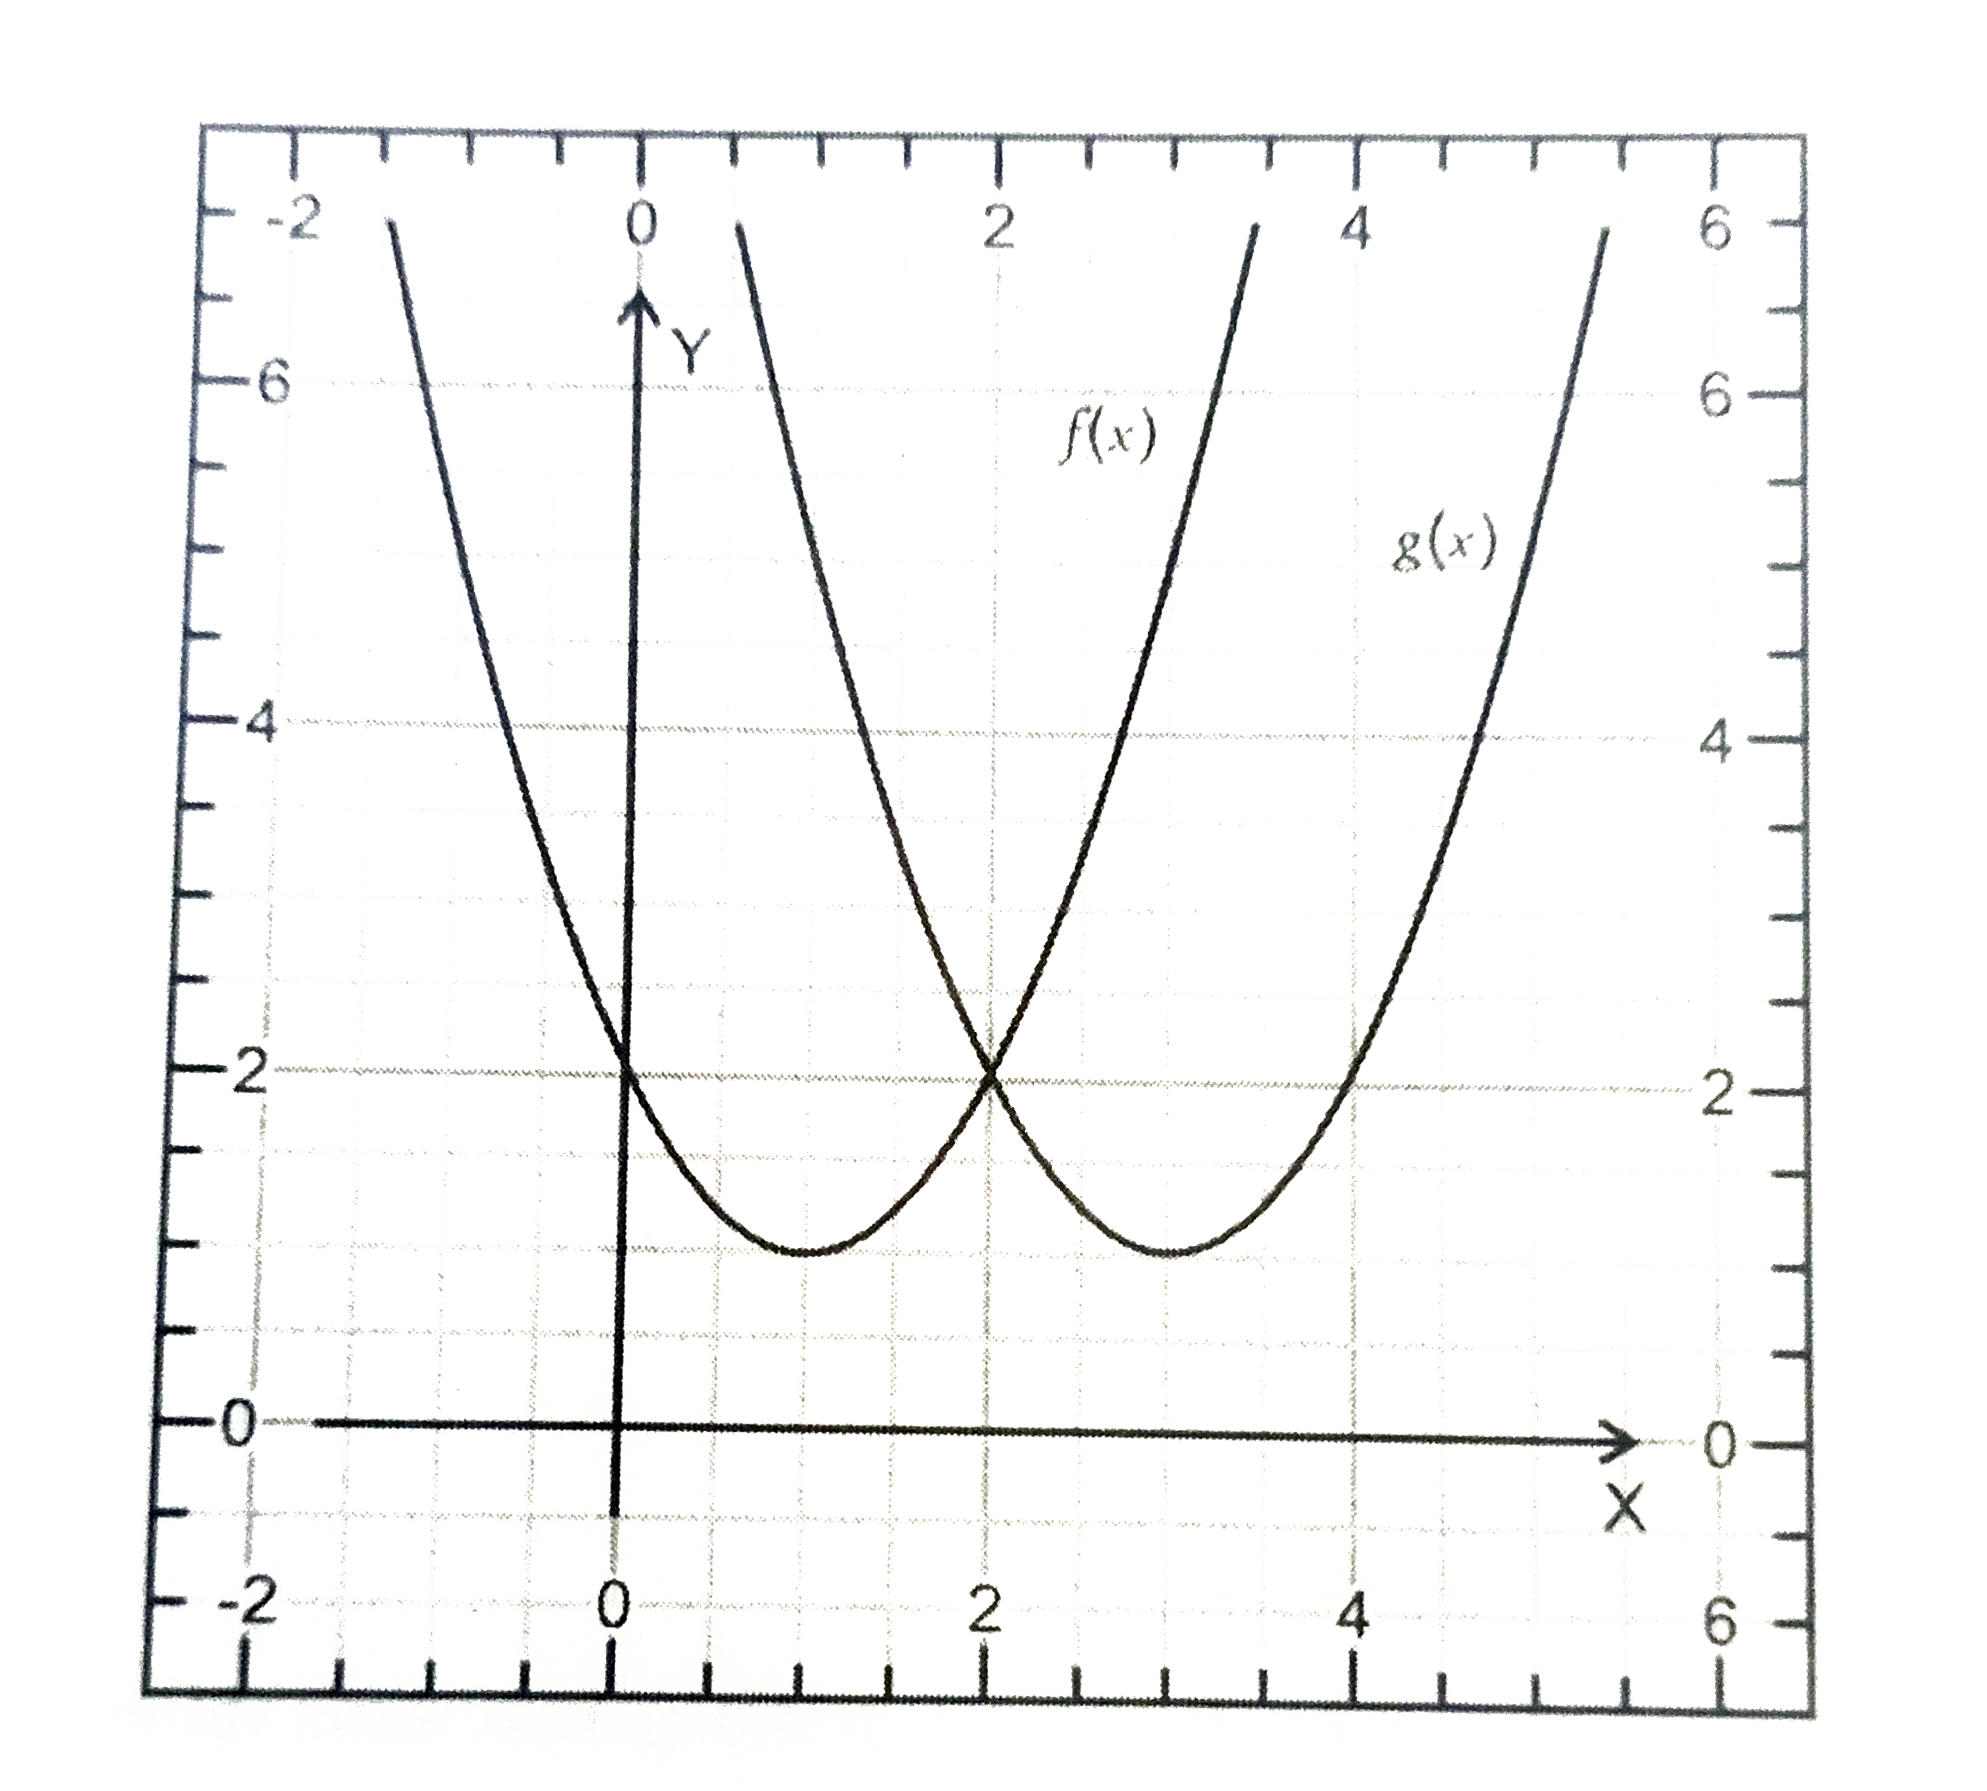
The graph of f(x) and g(x) are shown below. Which option is true?Ag(x)=f(x-2)Bg(x)-f(x)+1Cg(x)=f(x-1)Dg(x)=f(x)-2
Draw the graph of the following function.
2f(x)
View SolutionDraw the graph of the following function.
−f(x)
View SolutionDraw the graph of the following function.
f(−x)
View Solution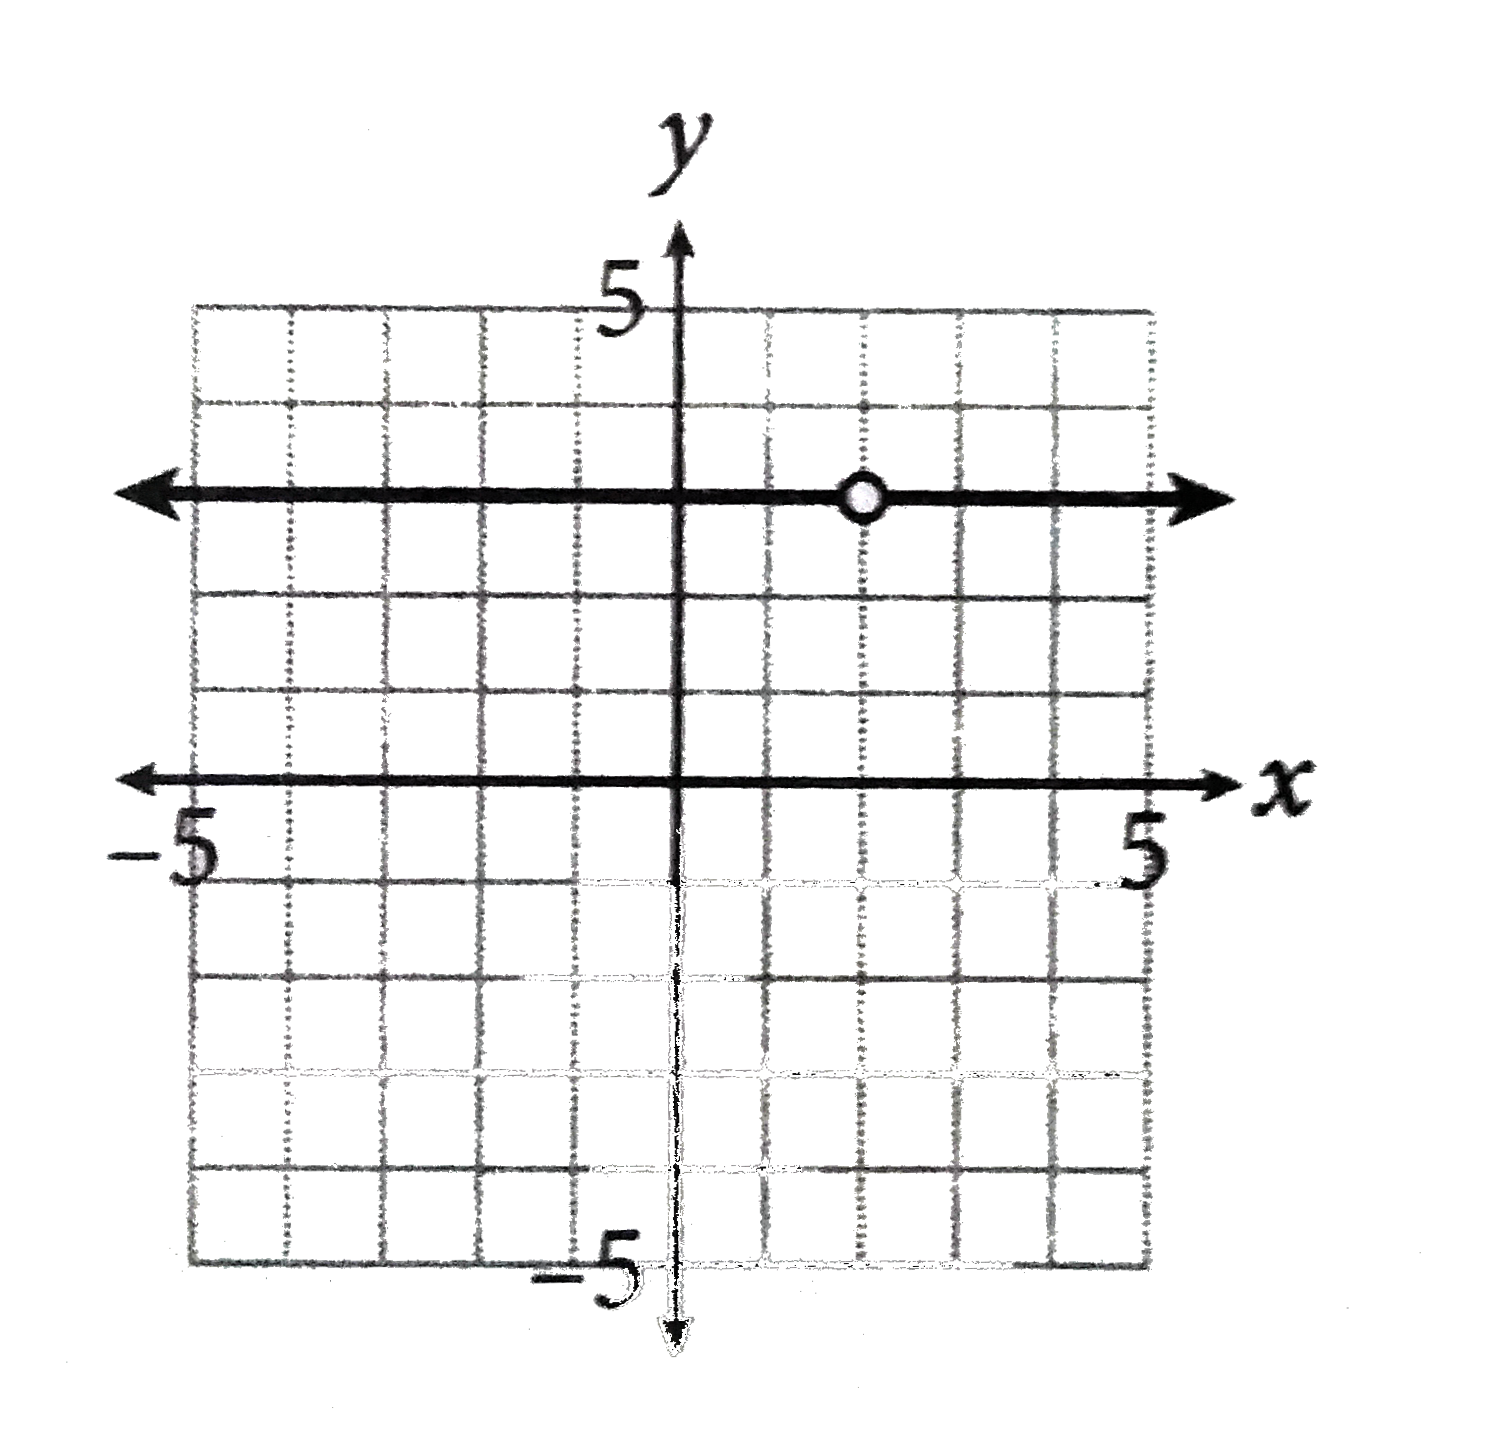
Which of the following rational functions could represent the graph shown?
View Solution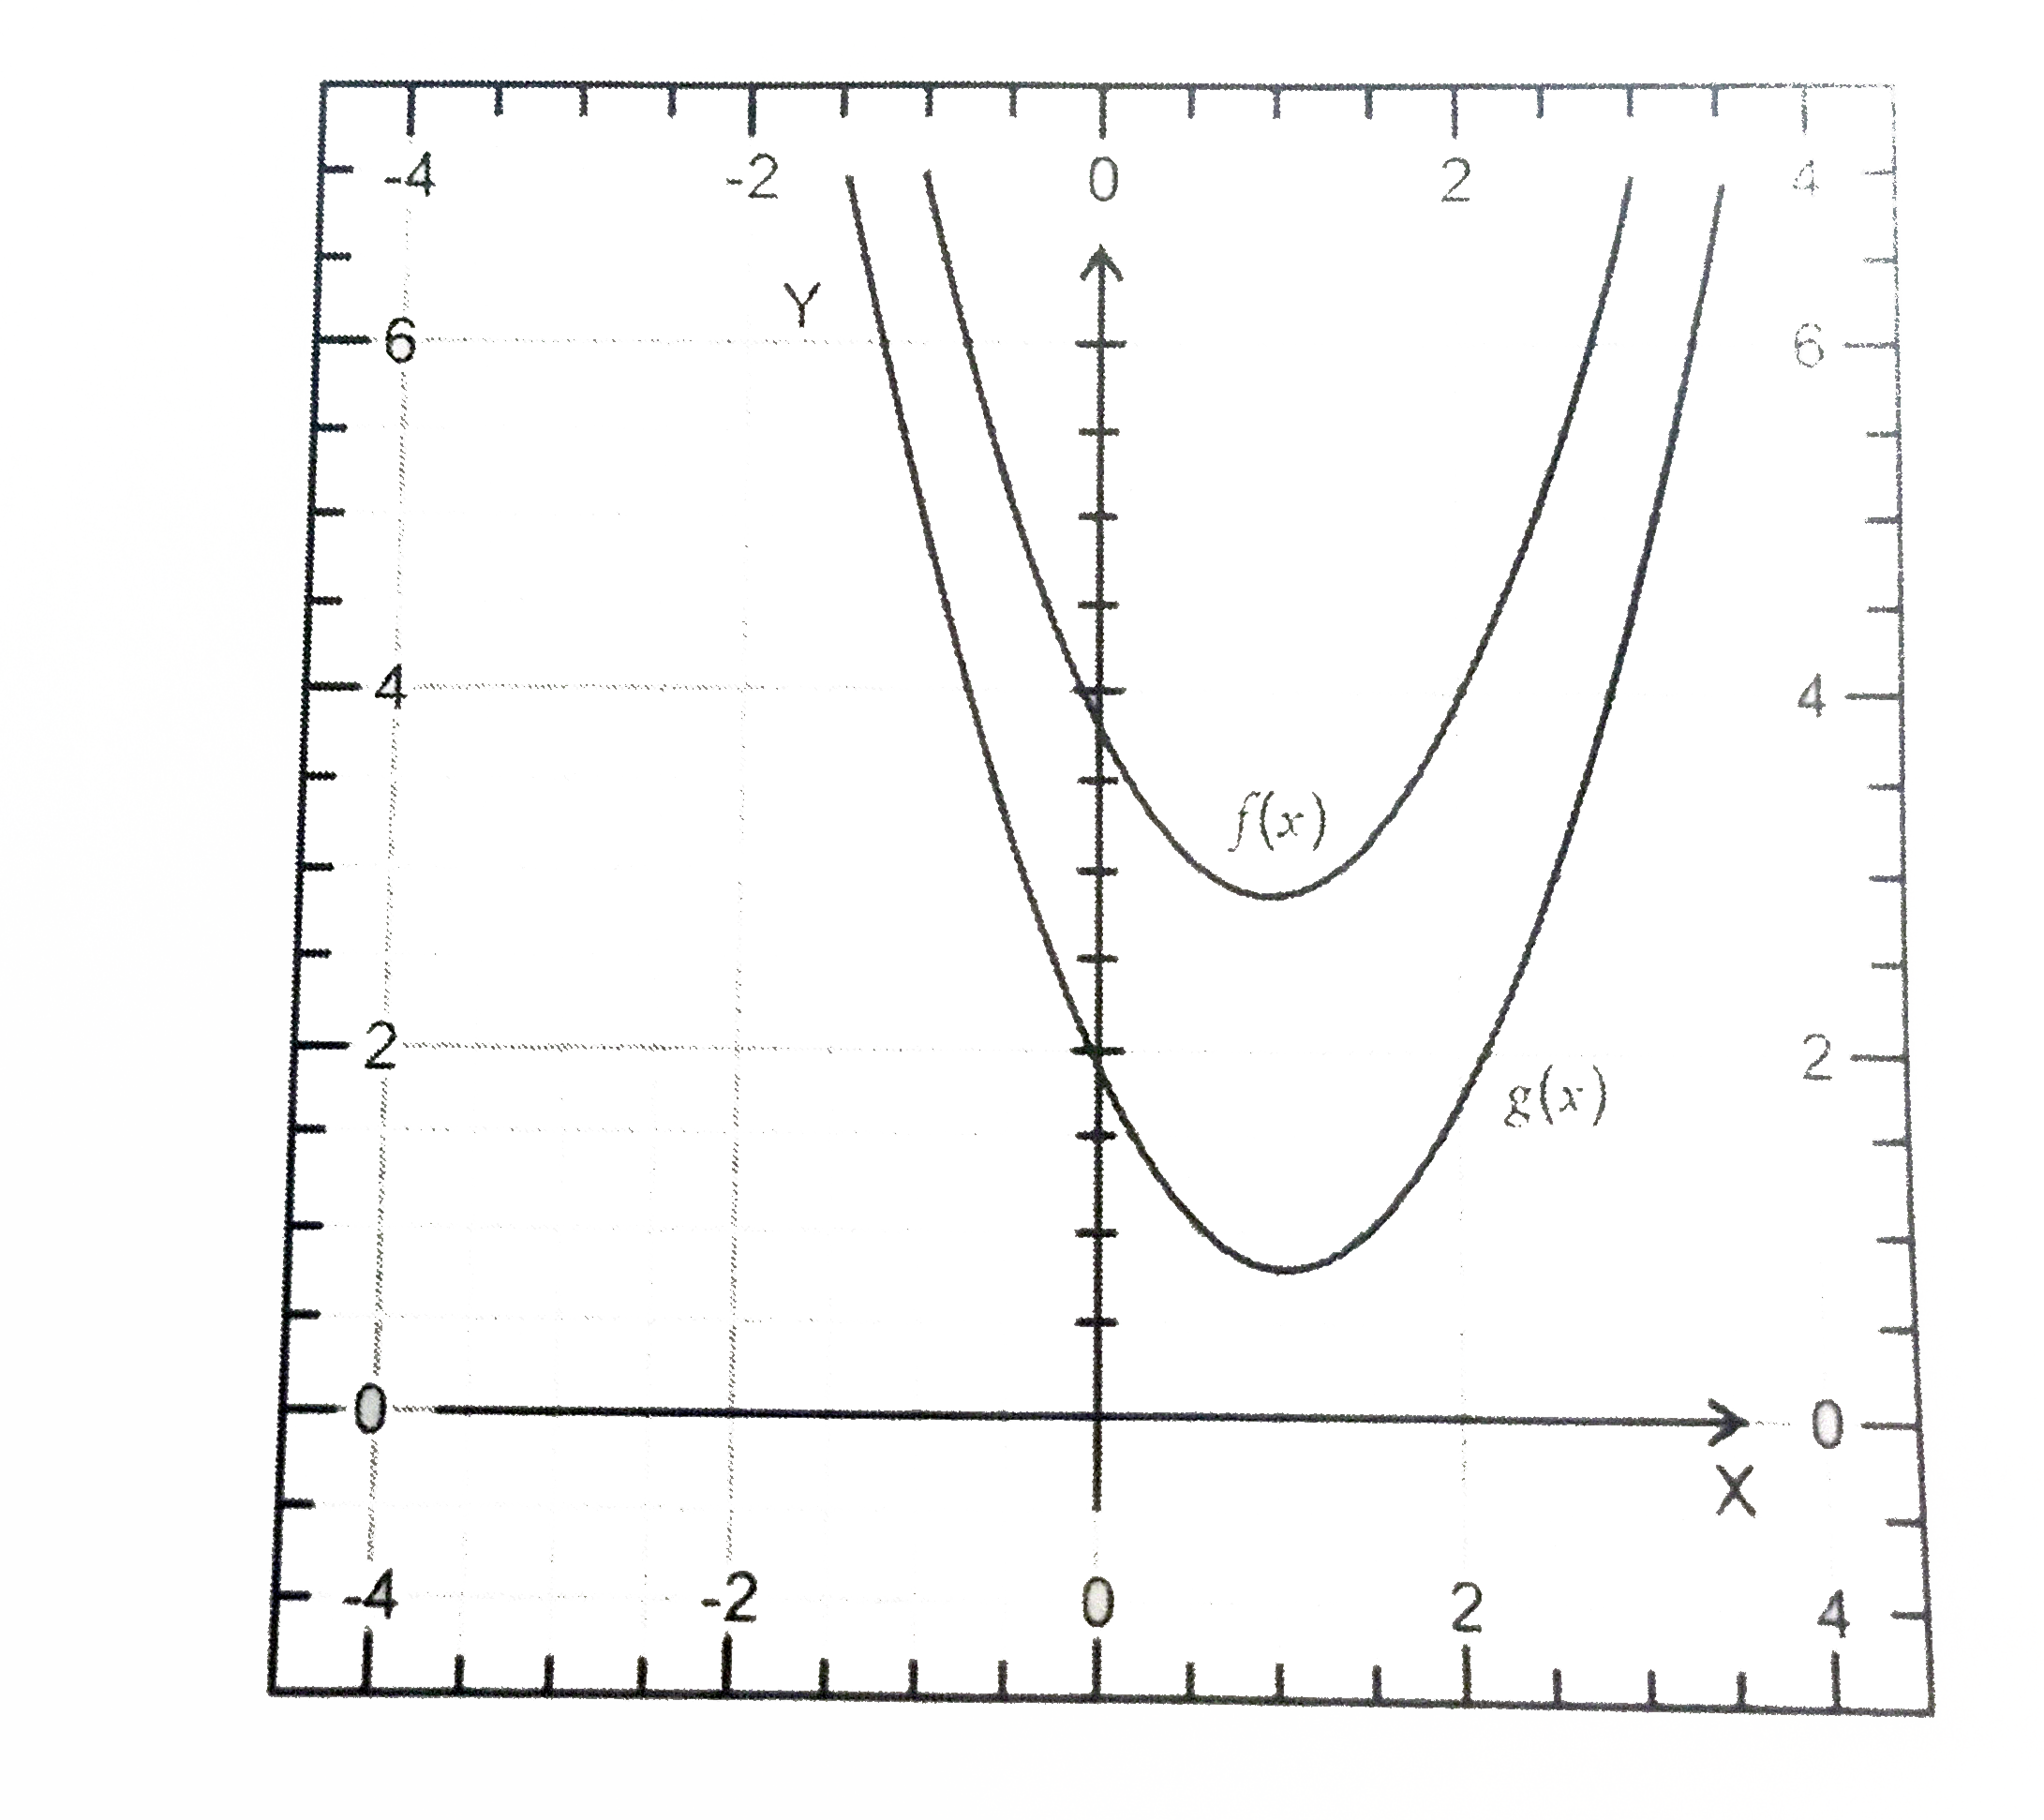
The graph of f(x) and g(x) are shown below. Which option is true?
View Solution

