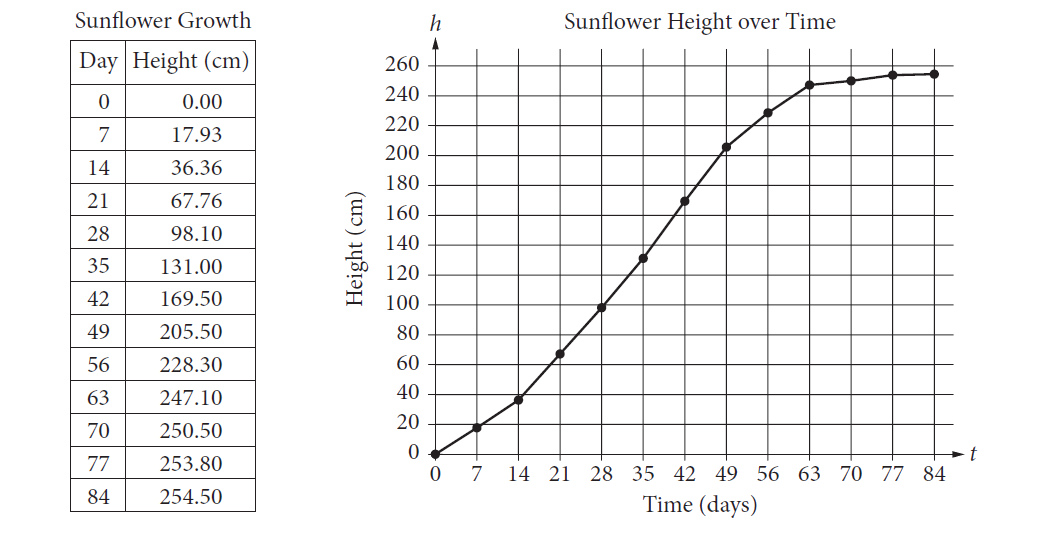
In 1919, H. S. Reed and R. H. Holland published a paper on the growth of sunflowers. Included in the paper were the table and graph above, which show the height h, in centimeters, of a sunflower t days after the sunflower begins to grow.
Over which of the following time periods is the average growth rate of the sunflower least?
Day 0 to Day 21
Day 21 to Day 42
Day 42 to Day 63
Day 63 to Day 84
The correct Answer is:D
The average growth rate of the sunflower over a certain time period is the increase in height of the sunflower over the period divided by the time. Symbolically, this rate is h(b)−h(a)b−a , where a and b are the first and the last day of the time period, respectively. Since
the time period for each option is the same (21 days), the total growth over the period can be used to evaluate in which time period the sunflower grew the least. According to the graph, the sunflower grew the least over the period from day 63 to day 84. Therefore, the sunflower’s average growth rate was the least from day 63 to day 84.
Alternate approach: The average growth rate of the sunflower over a certain time period is the slope of the line segment that joins the point on the graph at the beginning of the time period with the point on the graph at the end of the time period. Based on the graph, of the four time periods, the slope of the line segment is least between the sunflower’s height on day 63 and its height on day 84.
Choices A, B, and C are incorrect. On the graph, the line segment from day 63 to 84 is less steep than each of the three other line segments representing other periods. Therefore, the average growth rate of the sunflower is the least from day 63 to 84.
Similar Questions
The inequation that best describes the graph given below is _________
View SolutionThe inequation that best describes the following graph is _________
View SolutionWhich inequations represent the shaded region in the given figure
View SolutionWhich of the following statement is not correc for following straight line graph :-
ltimg src="https://d10lpgp6xz60nq.cloudfront.net/physics_images/ALN_PHY_R04_E01_015_Q01.png" width="80%"gt
View SolutionMatch the followings (column I with column II)
ltimg src="https://d10lpgp6xz60nq.cloudfront.net/physics_images/NCERT_BIO_XI_C03_E01_011_Q01.png" width="80%"gt
View Solution
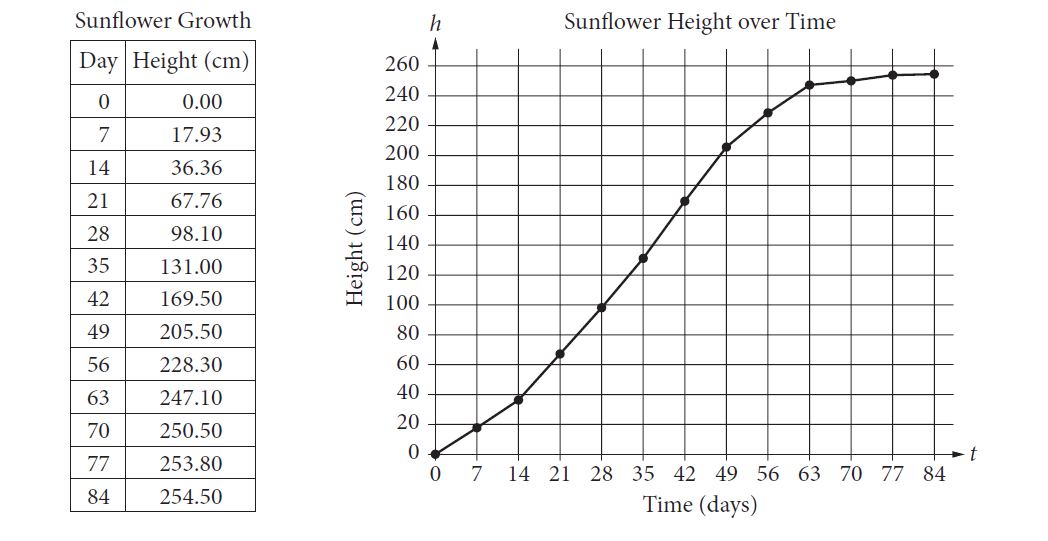
In 1919, H. S. Reed and R. H. Holland published a paper on the growth of sunflowers. Included in the paper were the table and graph above, which show the height h, in centimeters, of a sunflower t days after the sunflower begins to grow.
The function h, defined by h(t) = at + b , where a and b are constants, models the height, in centimeters, of the sunflower after t days of growth during a time period in which the growth is approximately linear. What does a represent?
View Solution
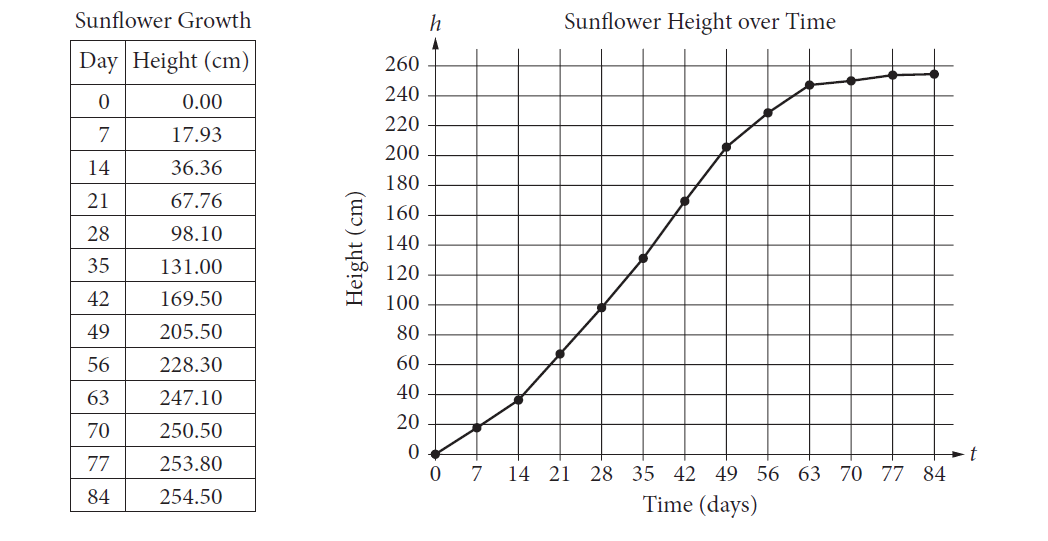
In 1919, H. S. Reed and R. H. Holland published a paper on the growth of sunflowers. Included in the paper were the table and graph above, which show the height h, in centimeters, of a sunflower t days after the sunflower begins to grow.
The growth rate of the sunflower from day 14 to day 35 is nearly constant. On this interval, which of the following equations best models the height h, in centimeters, of the sunflower t days after it begins to grow?
View Solution
