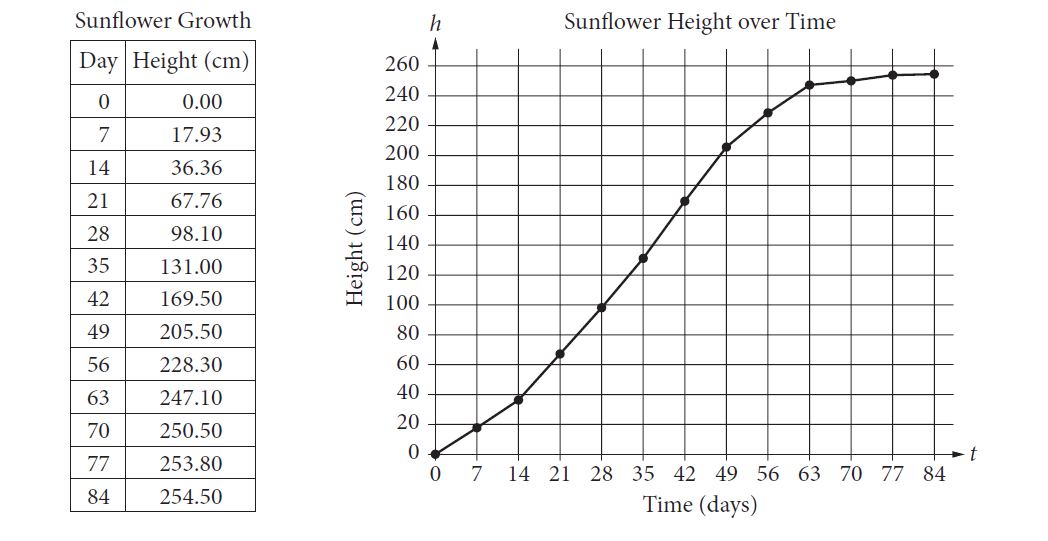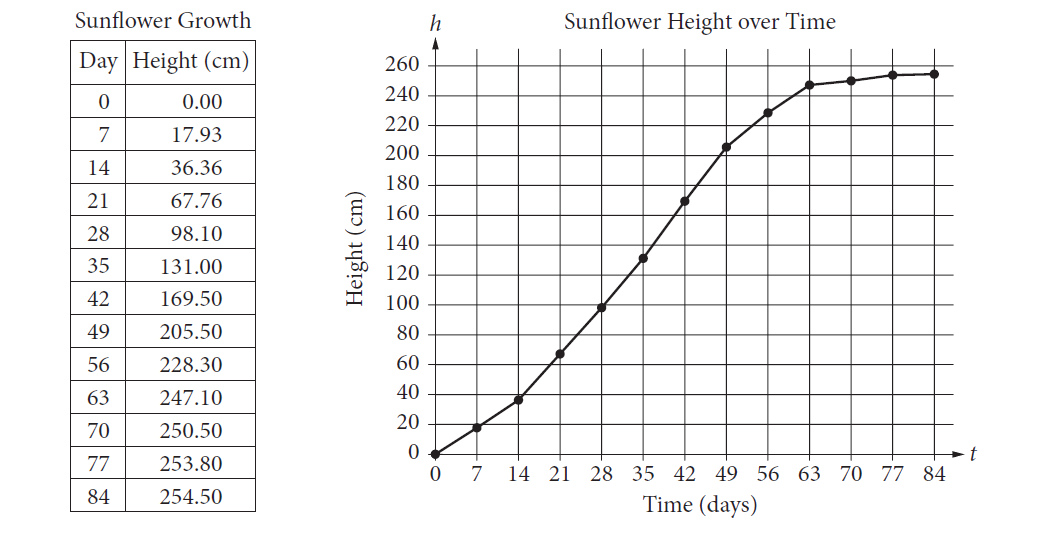
In 1919, H. S. Reed and R. H. Holland published a paper on the growth of sunflowers. Included in the paper were the table and graph above, which show the height h, in centimeters, of a sunflower t days after the sunflower begins to grow.
The function h, defined by h(t) = at + b , where a and b are constants, models the height, in centimeters, of the sunflower after t days of growth during a time period in which the growth is approximately linear. What does a represent?
The predicted number of centimeters the sunflower grows each day during the period
The predicted height, in centimeters, of the sunflower at the beginning of the period
The predicted height, in centimeters, of the sunflower at the end of the period
The predicted total increase in the height of the sunflower, in centimeters, during the period
The correct Answer is:A
Based on the definition and contextual interpretation of the function h, when the value of t increases by 1, the height of the sunflower increases by a centimeters. Therefore, a represents the predicted amount, in centimeters, by which the sunflower grows each day during the period the function models.
Choice B is incorrect. In the given model, the beginning of the period corresponds to t = 0, and since h(0) = b, the predicted height, in centimeters, of the sunflower at the beginning of the period is represented by b, not by a. Choice C is incorrect. If the period of time modeled by the function is c days long, then the predicted height, in centimeters, of the sunflower at the end of the period is represented by ac + b, not by a. Choice D is incorrect. If the period of time modeled by the function is c days long, the predicted total increase in the height of the sunflower, in centimeters, during that period is represented by the difference h(c) − h(0) = (ac + b) − (a · 0 + b), which is equivalent to ac, not a.
Similar Questions
The inequation that best describes the graph given below is _________
02:17View SolutionThe inequation that best describes the following graph is _________
02:10View SolutionWhich inequations represent the shaded region in the given figure
04:23View SolutionFollowing figure shows P-T graph for four processes A, B, C and D. Select the correct alternative ltimg src="https://d10lpgp6xz60nq.cloudfront.net/physics_images/ALN_PHY_R05_E09_007_Q01.png" width="80%"gt
03:37View SolutionIn the chemical reactions,
ltimg src="https://d10lpgp6xz60nq.cloudfront.net/physics_images/JM_10_CHE_P1_E01_009_S01.png" width="80%"gt
the compounds 'A' and 'B' respectively are01:42View SolutionMatch the items given in column A and B: ltimg src="https://d10lpgp6xz60nq.cloudfront.net/physics_images/NCERT_BIO_XII_C16_E01_004_Q01.png" width="80%"gt
06:00View Solution
In 1919, H. S. Reed and R. H. Holland published a paper on the growth of sunflowers. Included in the paper were the table and graph above, which show the height h, in centimeters, of a sunflower t days after the sunflower begins to grow.
Over which of the following time periods is the average growth rate of the sunflower least?View Solution

