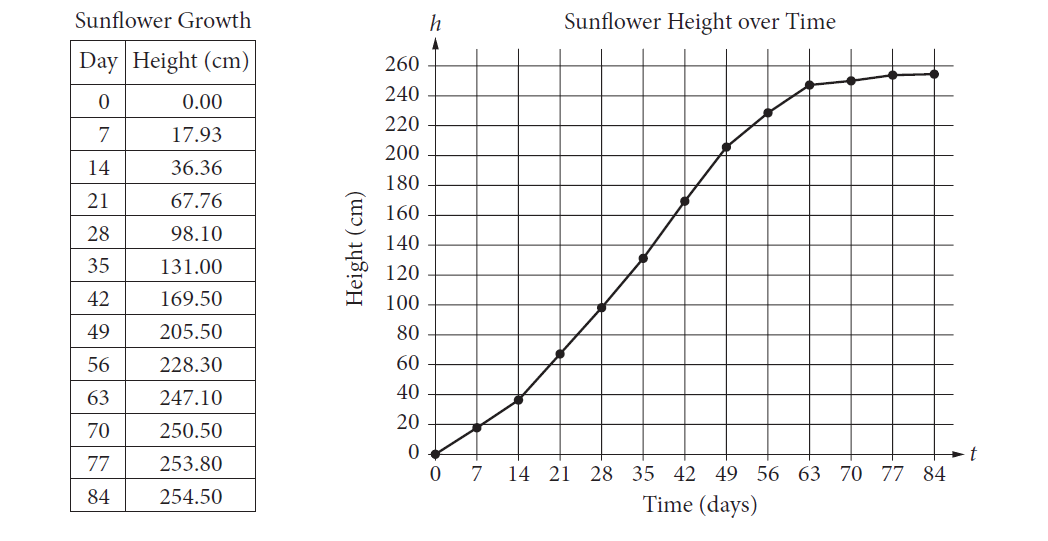
In 1919, H. S. Reed and R. H. Holland published a paper on the growth of sunflowers. Included in the paper were the table and graph above, which show the height h, in centimeters, of a sunflower t days after the sunflower begins to grow.
The growth rate of the sunflower from day 14 to day 35 is nearly constant. On this interval, which of the following equations best models the height h, in centimeters, of the sunflower t days after it begins to grow?
h = 2.1t − 15
h = 4.5t − 27
h = 6.8t − 12
h = 13.2t − 18
The correct Answer is:B
According to the table, the height of the sunflower is 36.36 cm on day 14 and 131.00 cm on day 35. Since the height of the sunflower between day 14 and day 35 changes at a nearly constant rate, the height of the sunflower increases by approximately 131.00−36.3635−14≈4.5 cm per day. Therefore, the equation that models the height of the
sunflower t days after it begins to grow is of the form h = 4.5t + b. Any ordered pair (t, h) from the table between day 14 and day 35 can be used to estimate the value of b. For example, substituting the ordered pair (14, 36.36) for (t, h) into the equation h = 4.5t + b gives 36.36 = 4.5(14) + b. Solving this for b yields b = −26.64. Therefore, of the given choices, the equation h = 4.5t − 27 best models the height h, in centimeters, of the sunflower t days after it begins to grow.
Choices A, C, and D are incorrect because the growth rates of the sunflower from day 14 to day 35 in these choices are significantly higher or lower than the true growth rate of the sunflower as shown in the graph or the table. These choices may result from considering time periods different from the period indicated in the question or from calculation errors.
Similar Questions
The inequation that best describes the graph given below is _________
View SolutionThe inequation that best describes the following graph is _________
View SolutionWhich inequations represent the shaded region in the given figure
View SolutionFrom the following figure, the correct observation is :- ltimg src="https://d10lpgp6xz60nq.cloudfront.net/physics_images/ALN_PHY_R03_E08_015_Q01.png" width="80%"gt
View Solution
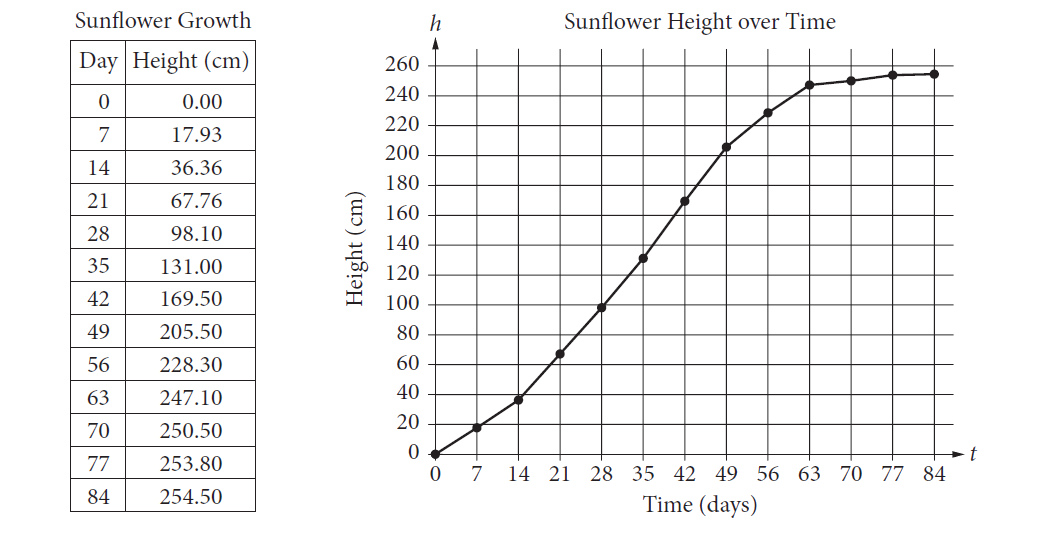
In 1919, H. S. Reed and R. H. Holland published a paper on the growth of sunflowers. Included in the paper were the table and graph above, which show the height h, in centimeters, of a sunflower t days after the sunflower begins to grow.
Over which of the following time periods is the average growth rate of the sunflower least?
View Solution
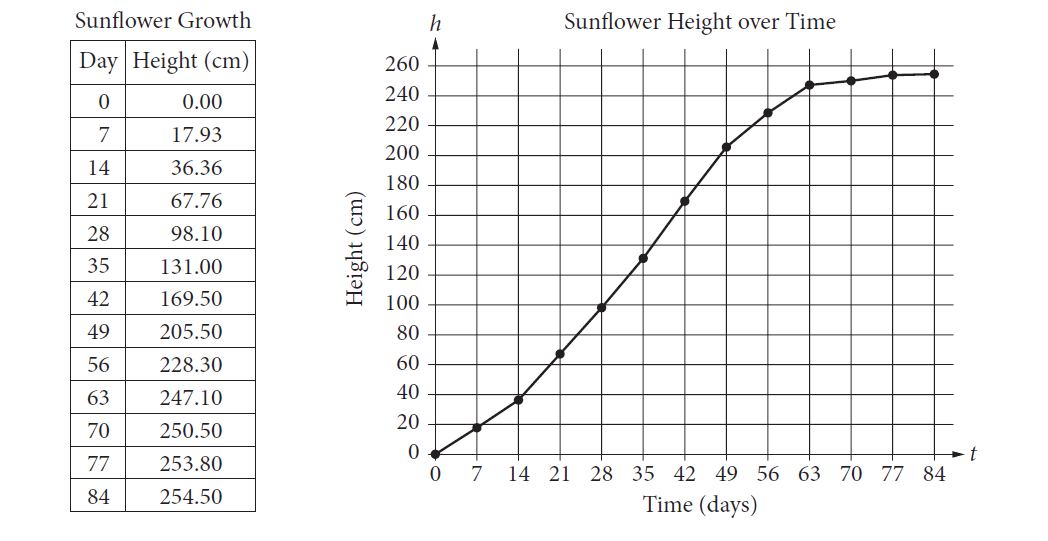
In 1919, H. S. Reed and R. H. Holland published a paper on the growth of sunflowers. Included in the paper were the table and graph above, which show the height h, in centimeters, of a sunflower t days after the sunflower begins to grow.
The function h, defined by h(t) = at + b , where a and b are constants, models the height, in centimeters, of the sunflower after t days of growth during a time period in which the growth is approximately linear. What does a represent?
View Solutionপোস্ত ও সূর্যমুখী ফুল দিনের বেলা ফোটে এটি কোন ধরনের চলন।
View Solution
