Following figure shows P-T graph for four processes A, B, C and D. Select the correct alternative

A-Isobaric process
B-Adiabatic process
C-Isochoric process
D-Isothermal process
The correct Answer is:C
Step by step video & image solution for Following figure shows P-T graph for four processes A, B, C and D. Select the correct alternative by Physics experts to help you in doubts & scoring excellent marks in Class 12 exams.
Updated on:21/07/2023Topper's Solved these Questions
- RACEBOOK - ALLENCHAPTER - RACEEXERCISE - Basic Maths (Dscillations) (Kinematics of SHM)
20 Videos
- RACEBOOK - ALLENCHAPTER - RACEEXERCISE - Basic Maths (Oscillations) (Energy & spring pendulum)
16 Videos
- RACEBOOK - ALLENCHAPTER - RACEEXERCISE - Basic Maths (Thermal Physics) (Kinetic theory of gasess)
13 Videos
- NEWTONS LAWS OF MOTIONBOOK - ALLENCHAPTER - NEWTONS LAWS OF MOTIONEXERCISE - EXERCISE-III
28 Videos
- SIMPLE HARMONIC MOTIONBOOK - ALLENCHAPTER - SIMPLE HARMONIC MOTIONEXERCISE - Example
1 Videos
Similar Questions
The figure shows four animals (A), (B) ,(C) and (D) . Select the incorrect answer with respect to a common characteristic of these animals .

View SolutionThe following questions consists of four problem figures marked as A, B, C and D . Select a figure In place of '?' for E which will continue the series established by the four problem figures A, B, C, D

View Solution
Knowledge Check
The figure shows four animals (A), (B), ( C) and (D). Select the correct answer with respect to common characteristics of two of these animals.
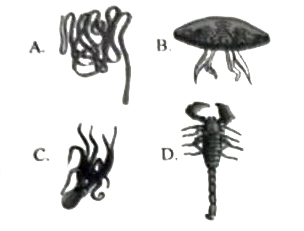 A(A) and (D) have enidoblasts for self-defense.B( C) and (D) have a true coelom.C(A) and (D) respire mainly through book lungs.D(B) and ( C) show radial symmetry.
The graph given below shows the P-V plot for a process on an ideal gas. Select the correct statement.
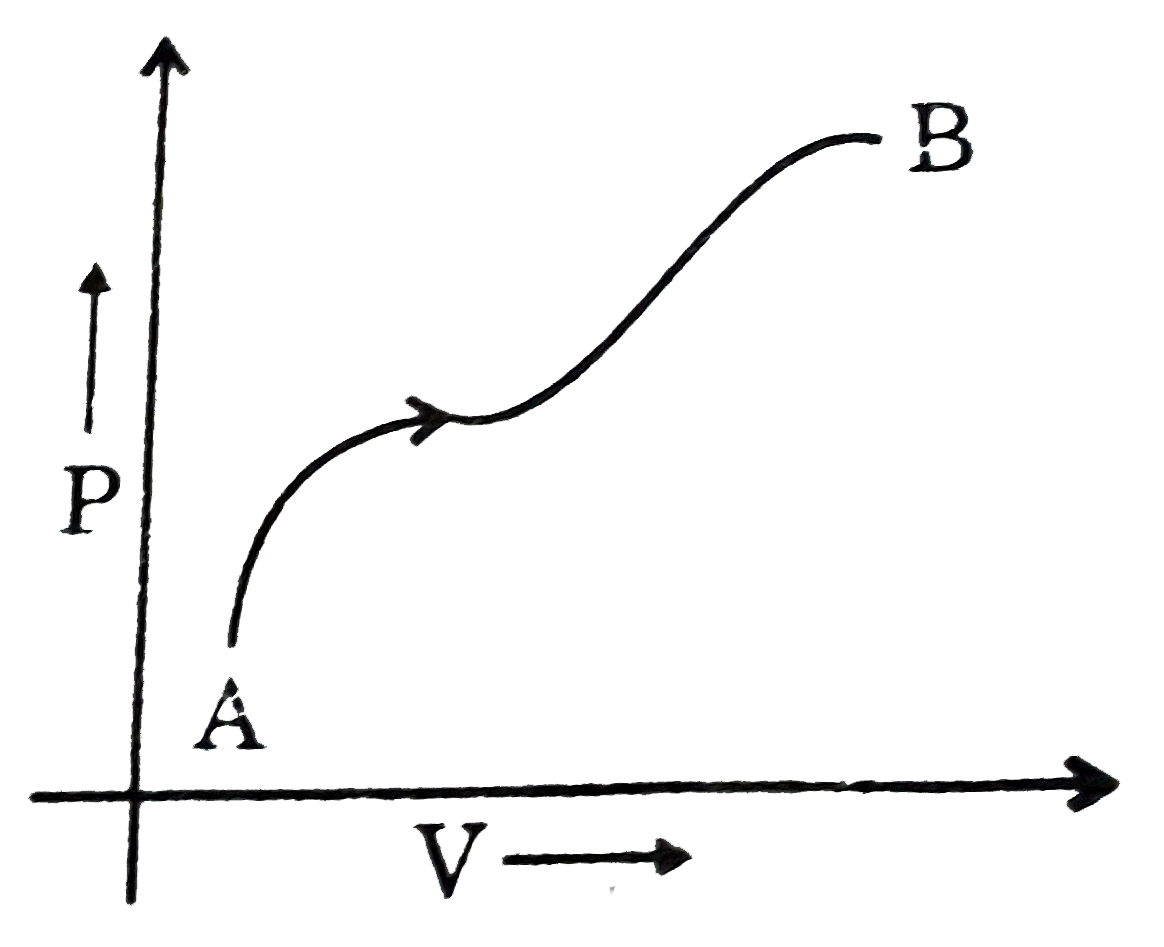 AEnthalpy content of the gas is constantly increasing and the process is carried out slowlyBEnthalpy content of the gas first increases then decreases and the process is quasistaticlyCEnthalpy content of the gas is constant and the process taken infinite amount of time for completionDEnthalpy content first decreases then increases and the process is reversible
A P-T graph is shown for a cyclic process. Select correct statement regarding this
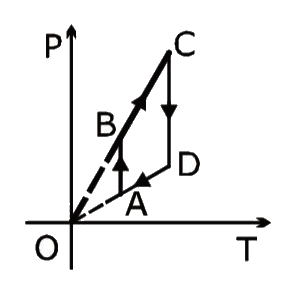 ADuring process CD, work done by gas is negativeBDuring process AB, work done by the gas is positiveCDuring process BC internal energy of system decreaseDDuring process BC internal energy of system increases
Question figure is followed by four Answer figures namely A, B, C and D. Find out the correct Answer figure from the given alternatives in which Question figure is hidden.
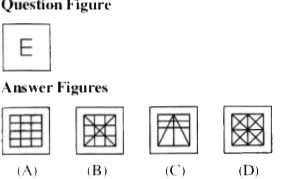
View SolutionQuestion figure is followed by four Answer figures namely A, B, C and D. Find out the correct Answer figure from the given alternatives in which Question figure is hidden.
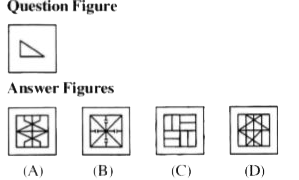
View SolutionQuestion figure is followed by four Answer figures namely A, B, C and D. Find out the correct Answer figure from the given alternatives in which Question figure is hidden.
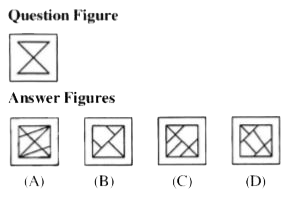
View SolutionQuestion figure is followed by four Answer figures namely A, B, C and D. Find out the correct Answer figure from the given alternatives in which Question figure is hidden.
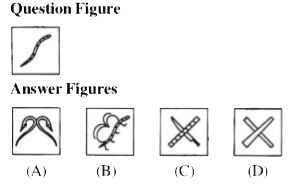
View SolutionQuestion figure is followed by four Answer figures namely A, B, C and D. Find out the correct Answer figure from the given alternatives in which Question figure is hidden.
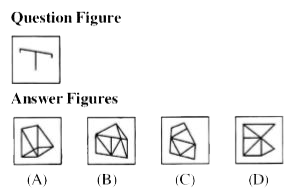
View Solution
