The tables below give the distribution of high temperatures in degrees Fahrenheit (°F) for City A and City B over the same 21 days in March
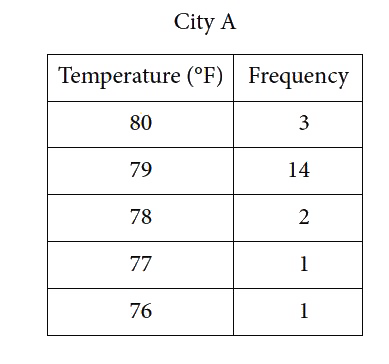
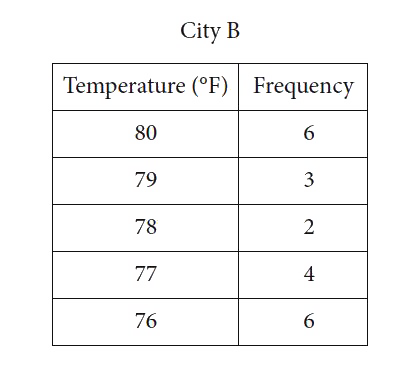
Which of the following is true about the data shown for these 21 days?
The standard deviation of temperatures in City A is larger.
The standard deviation of temperatures in City B is larger.
The standard deviation of temperatures in City A is the same as that of City B.
The standard deviation of temperatures in these cities cannot be calculated with the data provided.
The correct Answer is:B
The standard deviation is a measure of how far the data set values are from the mean. In the data set for City A, the large majority of the data are in three of the five possible values, which are the three values closest to the mean. In the data set for City B, the data are more spread out, with many values at the minimum and maximum values. Therefore, by observation, the data for City B have a larger standard deviation.
Alternatively, one can calculate the mean and visually inspect the difference between the data values and the mean. For City A the mean is 165521≈78.8, and for City B the mean is 163721≈78.0 . The data for City A are closely clustered near 79, which indicates a small standard deviation. The data for City B are spread out away from 78, which indicates a larger standard deviation. Choices A, C, and D are incorrect and may be the result of misconceptions about the standard deviation.
Similar Questions
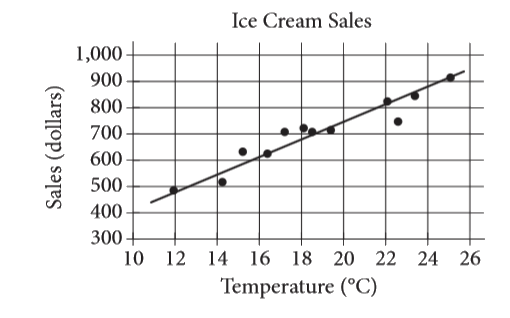
The scatterplot above shows a company’s ice cream sales d, in dollars, and the high temperature t, in degrees Celsius (.∘C), on 12 different days. A line of best fit for the data is also shown. Which of the following could be an equation of the line of best fit?
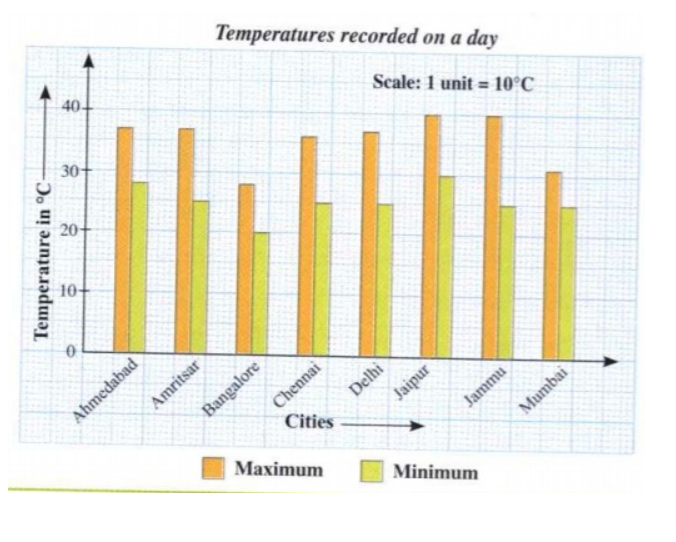
View SolutionThe following graph gives the minimum and maximum temperatures of various cities on a specific day. Read the graph and answer the following questions
Which are the hottest and the coldest cities on the given day?
View Solution
Knowledge Check
C=59(F−32)
The equation above shows how a temperature F, measured in degrees Fahrenheit, relates to a temperature C, measured in degrees Celsius. Based on the equation, which of the following must be true?
I. A temperature increase of 1 degree Fahrenheit is equivalent to a temperature increase of 59 degree Celsius.
II. A temperature increase of 1 degree Celsius is equivalent to a temperature increase of 1.8 degrees Fahrenheit.
III. A temperature increase of 59 degree Fahrenheit is equivalent to a temperature increase of 1 degree Celsius.AI onlyBII onlyCIII onlyDI and II only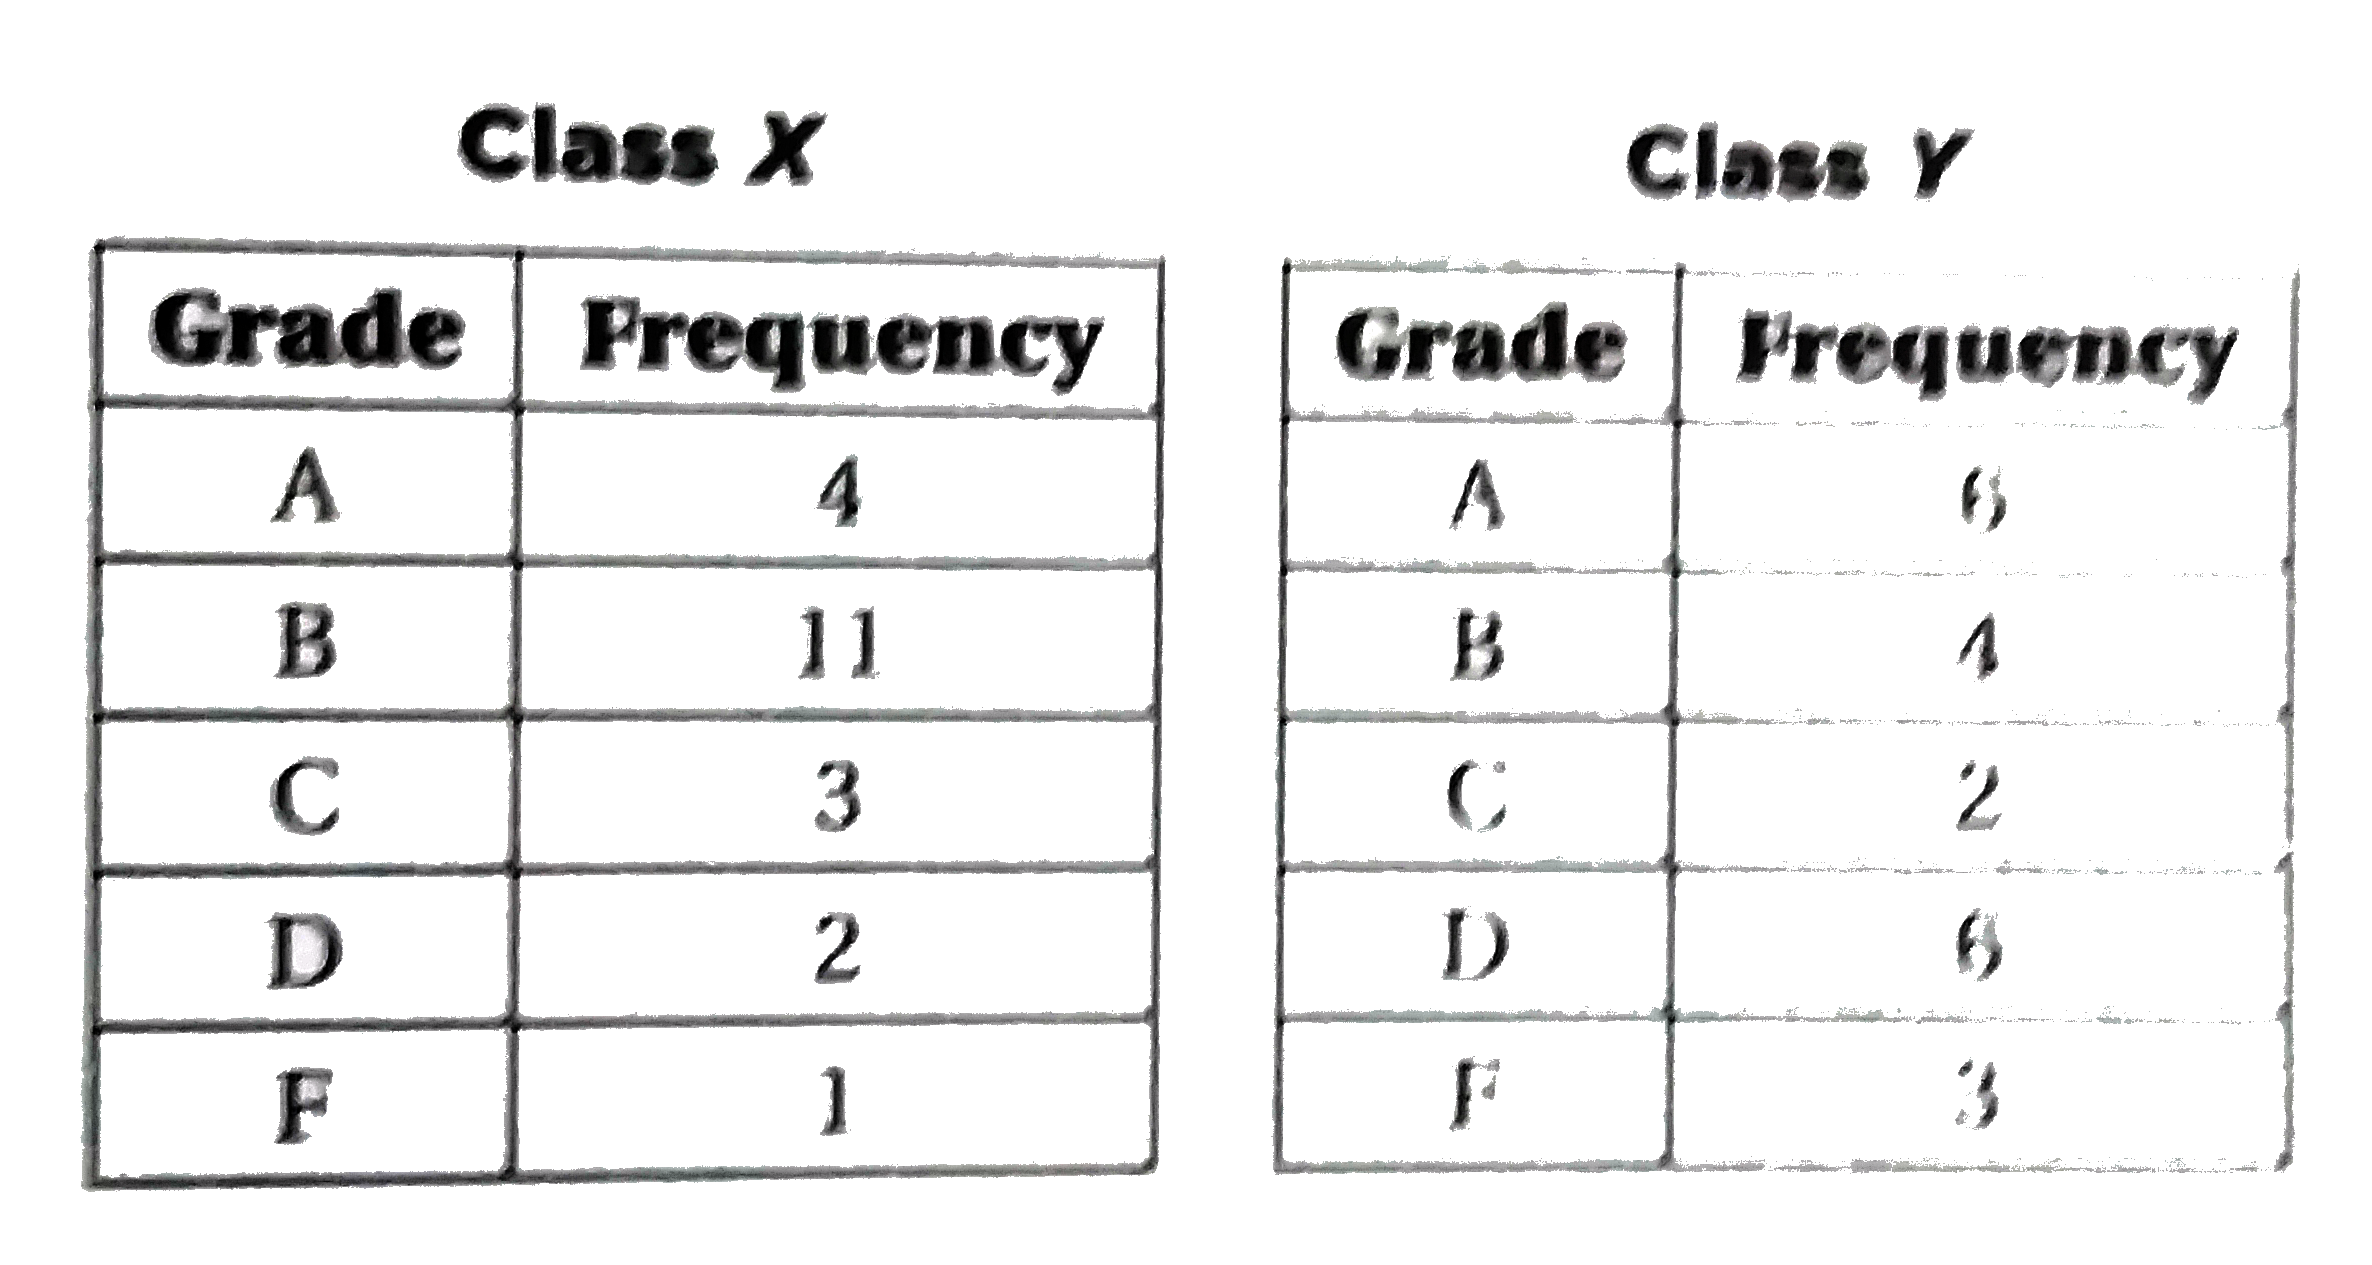
The tables give the distribution of grades for 21 students in two different college mathematics classes. For purposes of making statistical calculations, A=4,B=3,C=2,D=1,andF=0. Which of the following statements is true about the data shown for these two classes?
I. The standard deviation of grades is greater for class X.
II. the standard deviation of grades is greater for class Y.
III. The median letter grade is the same for classes X and Y.AI onlyBII onlyCI and III onlyDII and III only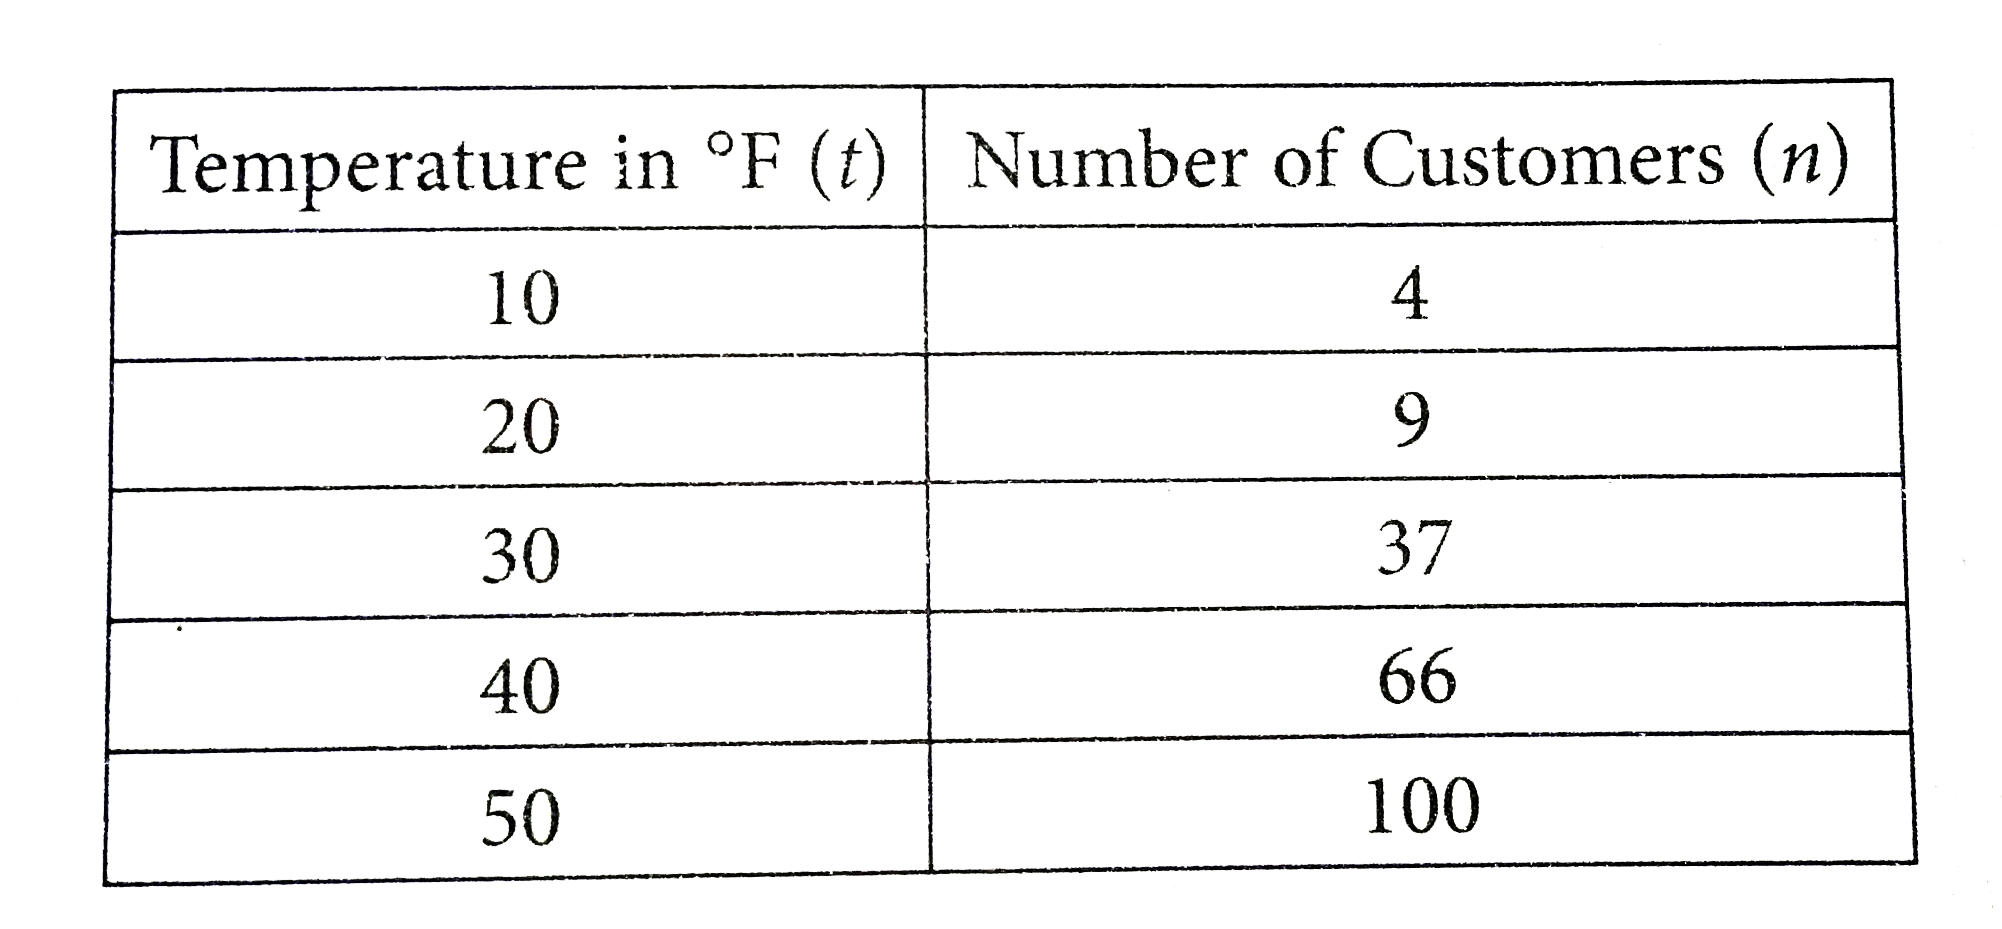
A coffee shop noticed that the outside temperature affected the number of customers who came to the shop that day, as shown in the table above. Which of the following graphs best represents the relationship between the outside temperature t, and the number of customers,n, as indicated by the table?A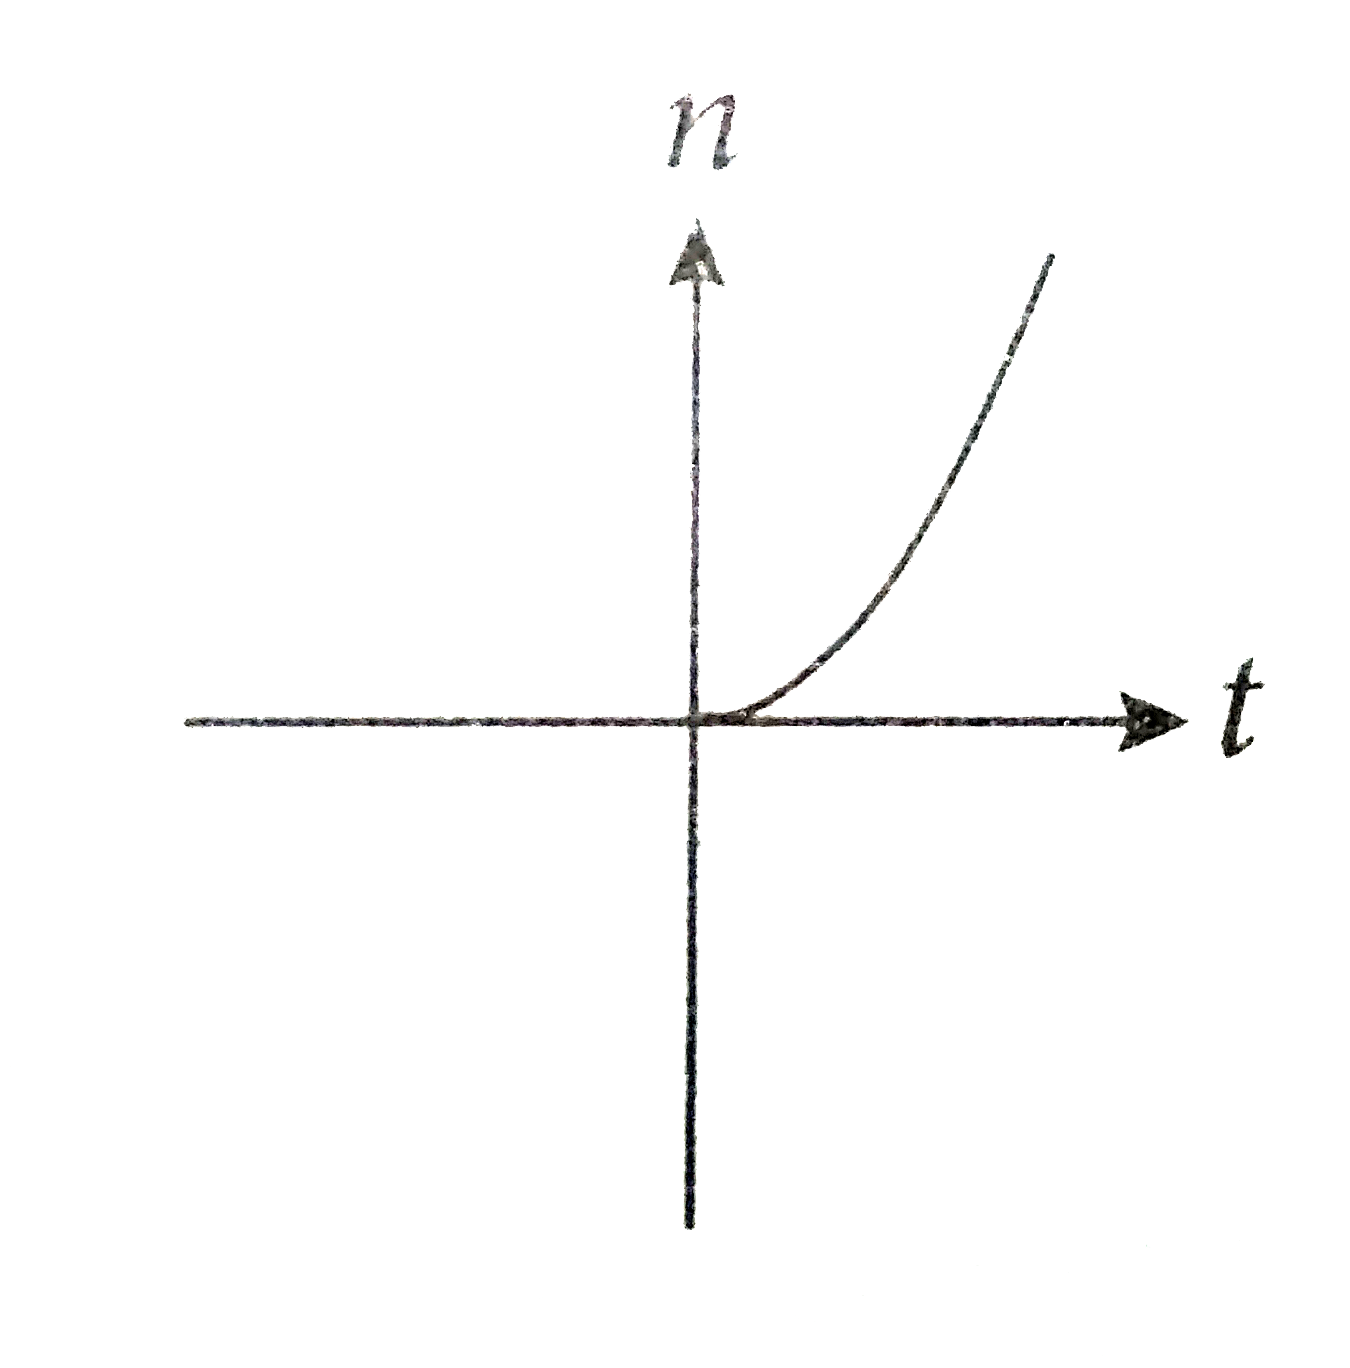 B
B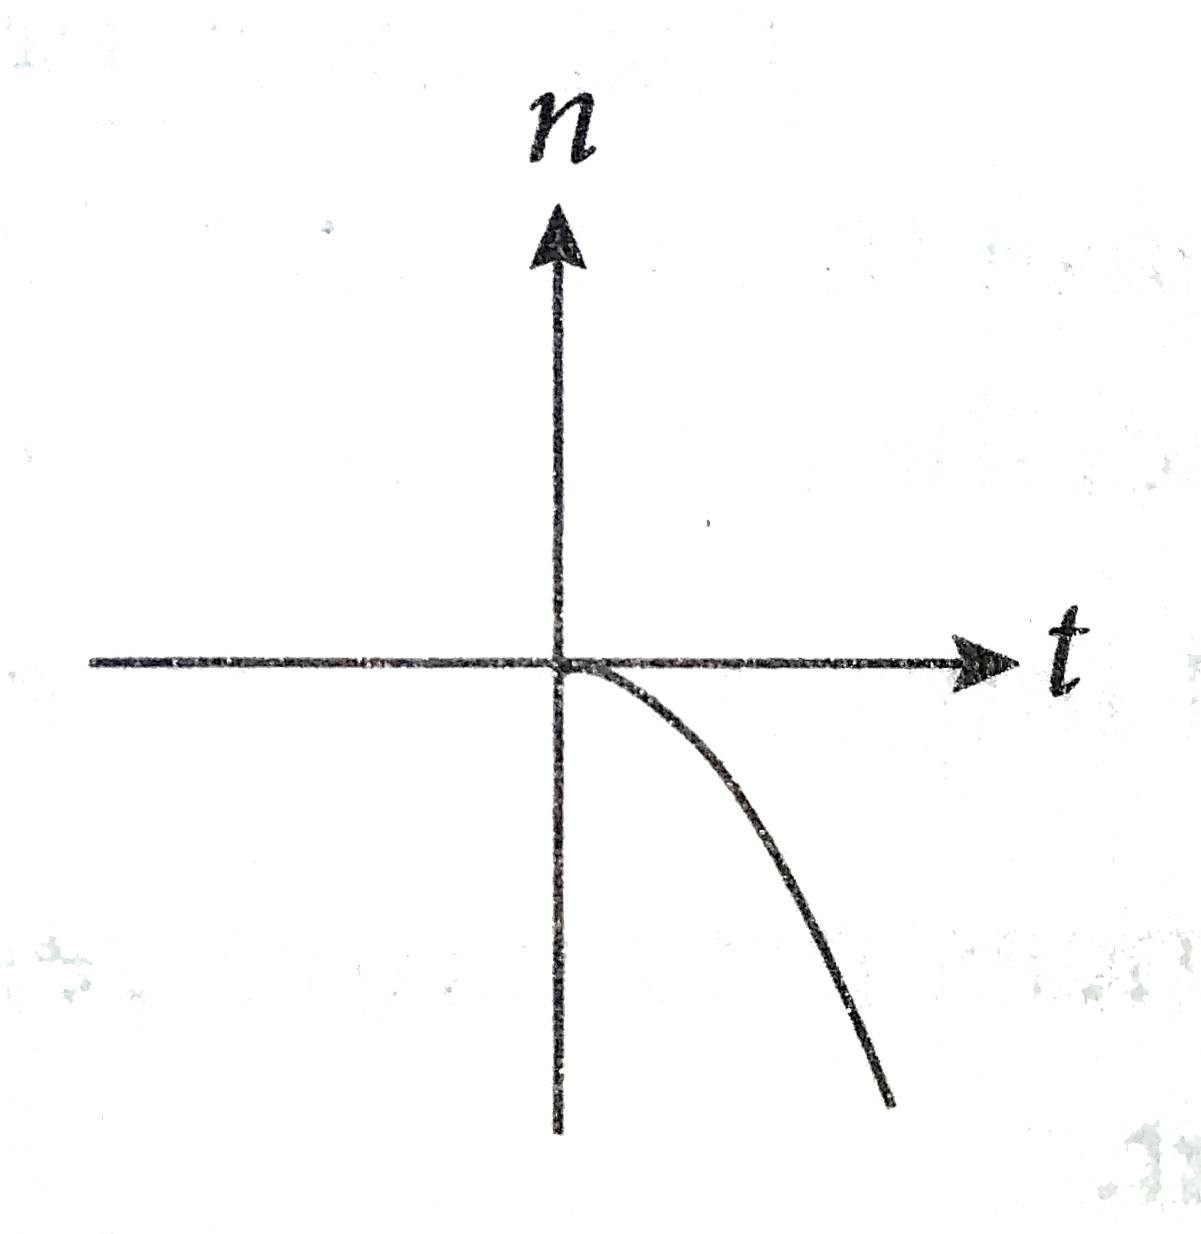 C
C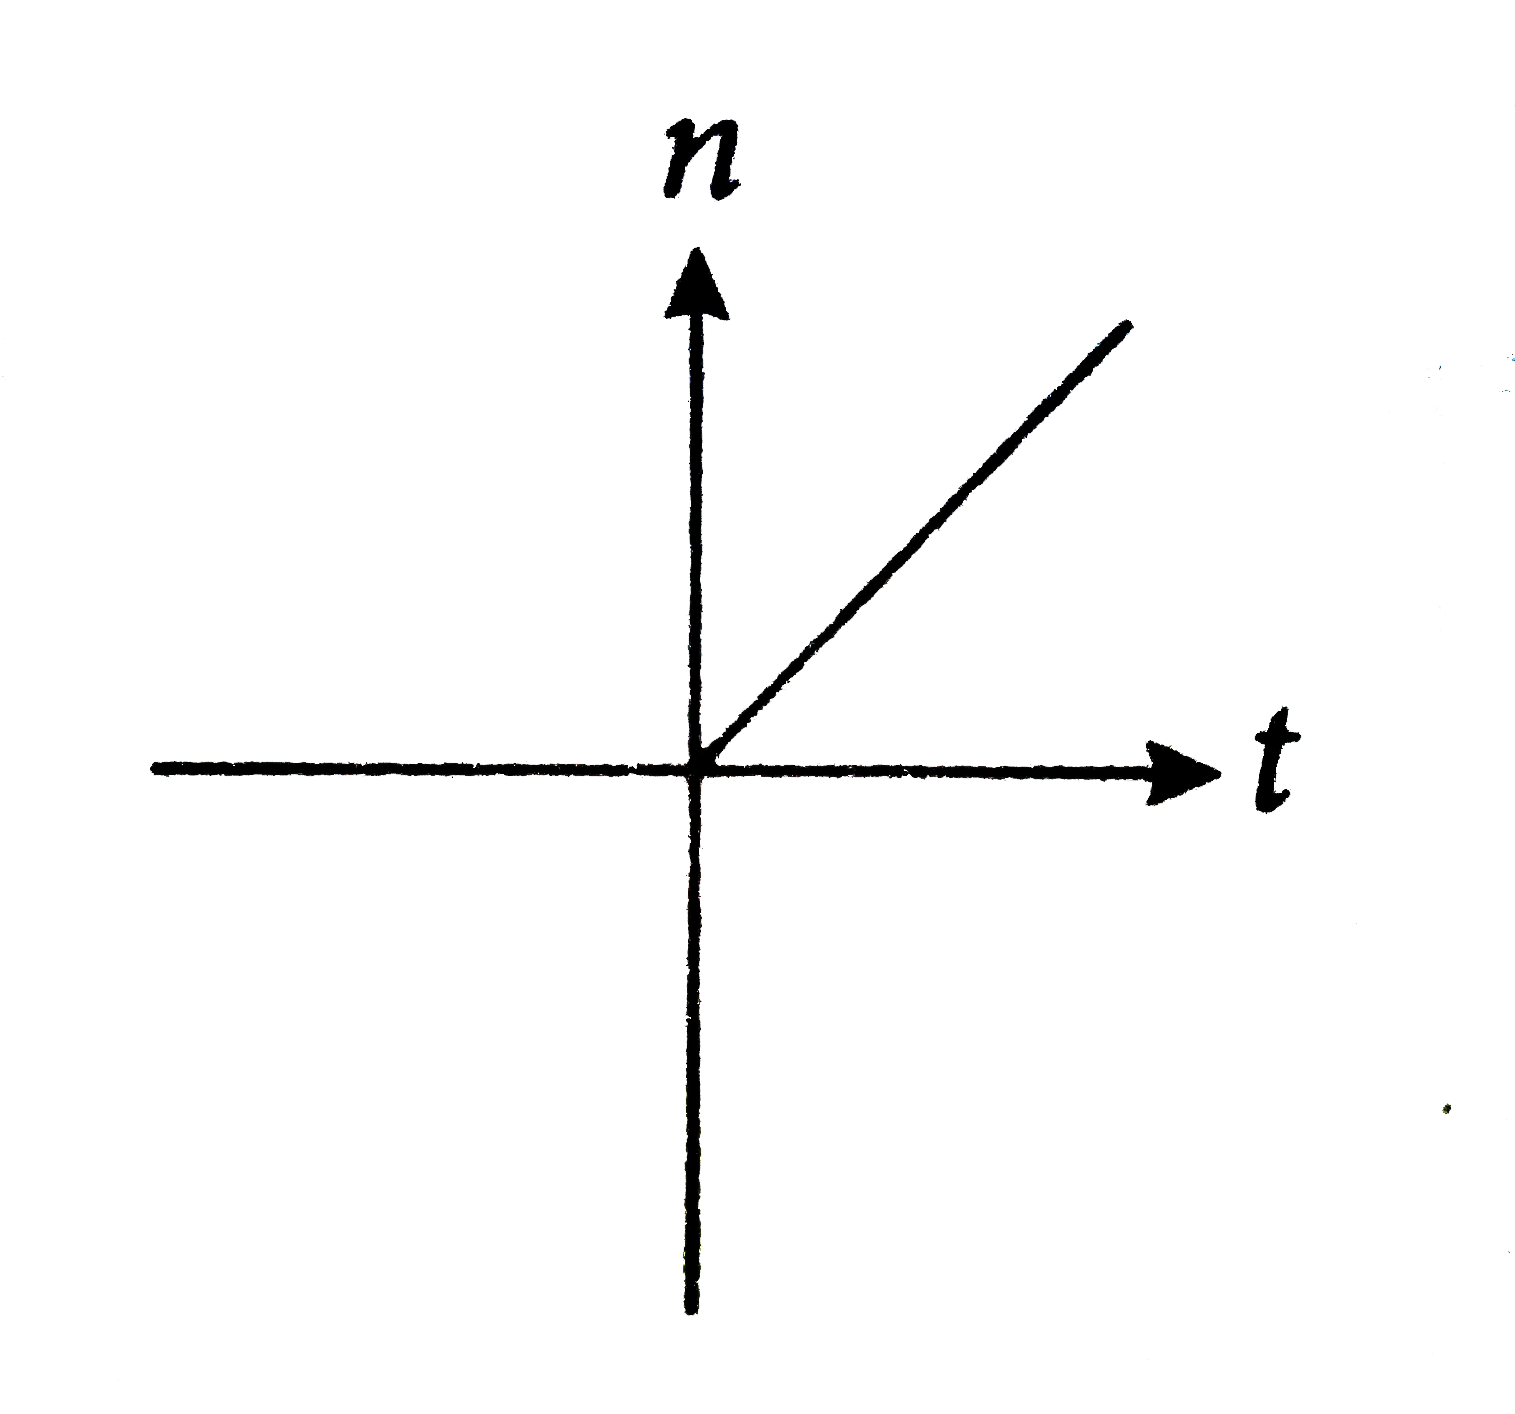 D
D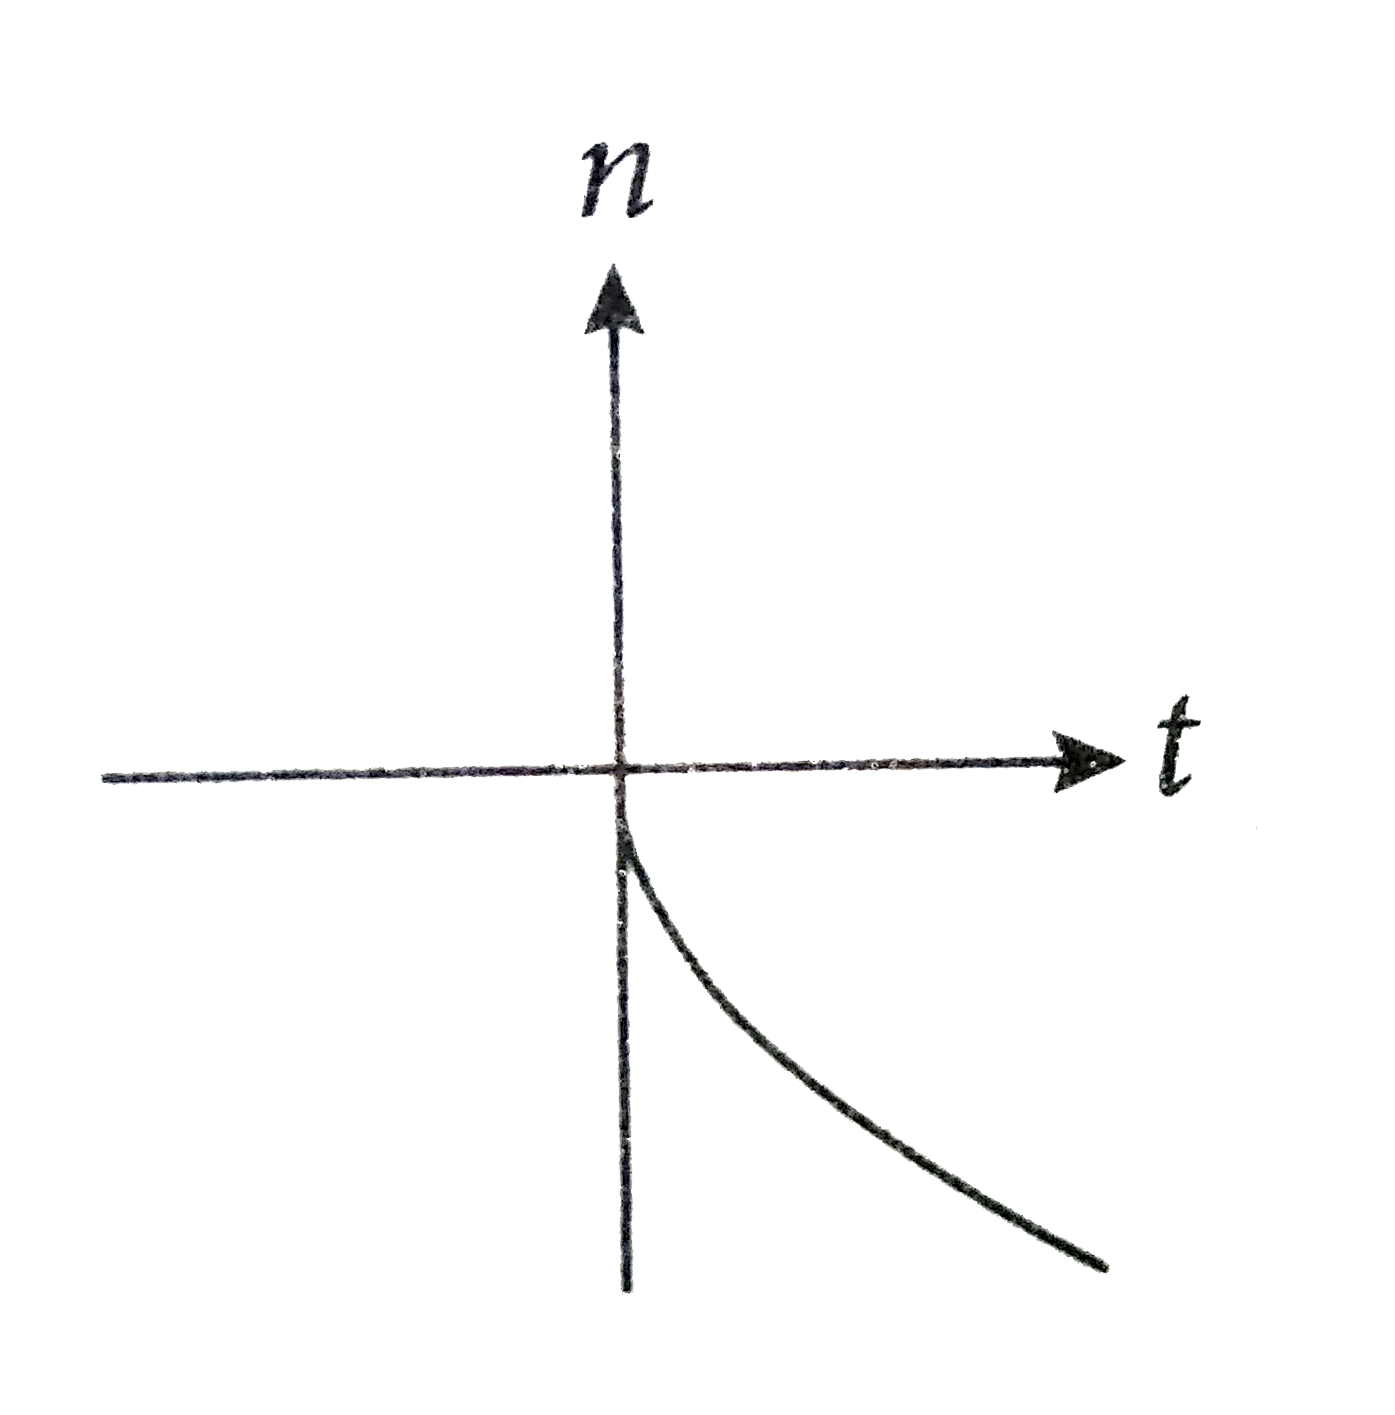
The following data gives the distribution of total household expendilture ( in Rs.) of workers is a city :

Find the average expenditure which is being done by maximum number of manual workers.
View SolutionThe following graph gives the minimum and maximum temperatures of various cities on a specific day. Read the graph and answer the following questions
Name the two cities where the maximum temperature of one city was less than the minimum temperature of the other city.

View SolutionA radioactive element A decays by the sequence and with half-lives given below:
A30min→B2days−−−→2βCα
Which of the following statement about this system are correct?
View SolutionThe Math Team and Debate Club at Jackson City High School buy their T-shirts from different stores. The tables below show the numbers of T-shirts ordered by the Math Team and Debate Club , and the costs of medium , large , and extra-large T-shirts.
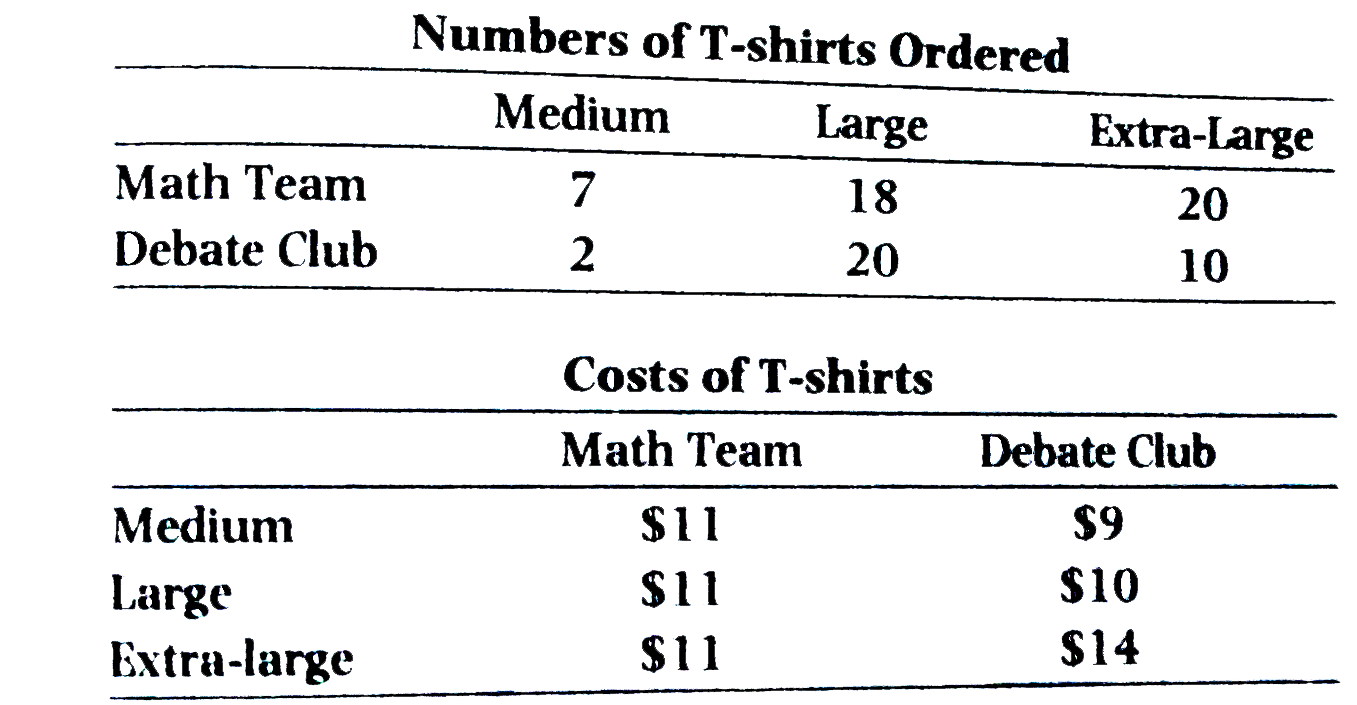
Which statement about the costs of T-shirts , as shown in the tables , is true ?
I.The Math Team spent more on extra-large T-shirts than the Debate Club spent .
II.On average , the Math Team paid more per T-shirt than the Debate Club paid .
III. Of the three sizes , extra-large T-shirts had the highest median cost.
View Solution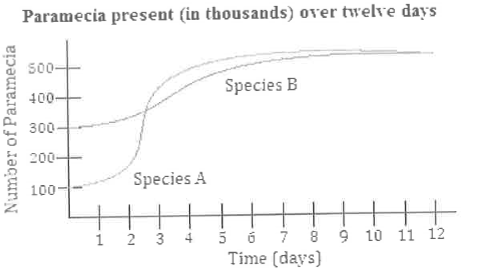
A small puddle is monitored by scientists for the number of paramecia present. The scientists are in two distinct species, let's call them ''species A'' and ''species B''. At time t = 0, the scientists measure and estimate the amount of species A and species B present in the puddle. They then proceed to measure and record the number of each species of paramecium present every hour for 12 days. the data for each species were then fit by a smooth curve, as shown in the graph above. Which of the following is a correct statement about the data above?
View Solution
