The average number of students per classroom at Central High School from 2000 to 2010 can be modeled by the equation y = 0.56 + 27.2 x , where x represents the number of years since 2000, and y represents the average number of students per classroom. Which of the following best describes the meaning of the number 0.56 in the equation?
The total number of students at the school in 2000
The average number of students per classroom in 2000
The estimated increase in the average number of students per classroom each year
The estimated difference between the average number of students per classroom in 2010 and in 2000
The correct Answer is:C
Similar Questions
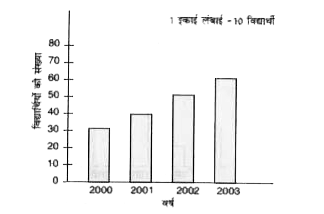
किसी स्कूल की एक विशेष कक्षा के अग्रलिखित दंड आलेख को पढ़िए और निम्न प्रश्न के उत्तर लिखिए :

क्या वर्ष 2003 में विद्यार्थियों की संख्या वर्ष 2000 के विद्यार्थियों की संख्या की दोगुनी है ?03:39View Solutionलगातार पाँच वर्षो में किसी स्कुल के विद्यार्थियों की संख्या निम्नलिखित है
1150, 1250, 1360, 1275, 1310
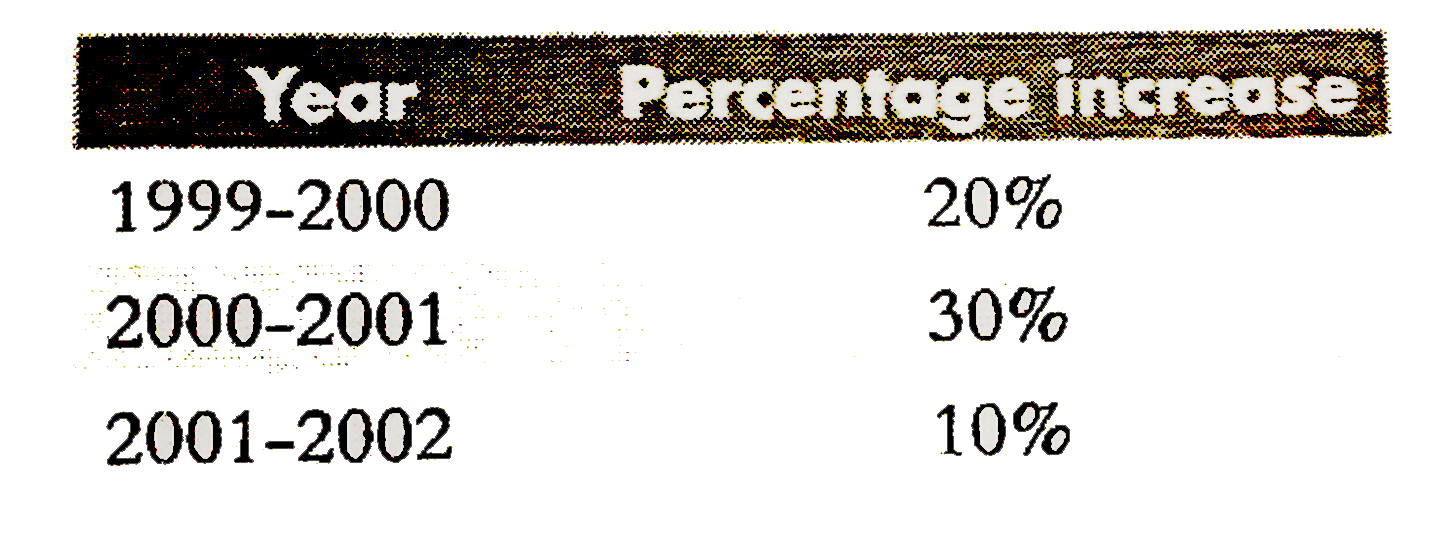
इन पाँच वर्षो में स्कुल का औसतन कितने विद्यार्थी थे ?01:51View SolutionThe percentag increases in the total number of students of a school over that in the previous year.

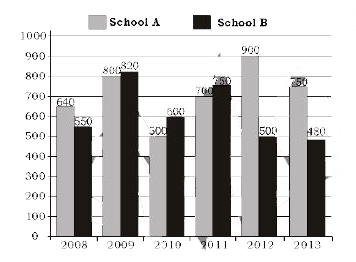
Find the effective percentage increase in the number of students from 1998-1999 to 2000-2001.02:49View SolutionThe given Bar graph presents the number of students of two schools for six years

What is the average of the number of students from school A during the six year period?02:37View SolutionThe following bar graph shows the number of students admitted and passed out per year in a college from the year 2000 to the year 2004. study the bar graph Find the ratio of the total number of passed students to the total number of students admitted in the year 2000 to 2003.
02:22View SolutionThe following bar graph shows the number of students admitted and passed out per year in a college from the year 2000 to the year 2004. study the bar graph What is the ratio of the average of the number of students admitted in the year 2002 to the number of students passed in the year 2003 and 2004?
02:54View SolutionThe following bar graph shows the number of students admitted and passed out per year in a college from the year 2000 to the year 2004. study the bar graph Find the ratio of the total number of passed students to the total number of students admitted in the year 2000 to 2003.
02:41View SolutionThe following bar graph shows the number of students in a particular class of school. Then, answer the following questions. Is the number of students in the year 2002 is twice that in the year 2000?
01:38View Solution

