Which of the following graphs best shows a strong negative association between d and t ?
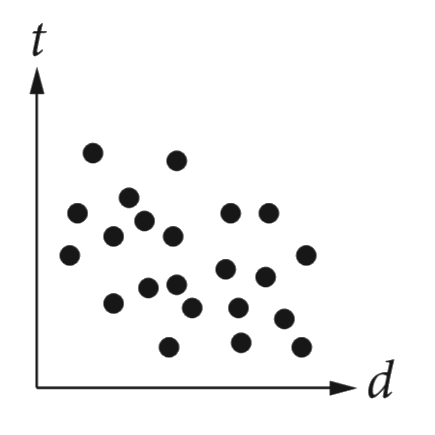
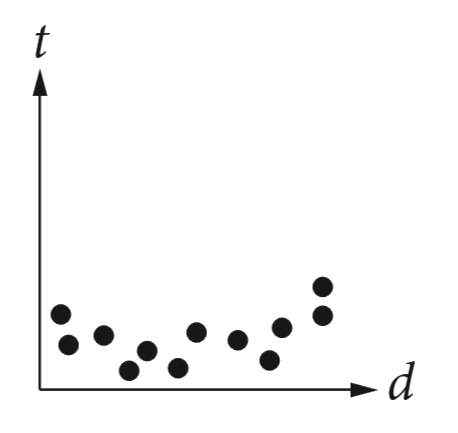
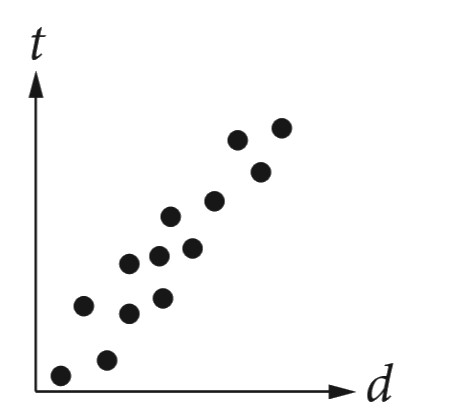
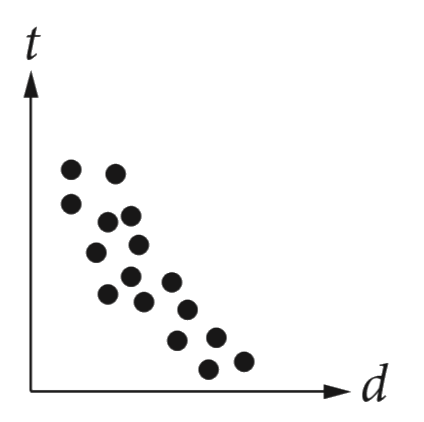
The correct Answer is:D
Step by step video, text & image solution for Which of the following graphs best shows a strong negative association between d and t ? by Maths experts to help you in doubts & scoring excellent marks in Class 12 exams.
Updated on:21/07/2023Similar Questions
Knowledge Check
Which of the following graphs shows a stong positive association between x and y?
A B
B C
C D
D
Which of the following graphs shows the relationship between the rate of an enzymatic activity and substrate concentration (S) ?
A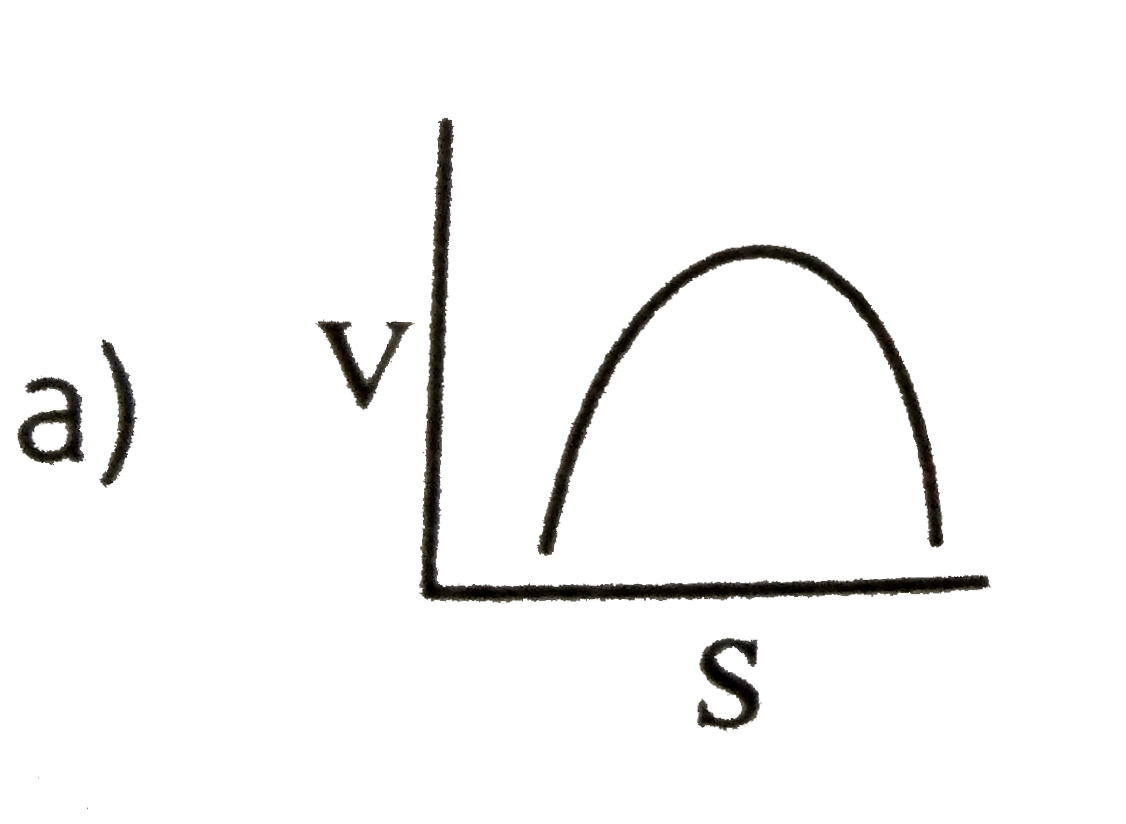 B
B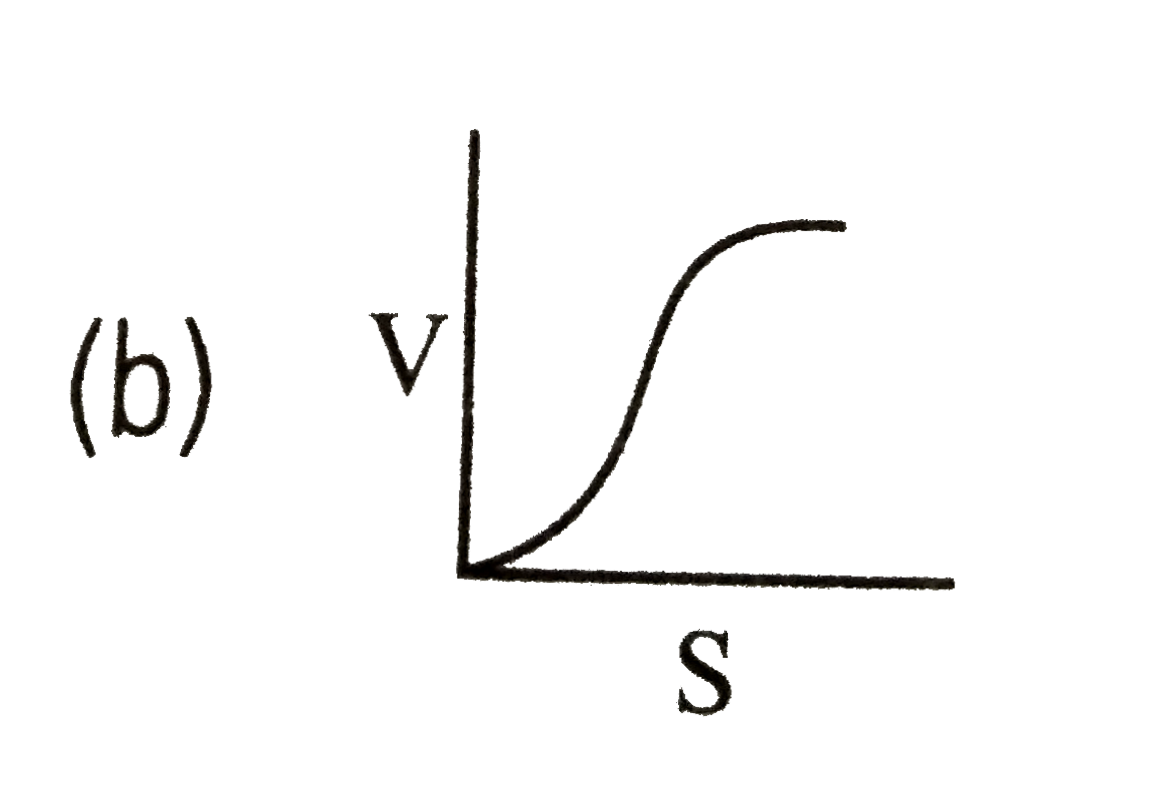 C
C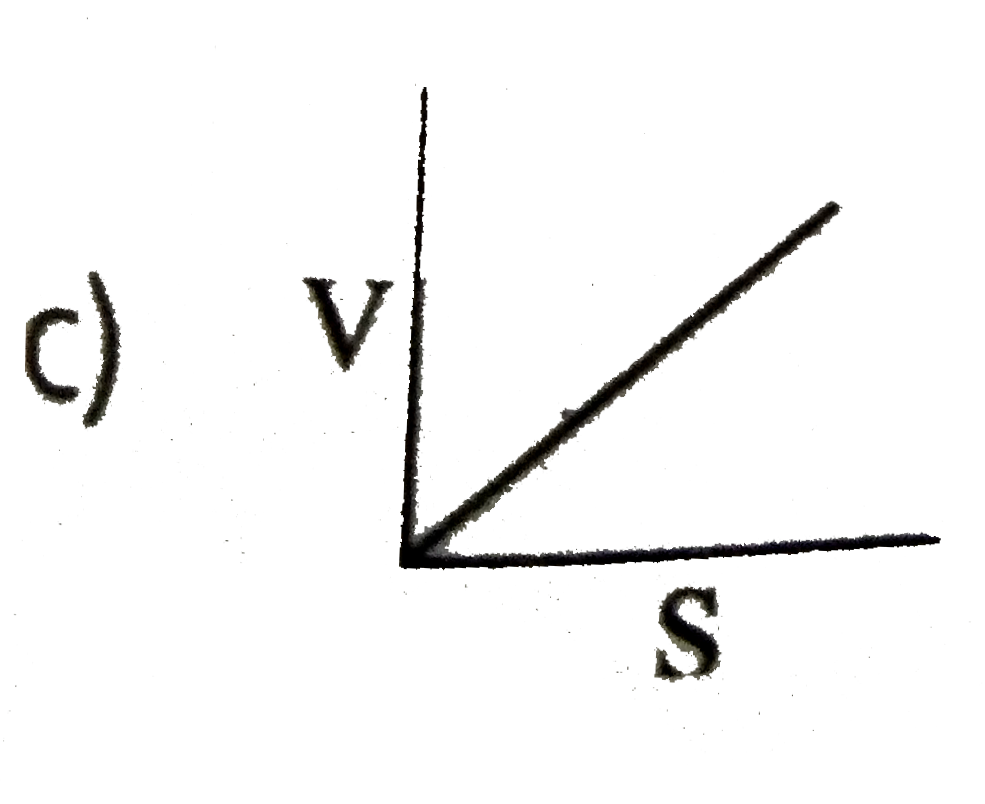 D
D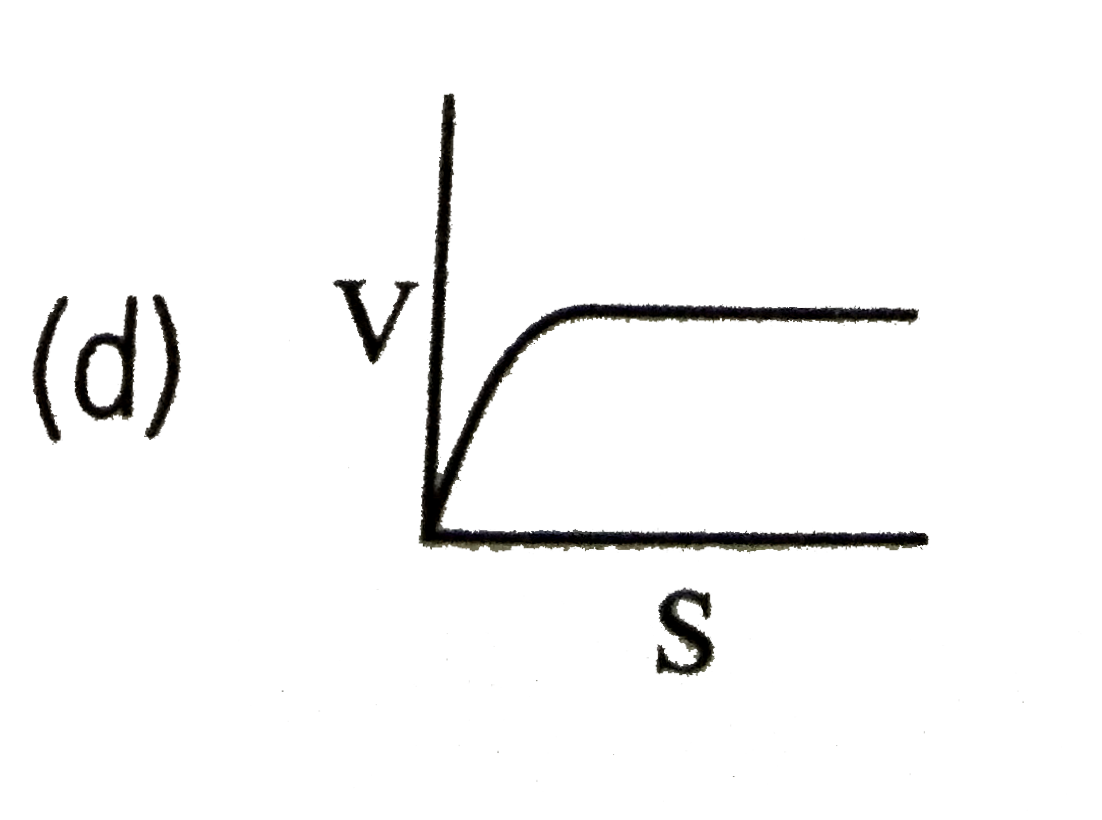
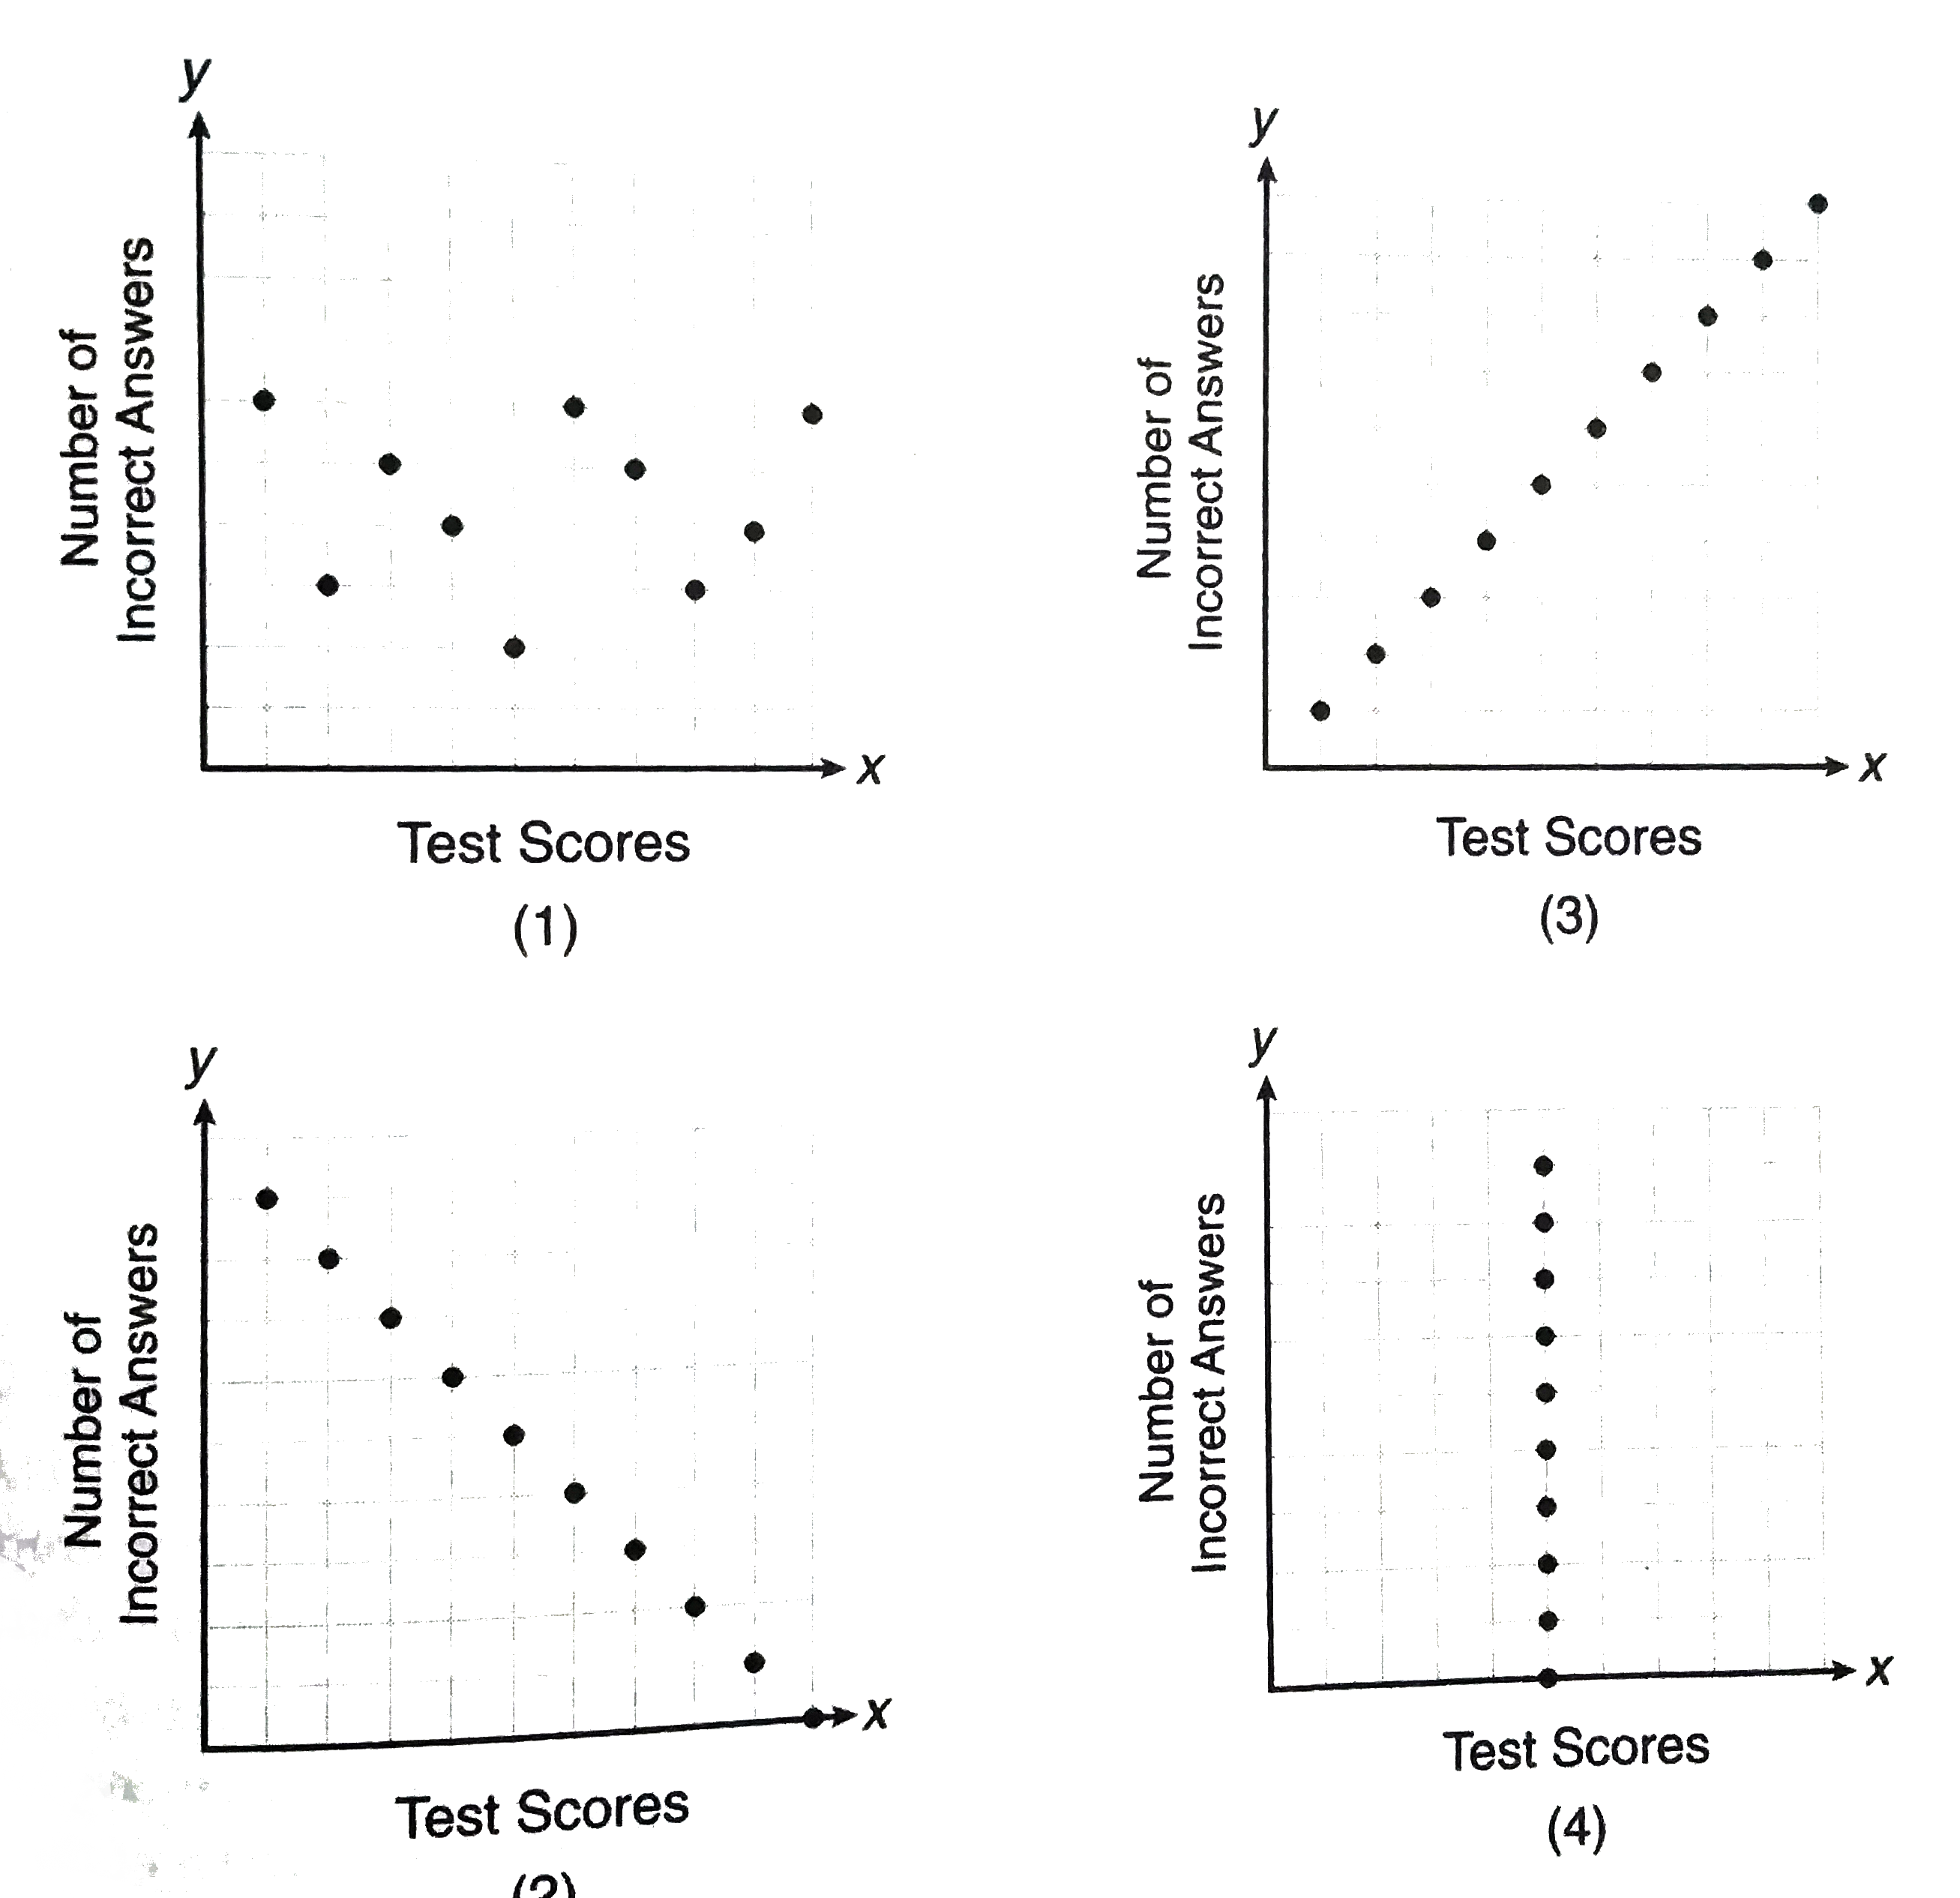
Which of the four graphs above best shows the relationship between x and y if x represents a student score on a test and y represents the number of incorrect answers a student received on the same test?AGraph (1)BGraph (2)CGraph (3)DGraph (4)
Which one of the following elements shows both positive and negative oxidation states?
View SolutionWhich of the following graphs best represents the variation of acceleration 'a' with displacement x?
View SolutionPotential Energy U(x) and associated force F(x) bears the relation F(x)=−ddxU(x).
Dependence of potential energy of a two−particle system separation x between them is shown in the following figure.
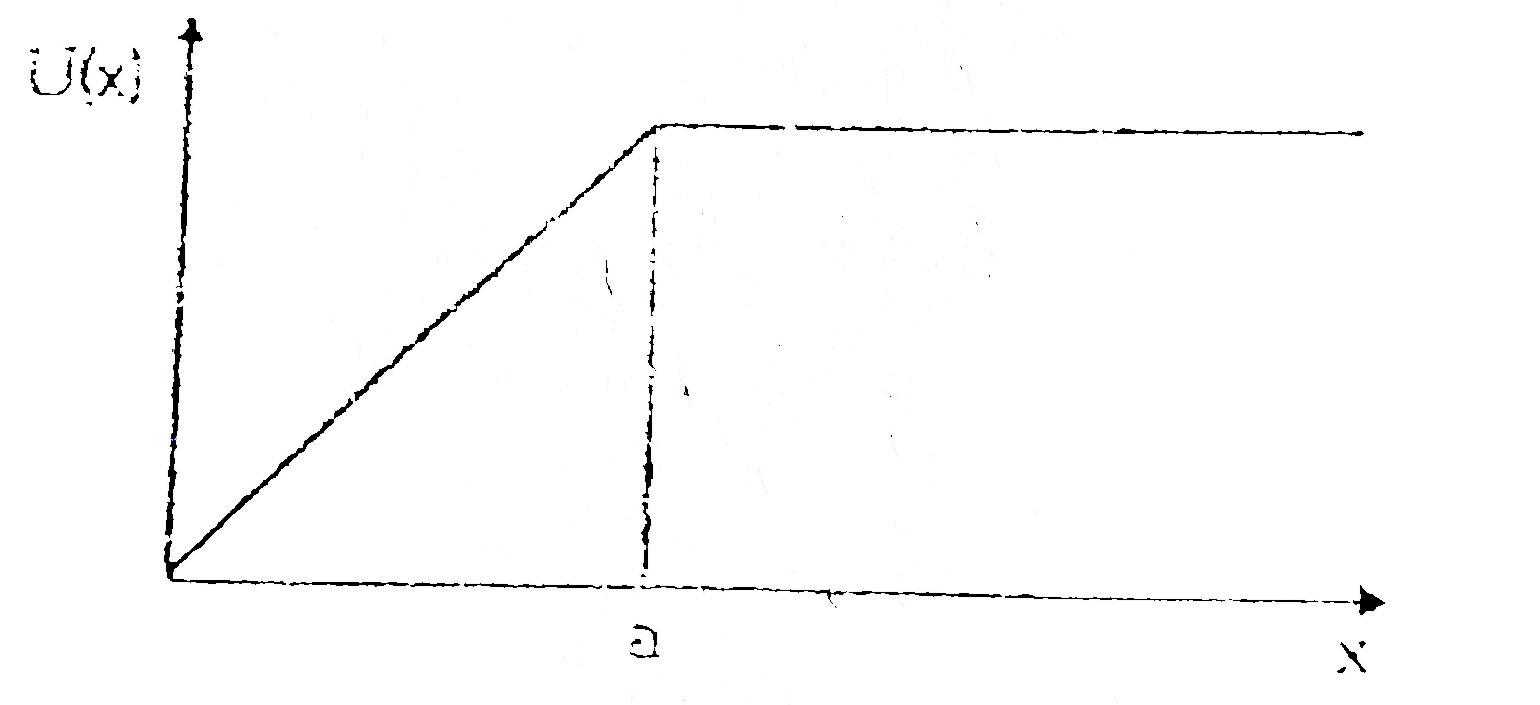
Which of the following graphs shows correct variation in assoicated force F(x) with x?
View SolutionWhich of the following graphs best represent the variation of phase difference between he interferring waves in a double slit experiment with the distance from the central maximum?
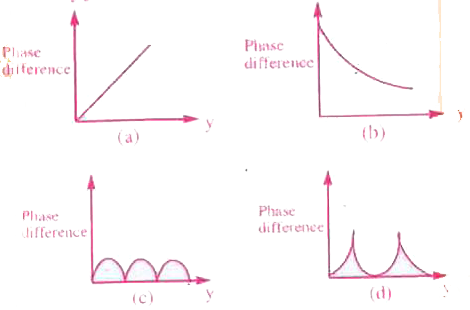
View SolutionWhich of the following velocity-time graphs shows a realistic situation for a body in motion ?
View Solution


