Number of Portable Media Players Sold Worldwide Each Year from 2006 to 2011
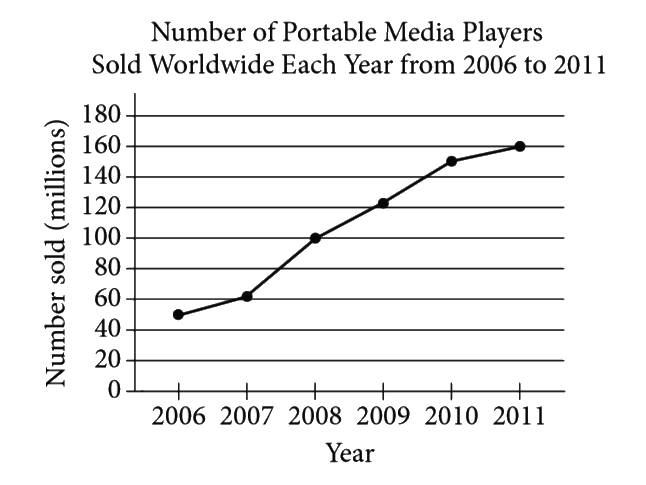
According to the line graph above, the number of portable media players sold in 2008 is what fraction of the number sold in 2011 ?
Step by step video & image solution for Number of Portable Media Players Sold Worldwide Each Year from 2006 to 2011 According to the line graph above, the number of portable media players sold in 2008 is what fraction of the number sold in 2011 ? by Maths experts to help you in doubts & scoring excellent marks in Class 12 exams.
Updated on:21/07/2023Similar Questions
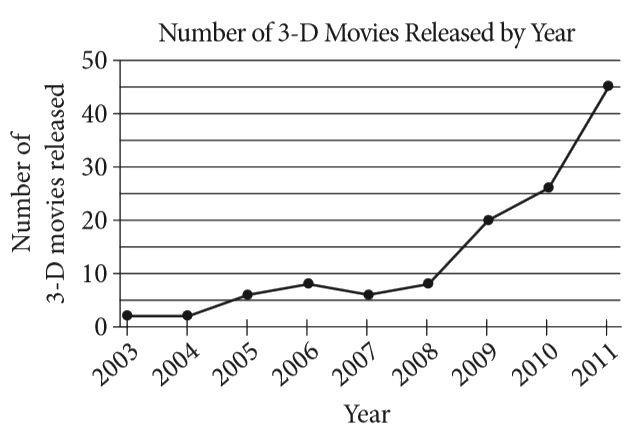
According to the line graph above, between which two consecutive years was there the greatest change in the number of 3 -D movies released?
View SolutionGiven below (figure) is the bar graph indicating the marks obtained out of 50 in mathematics paper by 100 students. Read the bar graph and answer the following questions: It is decided to distribute work books on mathematics to the students obtaining less then 20 marks, giving one workbook to each of such students. If a work book costs Rs.5, what sum is required to buy the work books? Every student belonging to the highest mark group is entitled to get a prize of Rs. 10. How much amount of money is required for distributing the prize money? Every student belonging to the lowest mark-group has to solve 5 problems per day. How many problems, in all, will be solved by the students of this group per day? State whether true or false. 17% students have obtained marks ranging from 40 to 49. 59 students have obtained marks ranging from 10 to 29. What is the number of students getting less than 20 marks? What is the number of students getting more than 29 marks? What is the number of students getting marks between 9 to 40? What is the number of students belonging to the highest mark group? What is the number of students obtaining more than 19 marks?
View Solution
Knowledge Check
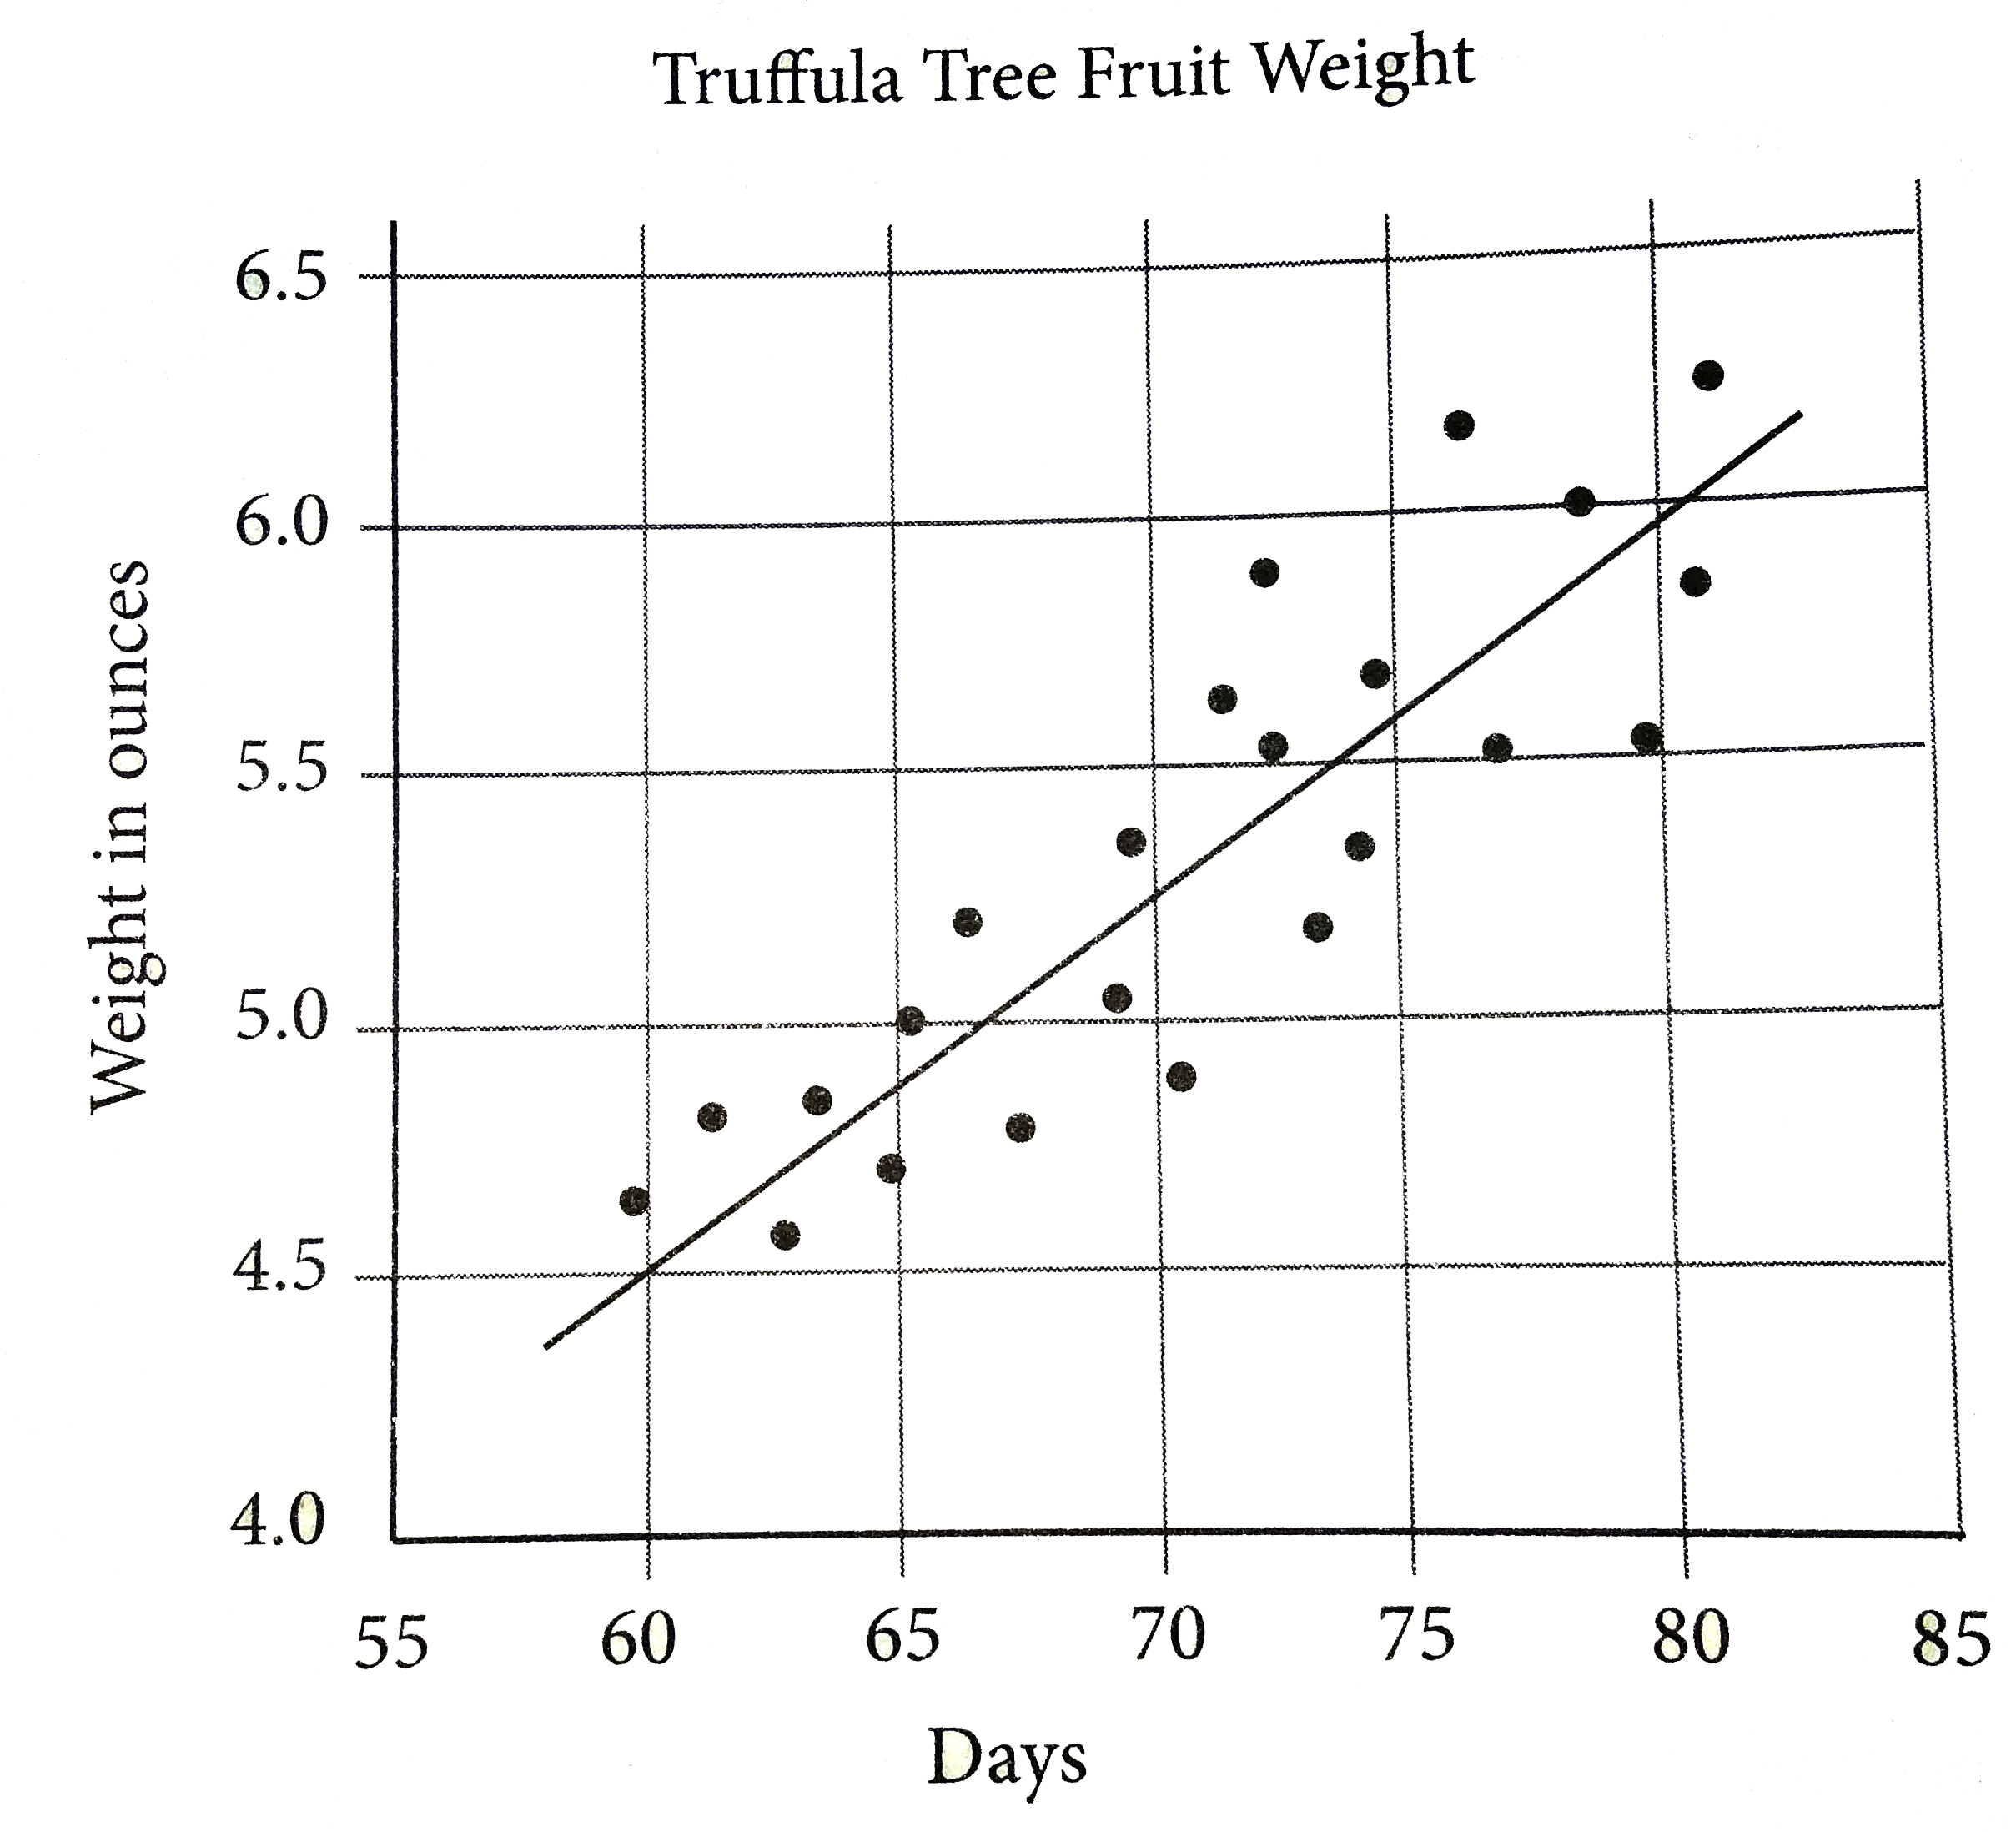
The scatterplot above shows the weight, in ounces,of the fruits on a certain truffula tree from days 55 to 85 after flowering. According to the line of best fit in the scatterplot above, which of the following is the closest approximation of the number of days after flowering of a truffula fruit that weighs 5.75 ounces?A63B65C77D81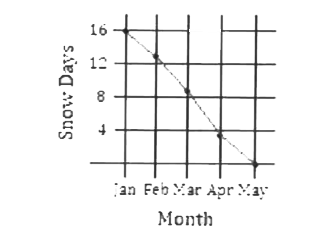
The line graph abvoe shows the average number of days that it snows at least 0.1 inch in Buffalo, NY from January to May. According to the graph, approximately what was the greatest decrease in the number of snow days from one month to the next month?A2B3C4D6The graph shows the number of music CDs sold at various prices. At what price should the CDs be marked to sell the maximum number of CDs?
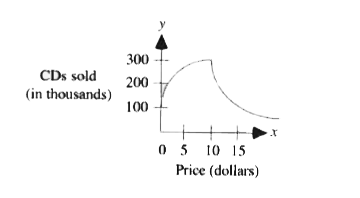 A0B5C10D15
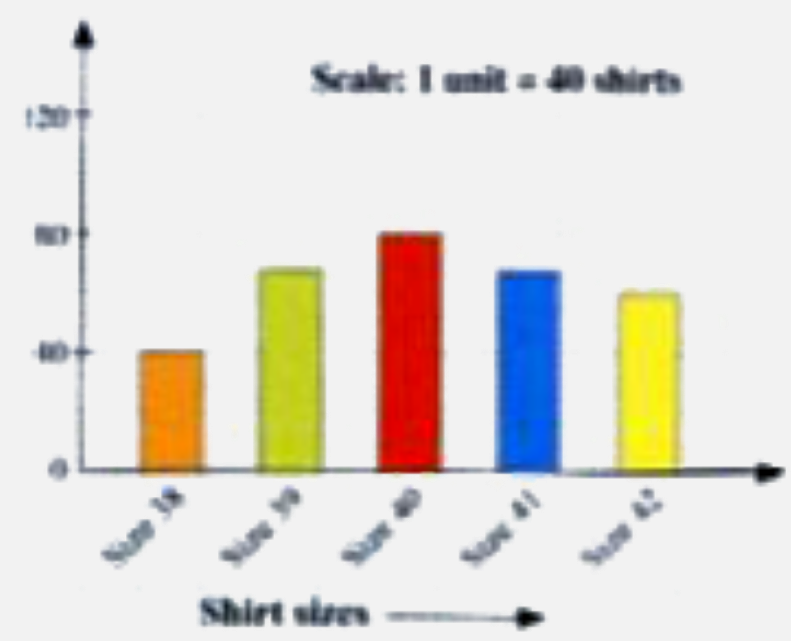
Read the following graph and answer the following question.
Find the ratio of the number of shirts of size 38 sold to the number of shirts of size 42 sold.
View SolutionA botanist is cultivating a rare species of plant in a controlled environment and currently has 3000 of these plants. The population of this species that the botanist expects to grow next year, Nnext year, can be estimated from the number of plants this year, Nthis year, by the equation below.
Nnext year=Nthis year+0.2(Nthis year)(1−Nthis yearK)
The constant K in this formula is the number of plants the environment is able to support.
According to the formula, what will be the number of plants two years from now if K = 4000 ? (Round your answer to the nearest whole number.)
View Solution
A magnet school is a free public school that has a fused theme. According to the table above, what was the increase in the total number of graduates in five of these magnet schools in District 1 from 2013 to 2014?
View SolutionIn one state, the number of bicycles sold in the year 2002-2003was 7,43,000. In the year 2003-2004, the number of bicycles sold was 8,00,100. In which year were more bicycles sold? and how many more?
View SolutionIn one state the number of bicycles sold in the year 2002-2003 was 7,42,214. In the year 2003-2004, the number of bicycles sold was 8,00,112. In which year were more bicycles sold? And how many more?
View Solution
