In one state the number of bicycles sold in the year 2002-2003 was 7,42,214. In the year 2003-2004, the number of bicycles sold was 8,00,112. In which year were more bicycles sold? And how many more?
To solve the problem, we need to determine in which year more bicycles were sold and by how many. Let's break it down step by step.
Step 1: Identify the number of bicycles sold in each year
- For the year 2002-2003, the number of bicycles sold is 7,42,214.
- For the year 2003-2004, the number of bicycles sold is 8,00,112.
Step 2: Compare the two numbers
To find out which year had more bicycles sold, we can compare the two numbers directly:
- 7,42,214 (2002-2003)
- 8,00,112 (2003-2004)
Since 8,00,112 is greater than 7,42,214, we can conclude that more bicycles were sold in the year 2003-2004.
Step 3: Calculate the difference
Now, we need to find out how many more bicycles were sold in 2003-2004 compared to 2002-2003. We do this by subtracting the number of bicycles sold in 2002-2003 from the number sold in 2003-2004.
\(
\text{Difference} = \text{Bicycles sold in 2003-2004} - \text{Bicycles sold in 2002-2003}
\)
Substituting the values:
\(
\text{Difference} = 8,00,112 - 7,42,214
\)
Step 4: Perform the subtraction
Now, let's perform the subtraction step by step:
1. Align the numbers for subtraction:
8,00,112−7,42,214
2. Start subtracting from the rightmost digit:
- 2 - 4: Not possible, so we take a carry from the next column. It becomes 12 - 4 = 8.
- 1 (after taking carry) - 1 = 0.
- 0 (after taking carry) - 2: Not possible, take carry. It becomes 10 - 2 = 8.
- 0 (after taking carry) - 2: Not possible, take carry. It becomes 10 - 2 = 8.
- 0 - 4: Not possible, take carry. It becomes 10 - 4 = 6.
- 7 - 7 = 0.
So, the result of the subtraction is:
\(
\text{Difference} = 57,898
\)
Conclusion
Thus, more bicycles were sold in the year 2003-2004, and the number of additional bicycles sold compared to the previous year is 57,898.
---
- For the year 2002-2003, the number of bicycles sold is 7,42,214.
- For the year 2003-2004, the number of bicycles sold is 8,00,112.
To find out which year had more bicycles sold, we can compare the two numbers directly:
- 7,42,214 (2002-2003)
- 8,00,112 (2003-2004)
Now, we need to find out how many more bicycles were sold in 2003-2004 compared to 2002-2003. We do this by subtracting the number of bicycles sold in 2002-2003 from the number sold in 2003-2004.
\text{Difference} = \text{Bicycles sold in 2003-2004} - \text{Bicycles sold in 2002-2003}
\)
\text{Difference} = 8,00,112 - 7,42,214
\)
Now, let's perform the subtraction step by step:
8,00,112−7,42,214
- 2 - 4: Not possible, so we take a carry from the next column. It becomes 12 - 4 = 8.
- 1 (after taking carry) - 1 = 0.
- 0 (after taking carry) - 2: Not possible, take carry. It becomes 10 - 2 = 8.
- 0 (after taking carry) - 2: Not possible, take carry. It becomes 10 - 2 = 8.
- 0 - 4: Not possible, take carry. It becomes 10 - 4 = 6.
- 7 - 7 = 0.
\(
\text{Difference} = 57,898
\)
Thus, more bicycles were sold in the year 2003-2004, and the number of additional bicycles sold compared to the previous year is 57,898.
Topper's Solved these Questions
Similar Questions
In one state, the number of bicycles sold in the year 2002-2003was 7,43,000. In the year 2003-2004, the number of bicycles sold was 8,00,100. In which year were more bicycles sold? and how many more?
View SolutionRead the bar graph shown in Figure and answer the following questions: What is the information given by the bar graph? How many tickets of Assam State Lottery were sold by the agent? Of which state, were the maximum number of tickets sold? State whether true or false. The maximum number of tickets sold is three times the minimum number of tickets sold. Of which state were the minimum number of tickets sold?
View Solution
Knowledge Check
The following table gives the number of households in USA during 2000-2014.
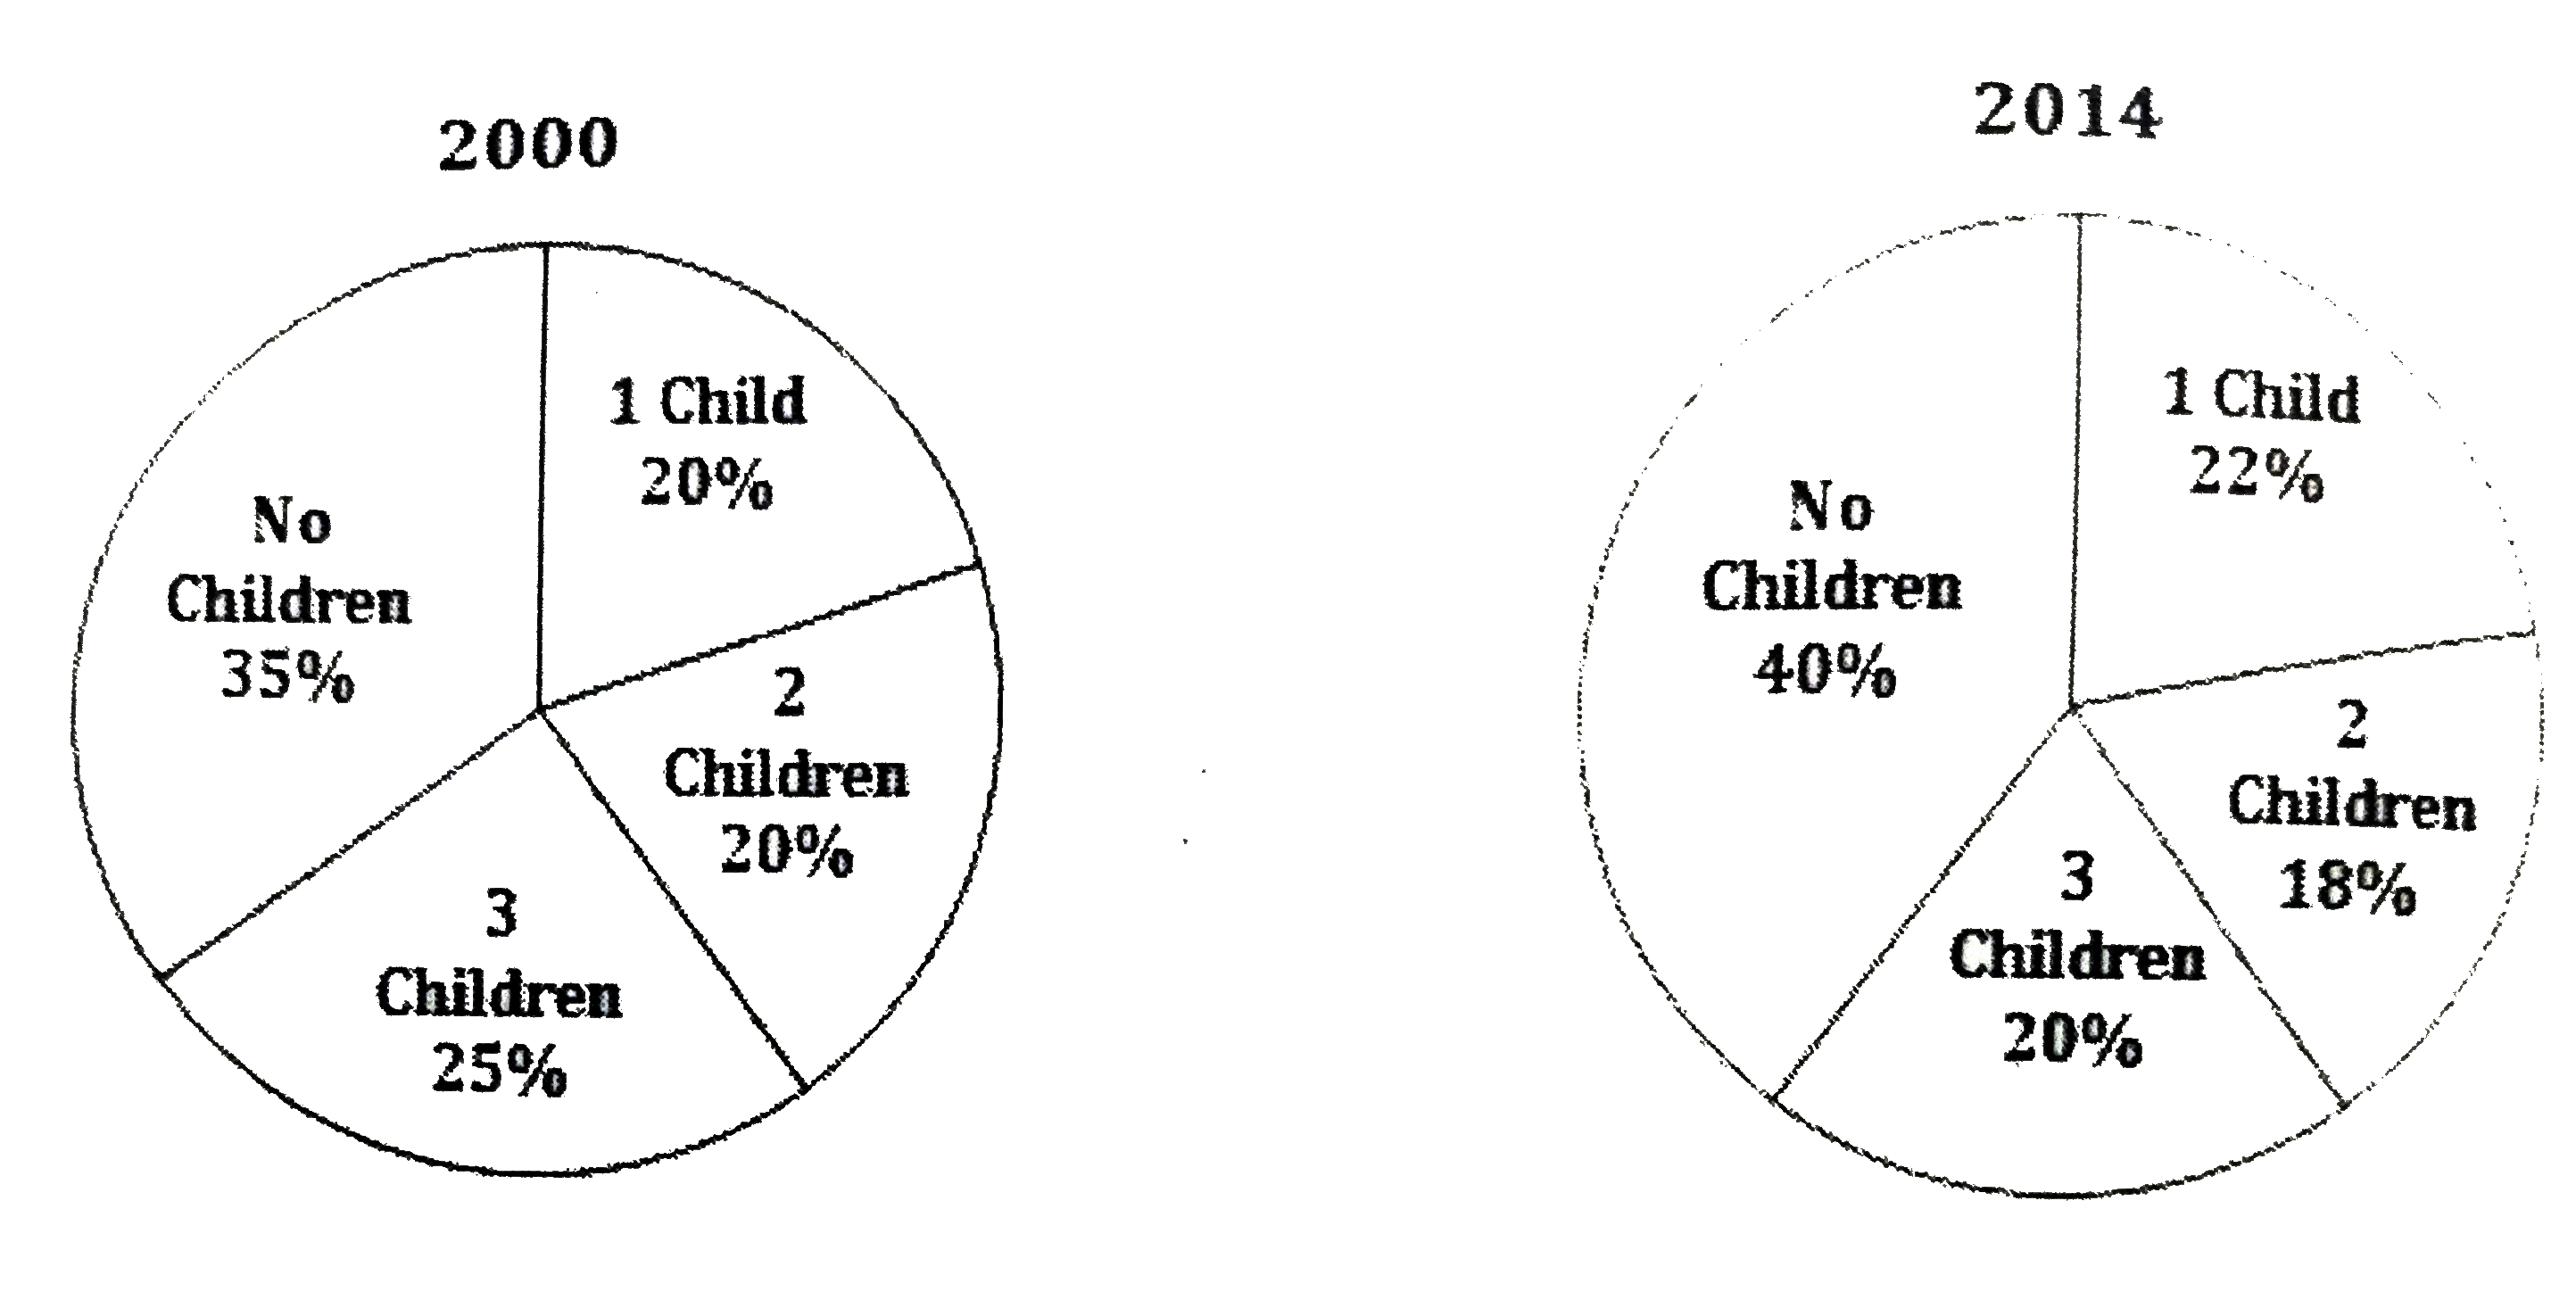
The following charts give the distribution of households based on the numbers of children for the years 2000 and 2014.

The following charts give the distribution based on the number of childre for the year 2000 and 2014.

In the above problem, how many additional children were born in that year ?A8.4 millionB13.2 millionC15.0 millionD17.6 million
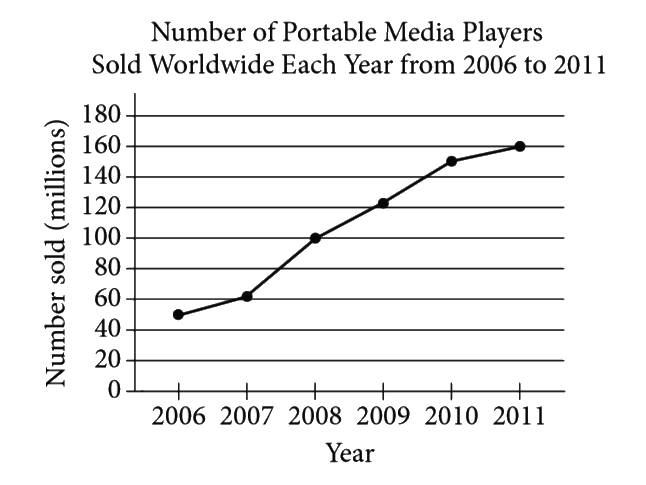
Number of Portable Media Players Sold Worldwide Each Year from 2006 to 2011

According to the line graph above, the number of portable media players sold in 2008 is what fraction of the number sold in 2011 ?
View SolutionRead the bar graph (Fig 3.4) and answer the questions that follow:Number of books sold by a bookstore during five consecutive years.(i) About how many books were sold in 1989? 1990? 1992?(ii) In which year were about 475 books sold? About 225 books sold?(iii) In which years were fewer than 250 books sold?(iv) Can you explain how you would estimate the number of books sold in 1989?
View SolutionDuring its first week of business a market sold a total of 108 apples and oranges. The second week, five times the number of apples and three times the number of oranges were sold. A total of 452 apples and oranges were sold during the second week. How many more apples than oranges were sold in the first week?
View SolutionTotal number of students of a school in different years is shown in the following table: Year, No. of Students 1996 1998 2000 2002 2004, 400 550 450 600 650 Represent the above data by a pictograph. Prepare a pictograph of students using one symbol an icon of a student to represent 100 students and answer the following questions: How many symbols represent total number of students in the year 2002? How many symbols represent total number of students in the year 1998? Prepare another pictograph of students using any other symbol each representing 50 students. Which pictograph do you find more informative?
View SolutionIn the club election, the number of contestants is one more than the number of maximum candidates for which a voter can vote. If the total number of ways in which a voter can vote be 62, then the number of candidates is: (a) 7 (b) 5 (c) 6 (d) 8
View SolutionA company sells two different products, A and B. The two products are produced in a common production process, which has a total capacity of 500 man-hours. It takes 5 hours to produce a unit of A and 3 hours to produce a unit of B. The market has been surveyed and company officials feel that the maximum number of units of A that can be sold is 70 and that, for B is 125. If the profit is Rs. 20 per unit for the product A and Rs. 15 per unit for the product B, how many units of each product should be sold to maximize profit?
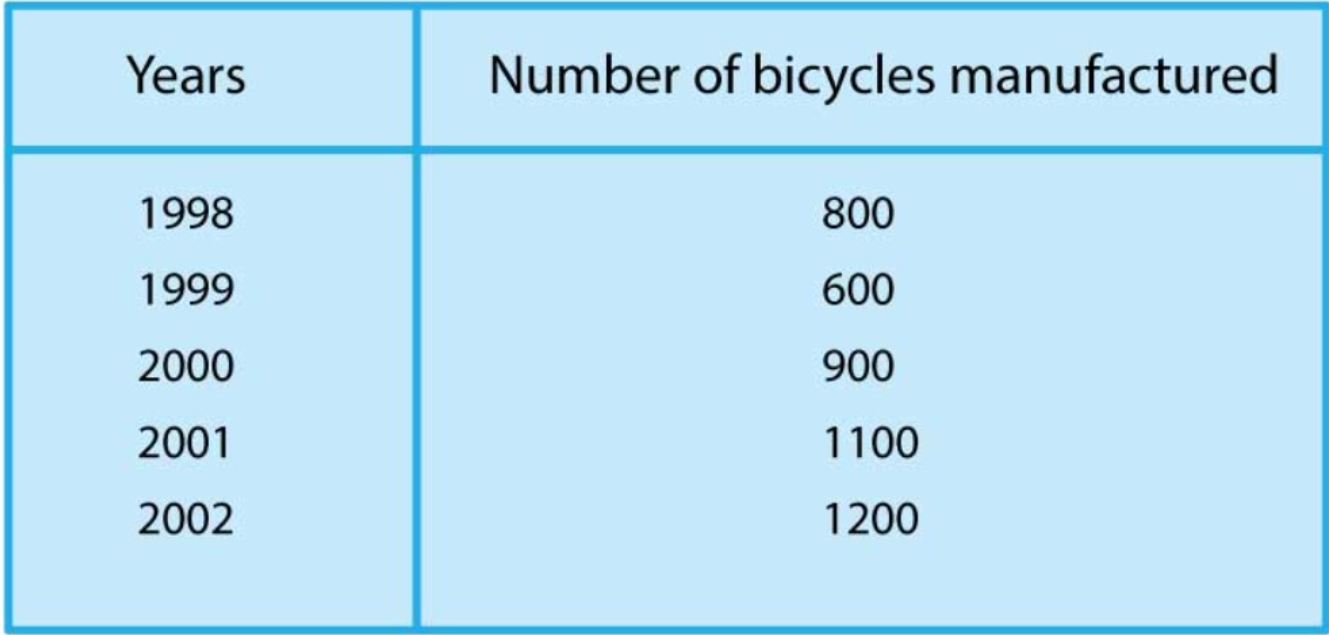
View SolutionFollowing table shows the number of bicycles manufactured in a factory during the years 1998 to 2002. Illustrate this data using a bar graph. Choose a scale of your choice

View Solution
