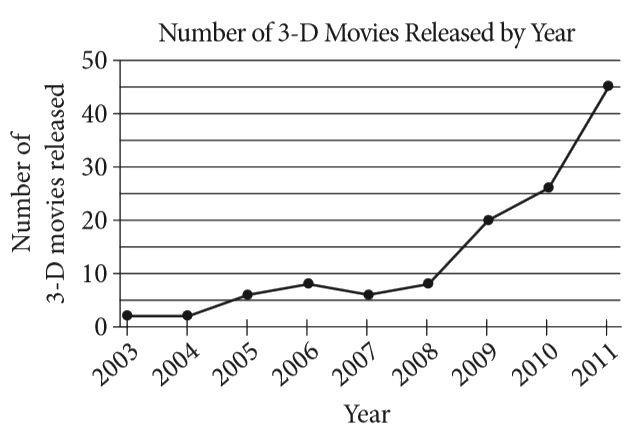
According to the line graph above, between which two consecutive years was there the greatest change in the number of 3 -D movies released?
2003-2004
2008-2009
2009-2010
2010-2011
Step by step video & image solution for According to the line graph above, between which two consecutive years was there the greatest change in the number of 3 -D movies released? by Maths experts to help you in doubts & scoring excellent marks in Class 12 exams.
Updated on:21/07/2023Similar Questions
Number of Portable Media Players Sold Worldwide Each Year from 2006 to 2011
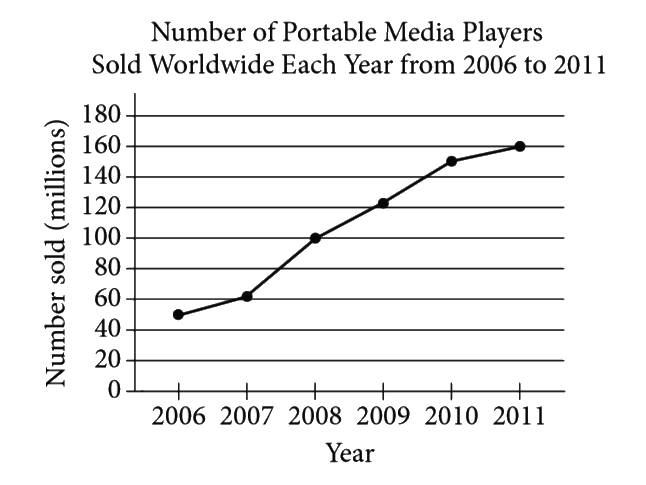
According to the line graph above, the number of portable media players sold in 2008 is what fraction of the number sold in 2011 ?
View SolutionThe difference between the squares of two consecutive numbers is 31. Find the numbers.
View Solution
Knowledge Check
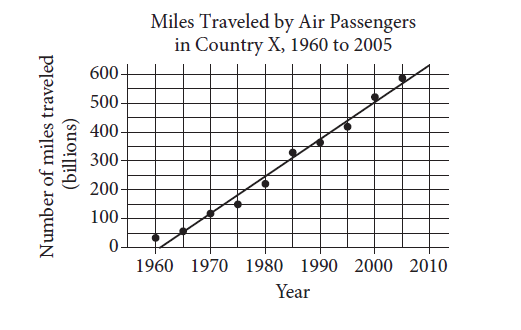
According to the line of best fit in the scatterplot above, which of the following best approximates the year in which the number of miles traveled by air passengers in Country X was estimated to be 550 billion?A1997B2000C2003D2008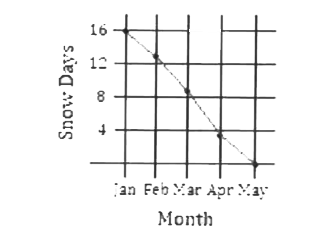
The line graph abvoe shows the average number of days that it snows at least 0.1 inch in Buffalo, NY from January to May. According to the graph, approximately what was the greatest decrease in the number of snow days from one month to the next month?A2B3C4D6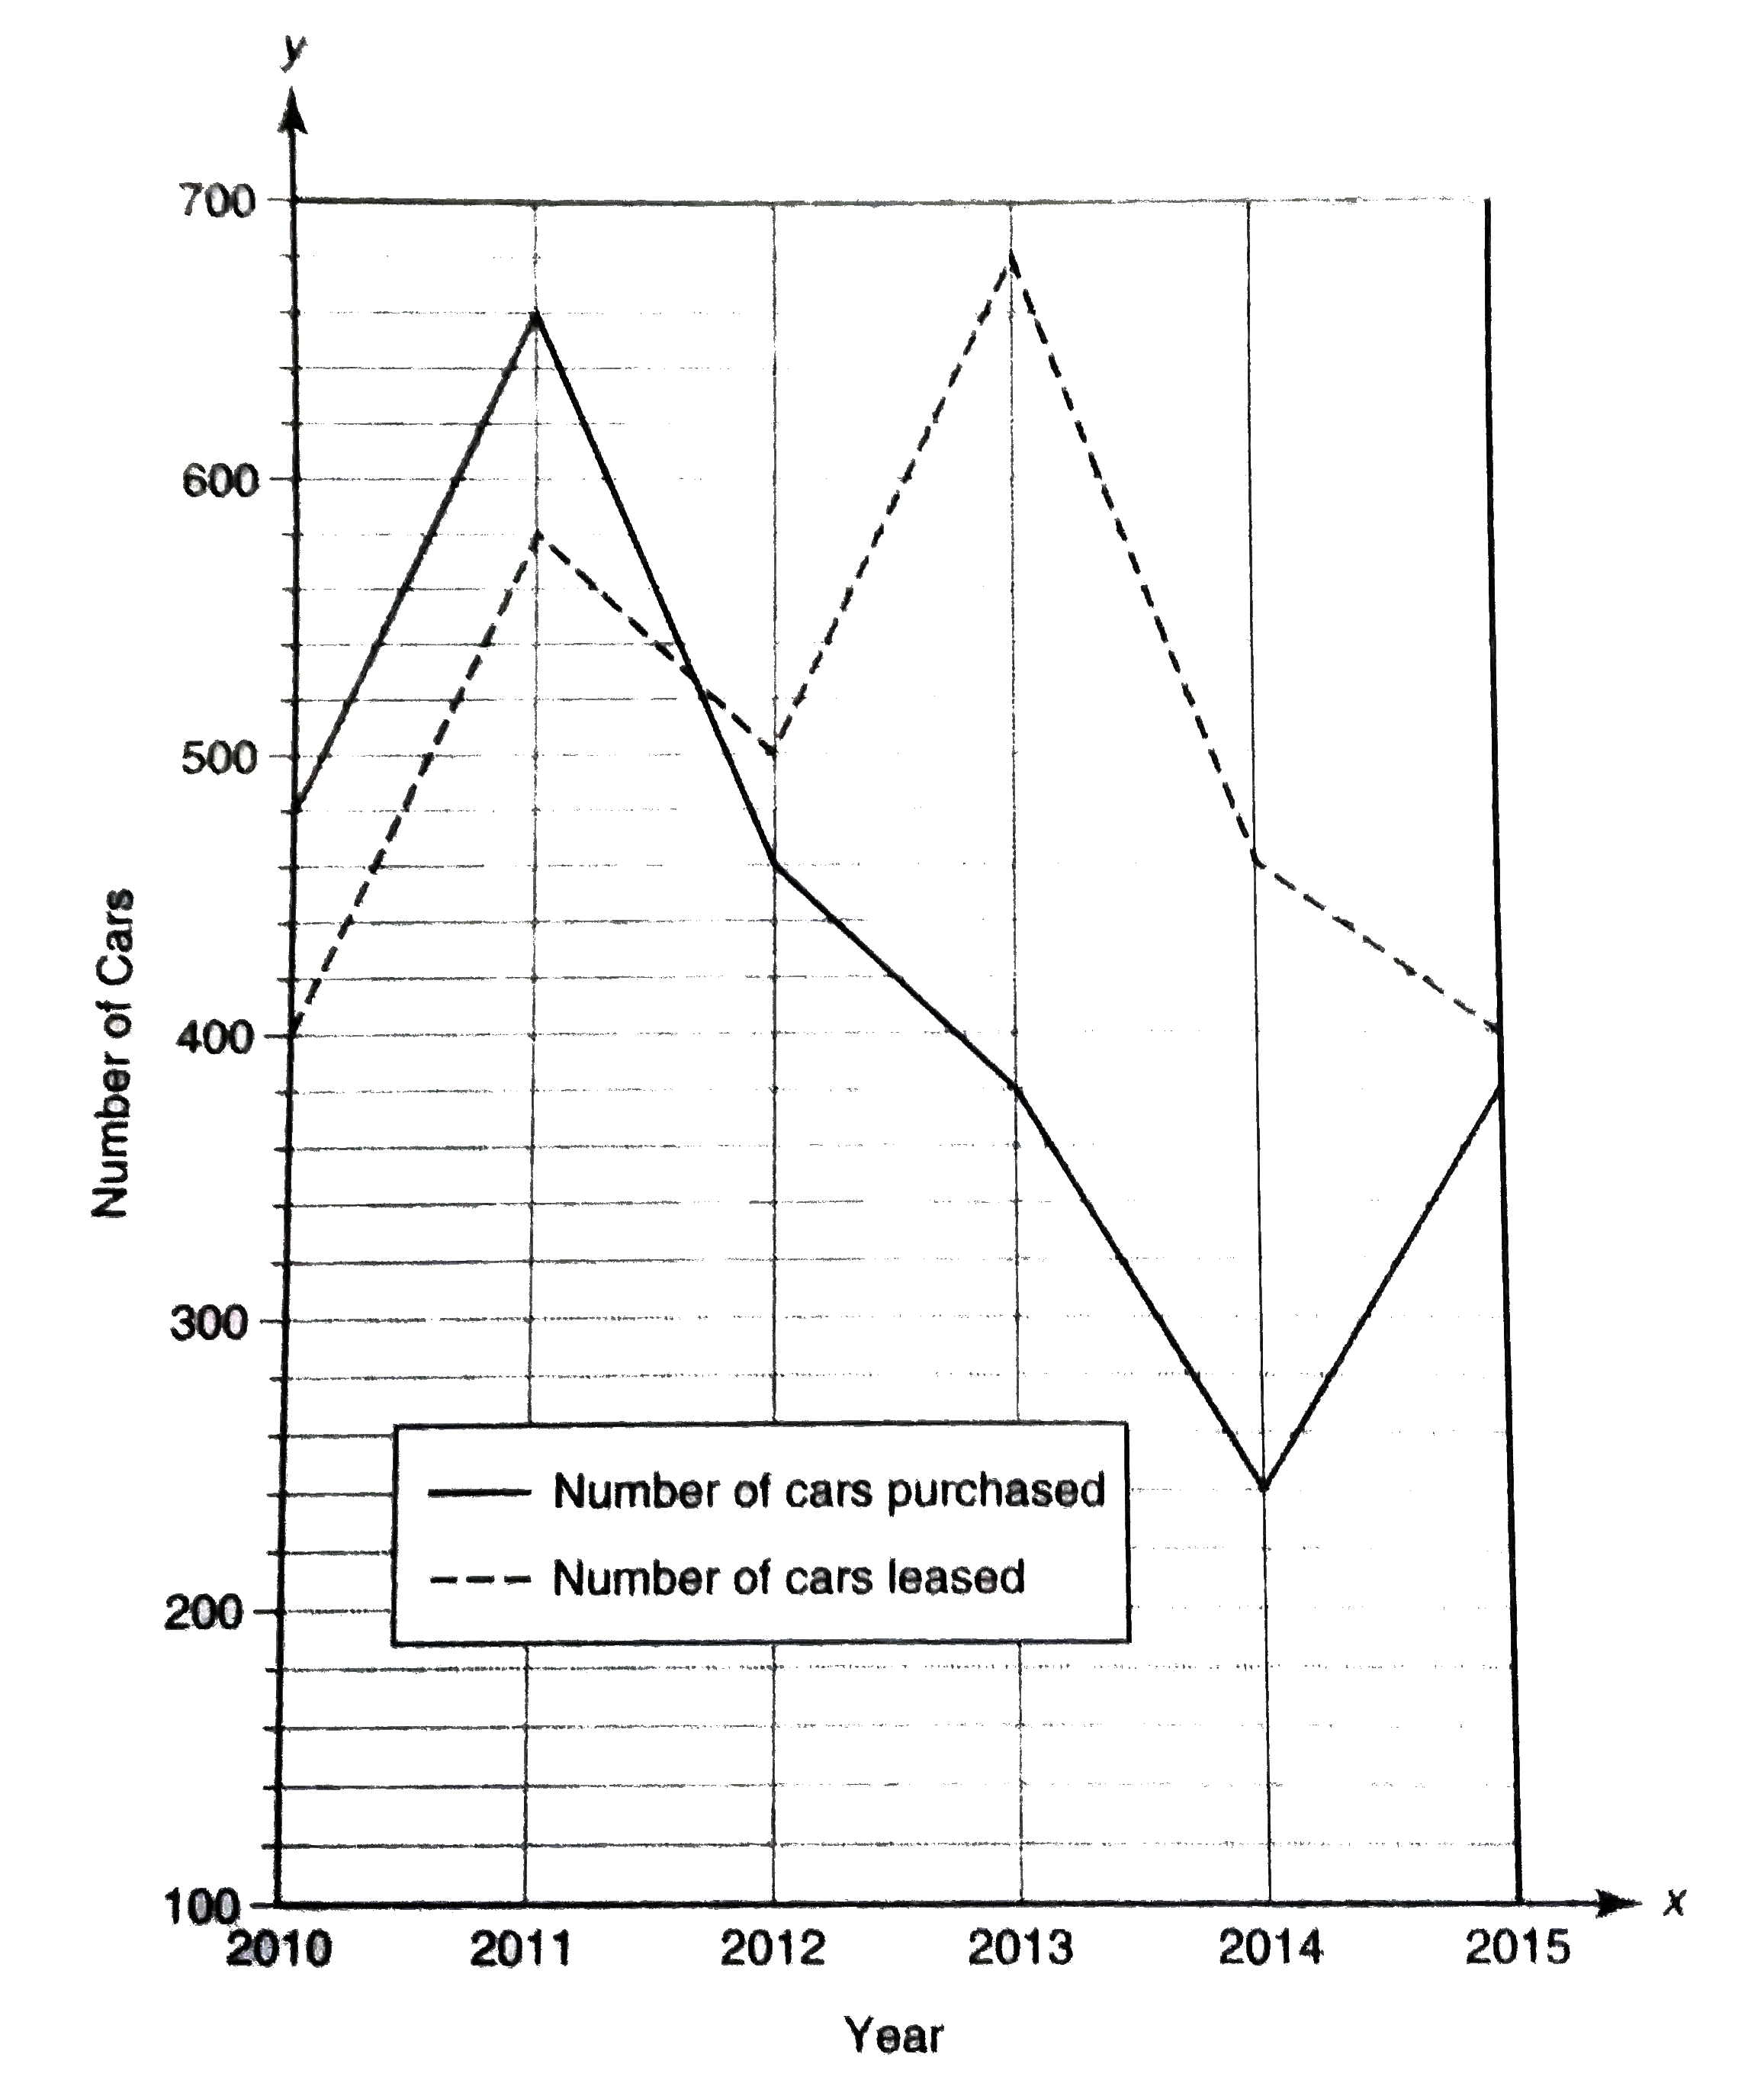
Question 11 and 12 refer to the gaph above.
Q. Which of the following is the best approximation for the decrease in the number of cars purchased per year between 2011 and 2014?A105B140C300D420
The difference between any two consecutive interior angles of a polygon is 5o. If the smallest angle is 120o, find the number of the sides of the polygon.
View SolutionThe number of 5-digit numbers in which no two consecutive digits are identical, is
View Solution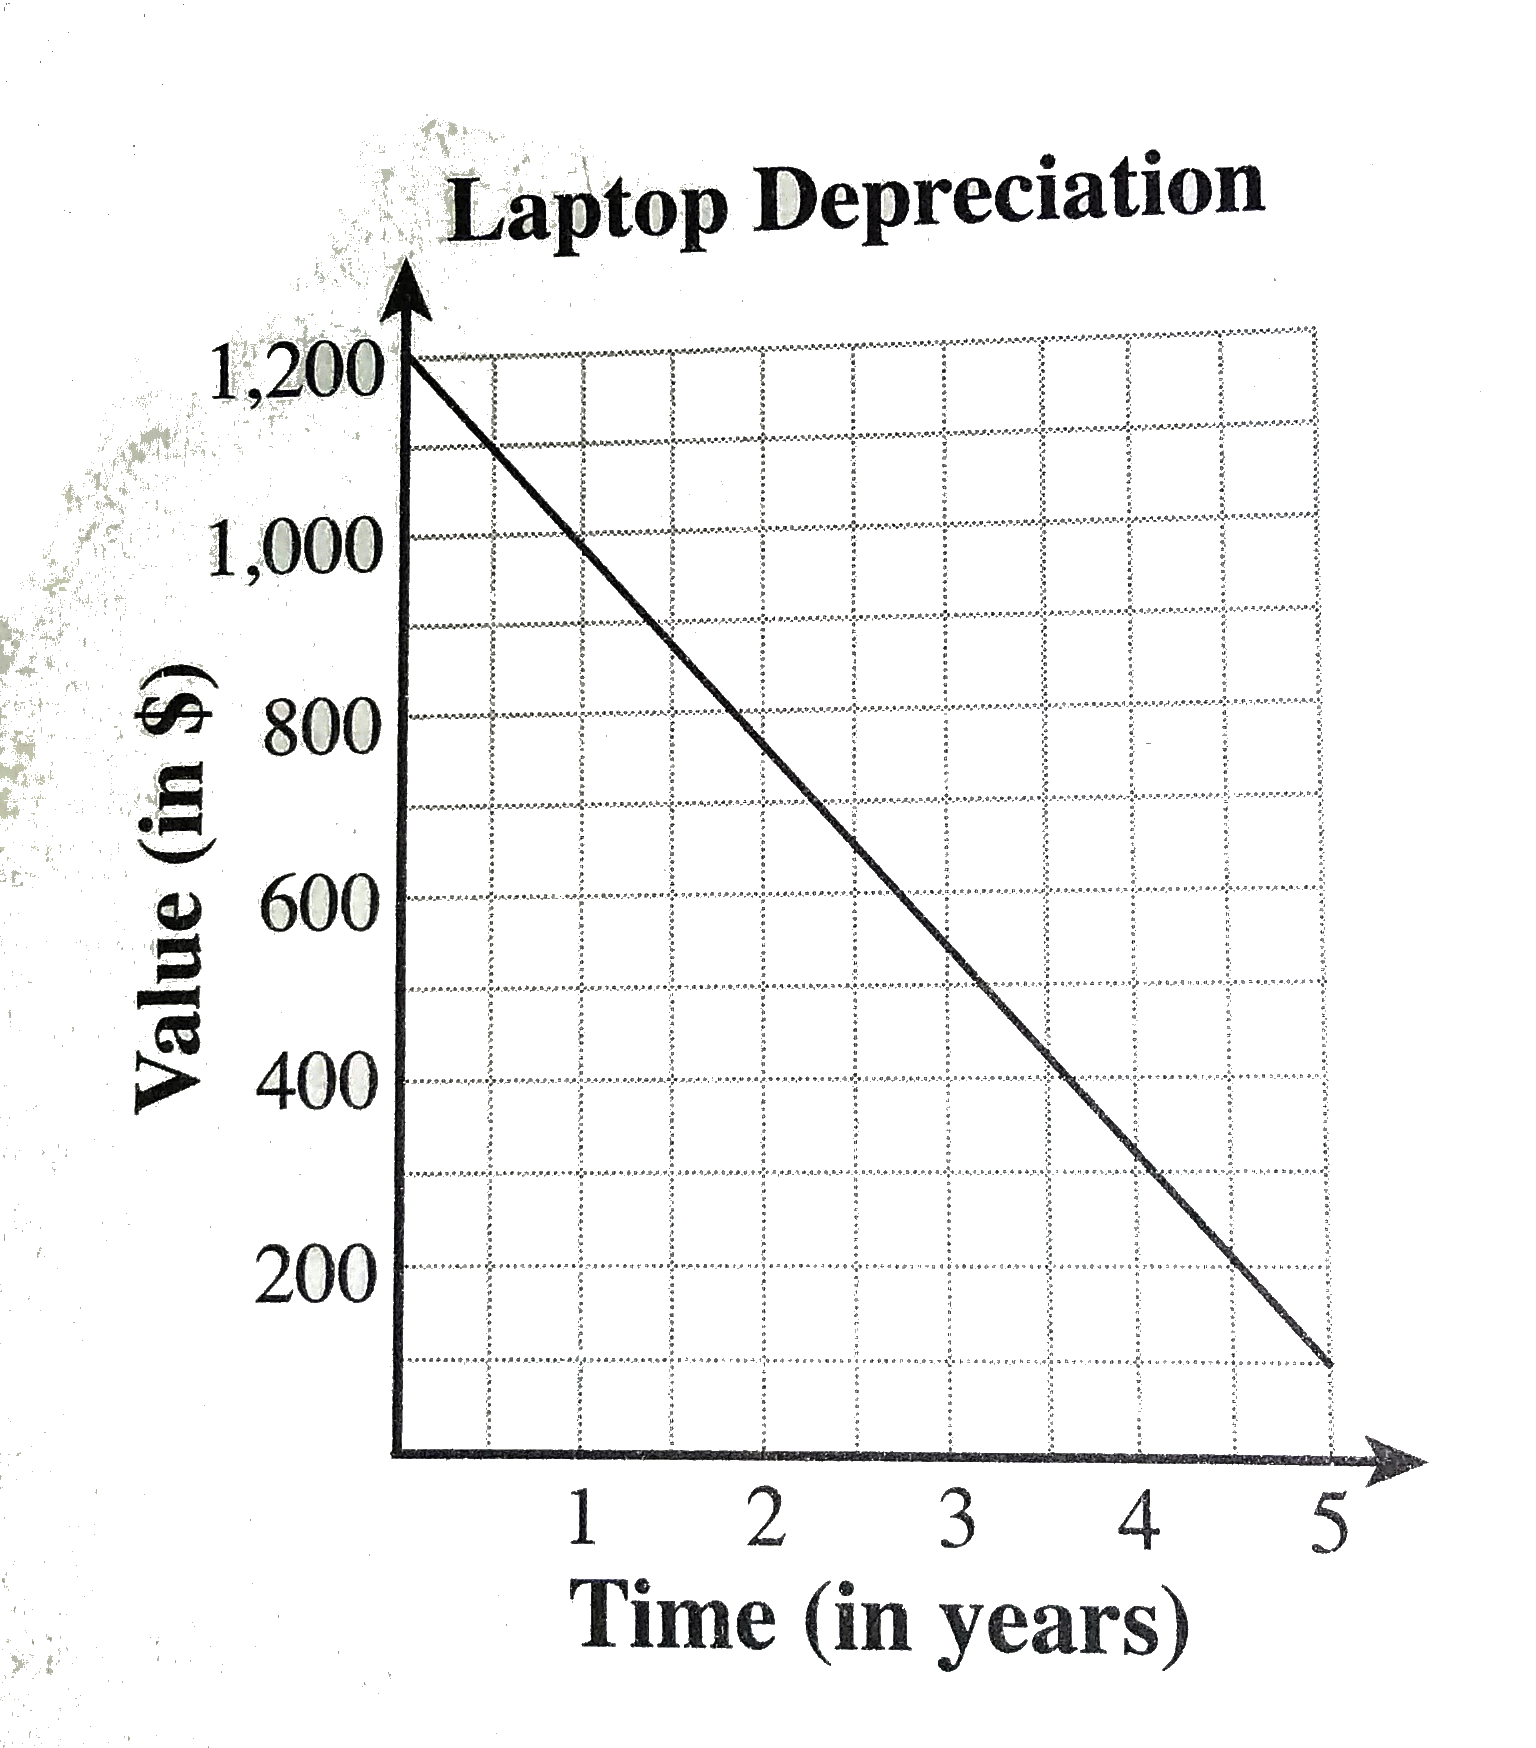
The figure above shows the straight-line depreciation of a laptop computer over the first five years of its use. According to the figure, what is the average rate of change in dollars per year of the value of the computer over the five-year period?
View SolutionRepresent 53and−53 one the number line
View Solution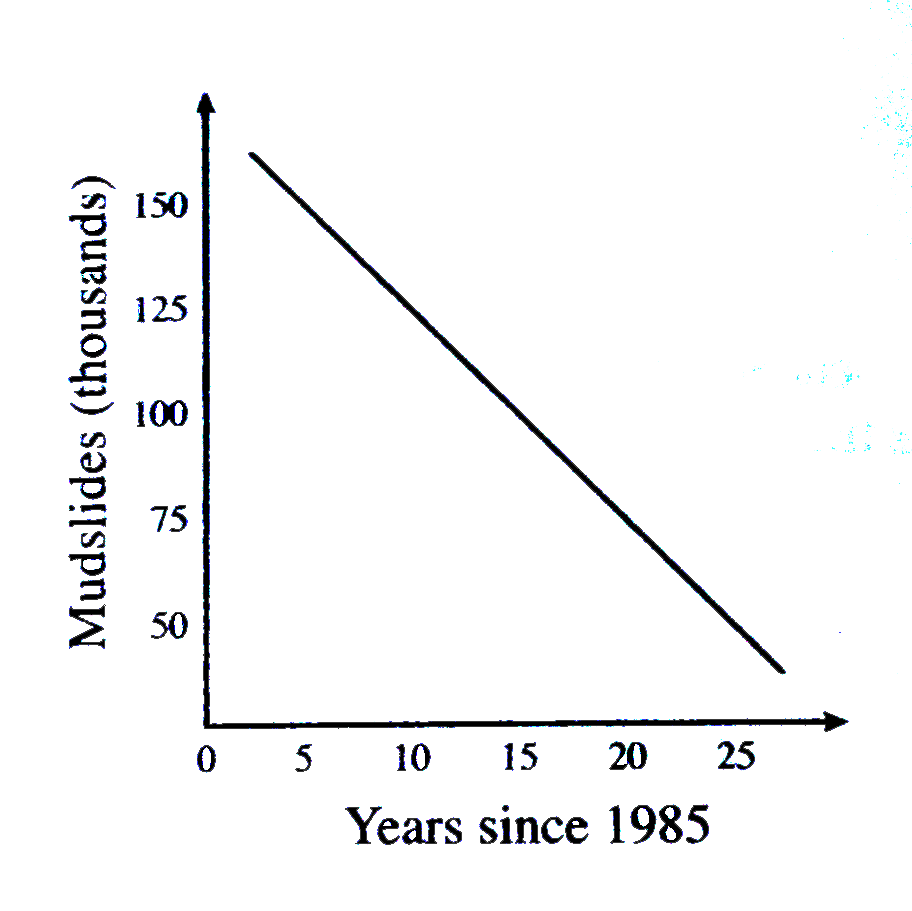
The number of mudslides in a certain country for the past 25 years is approximated by the graph shown above . The graph displays the number of mudslides (in thousands) from 1985 to 2010. Based on the graph , which of the following is closest to the average yearly decrease in the number of mudslides ?
View Solution
