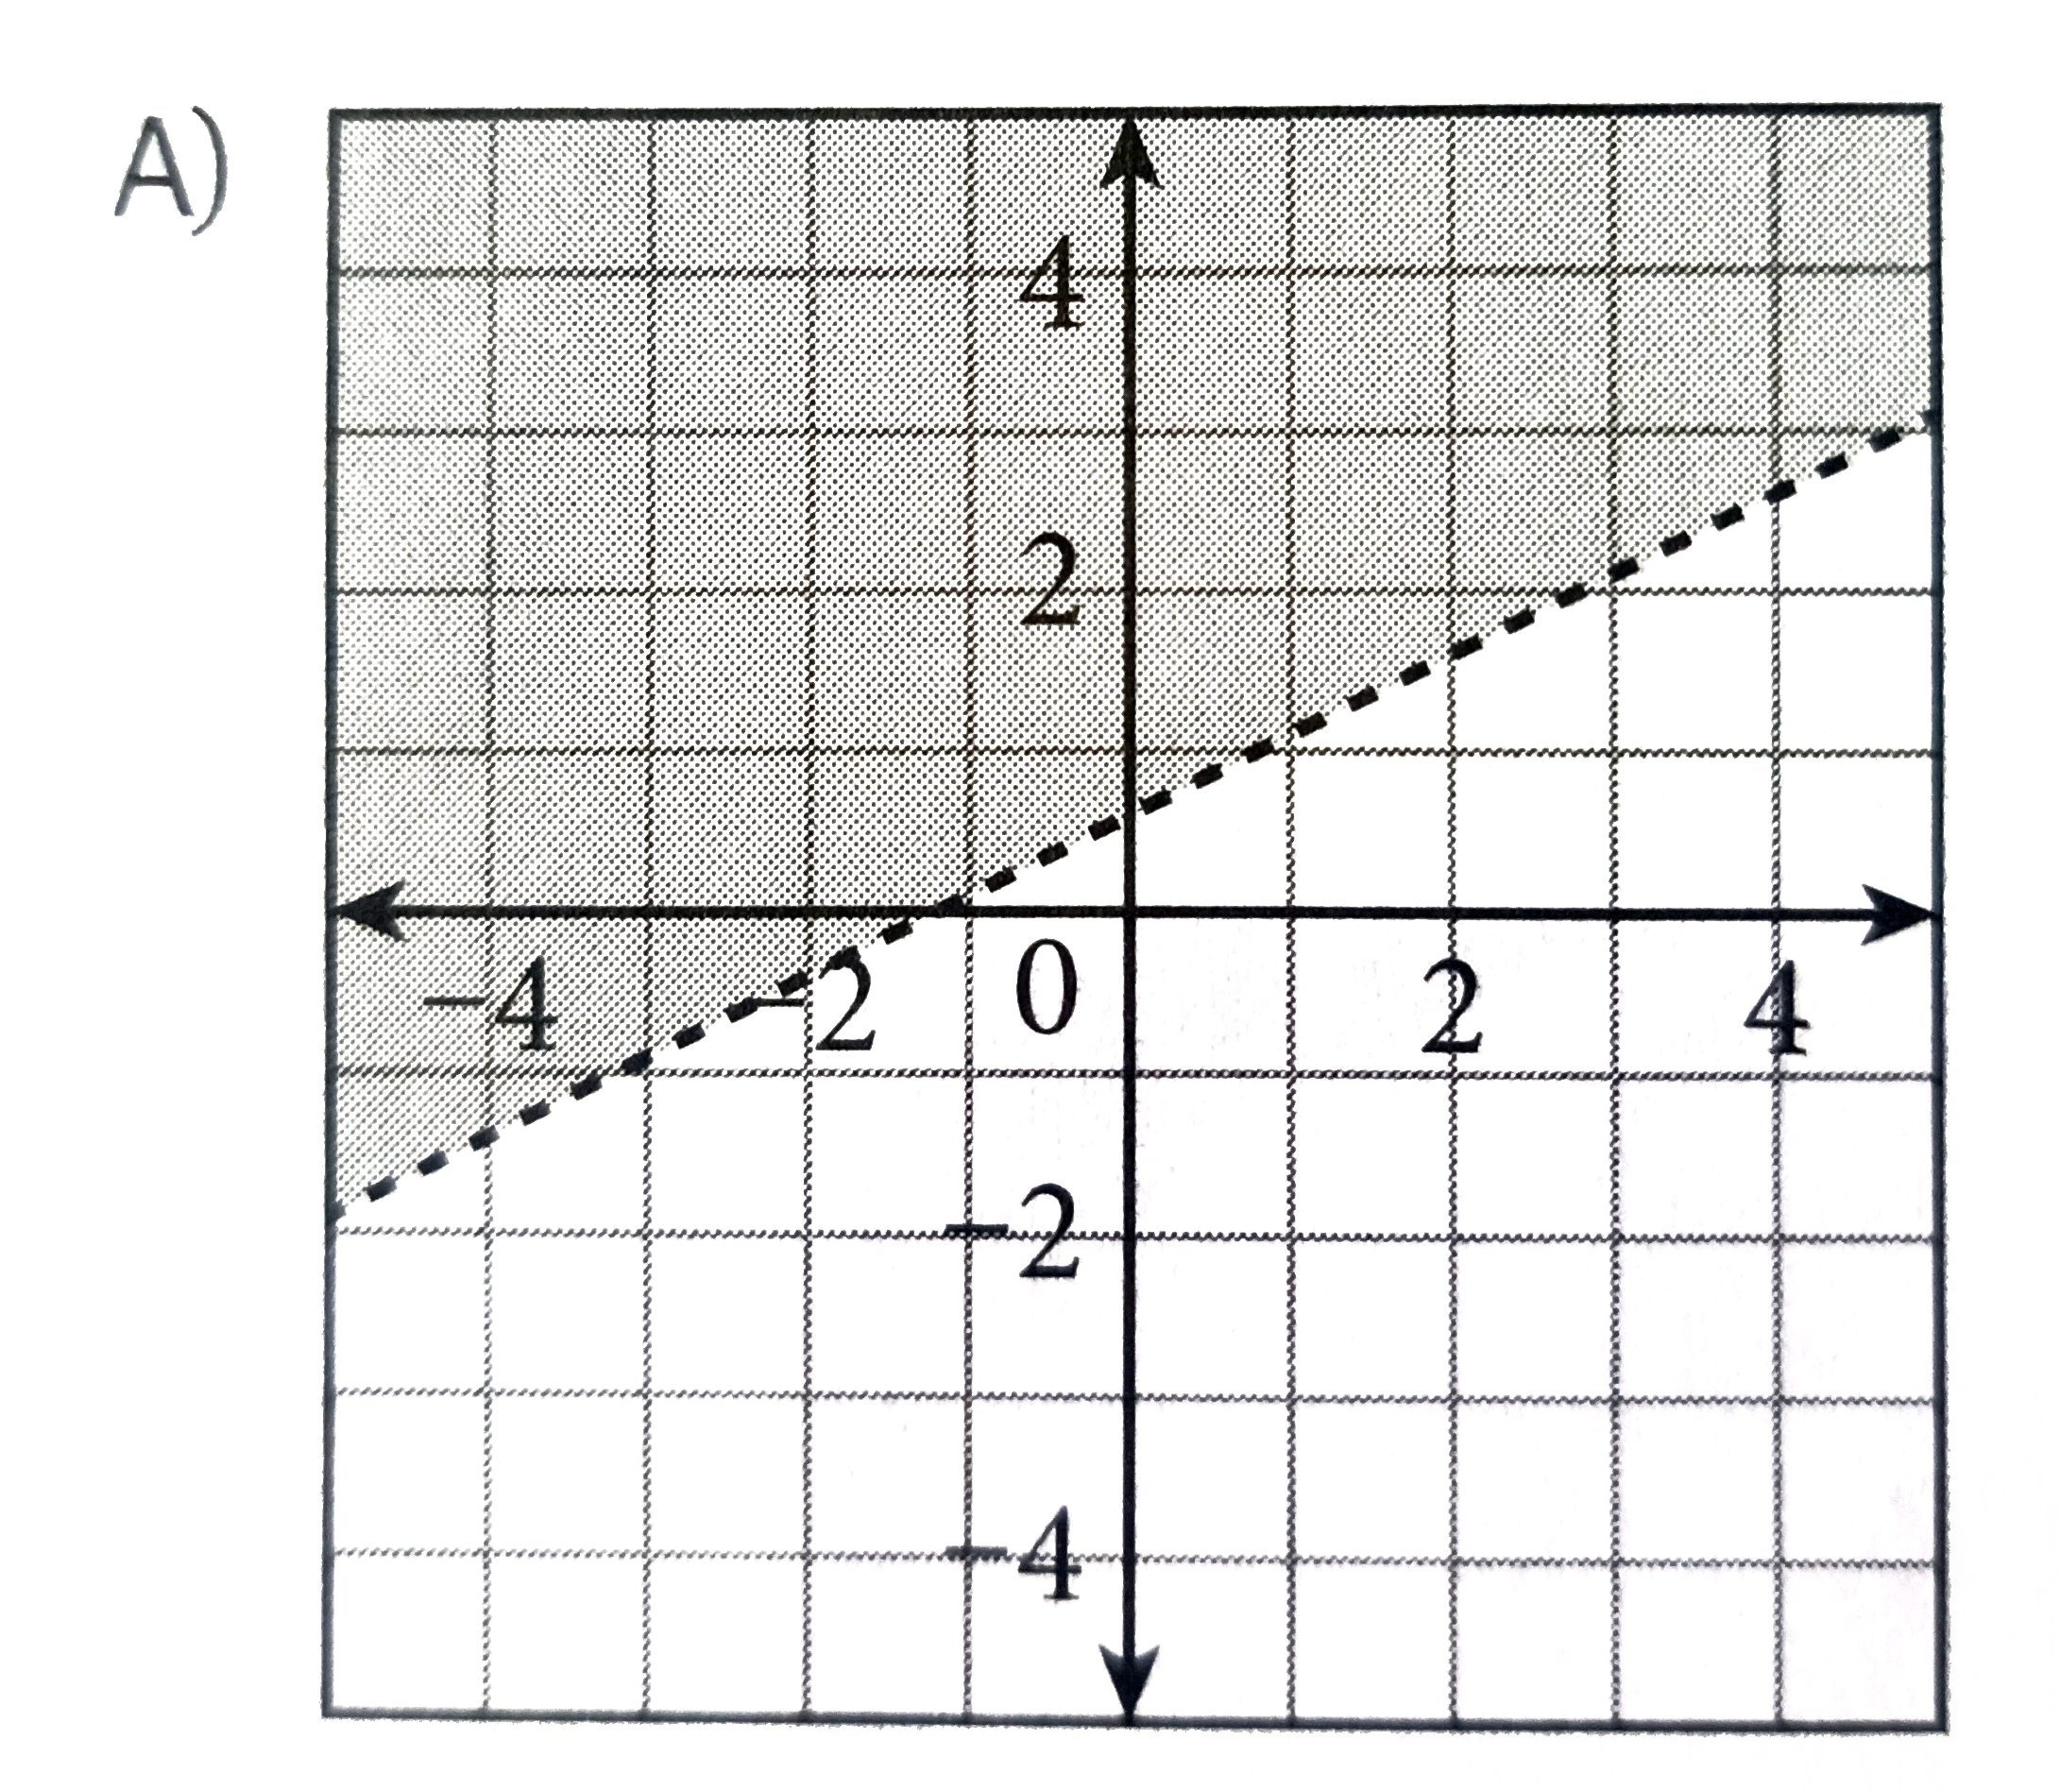
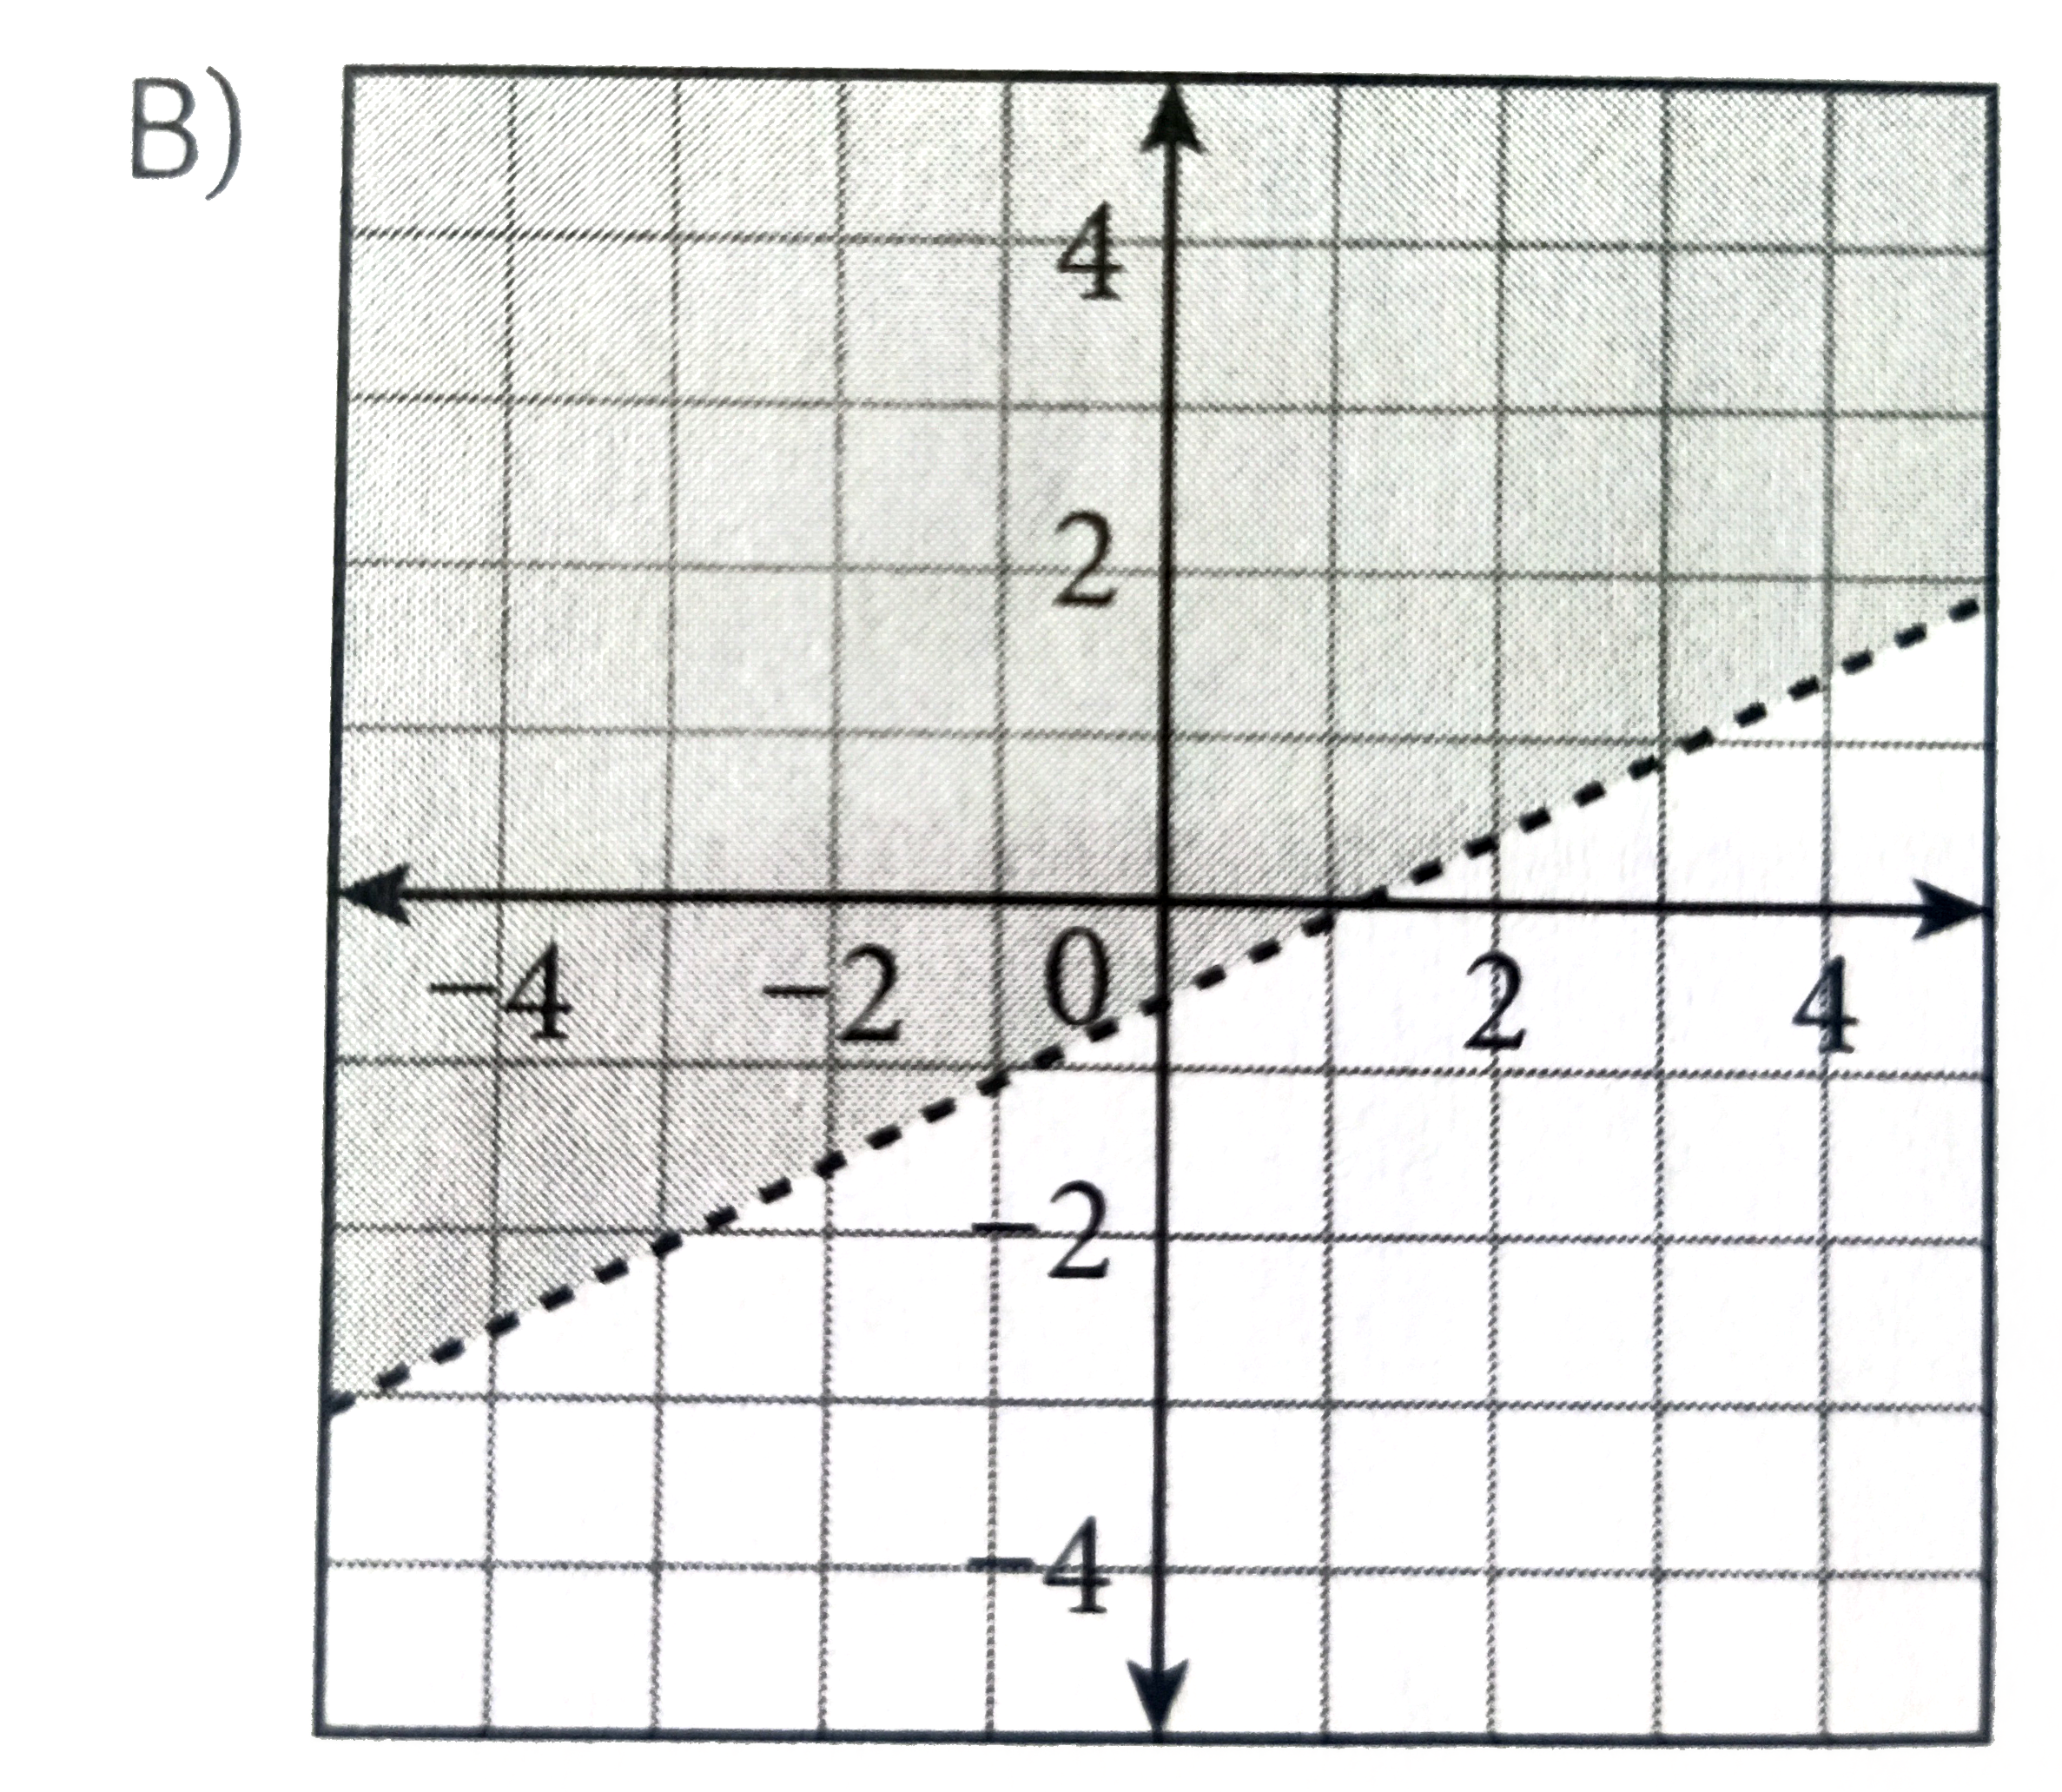
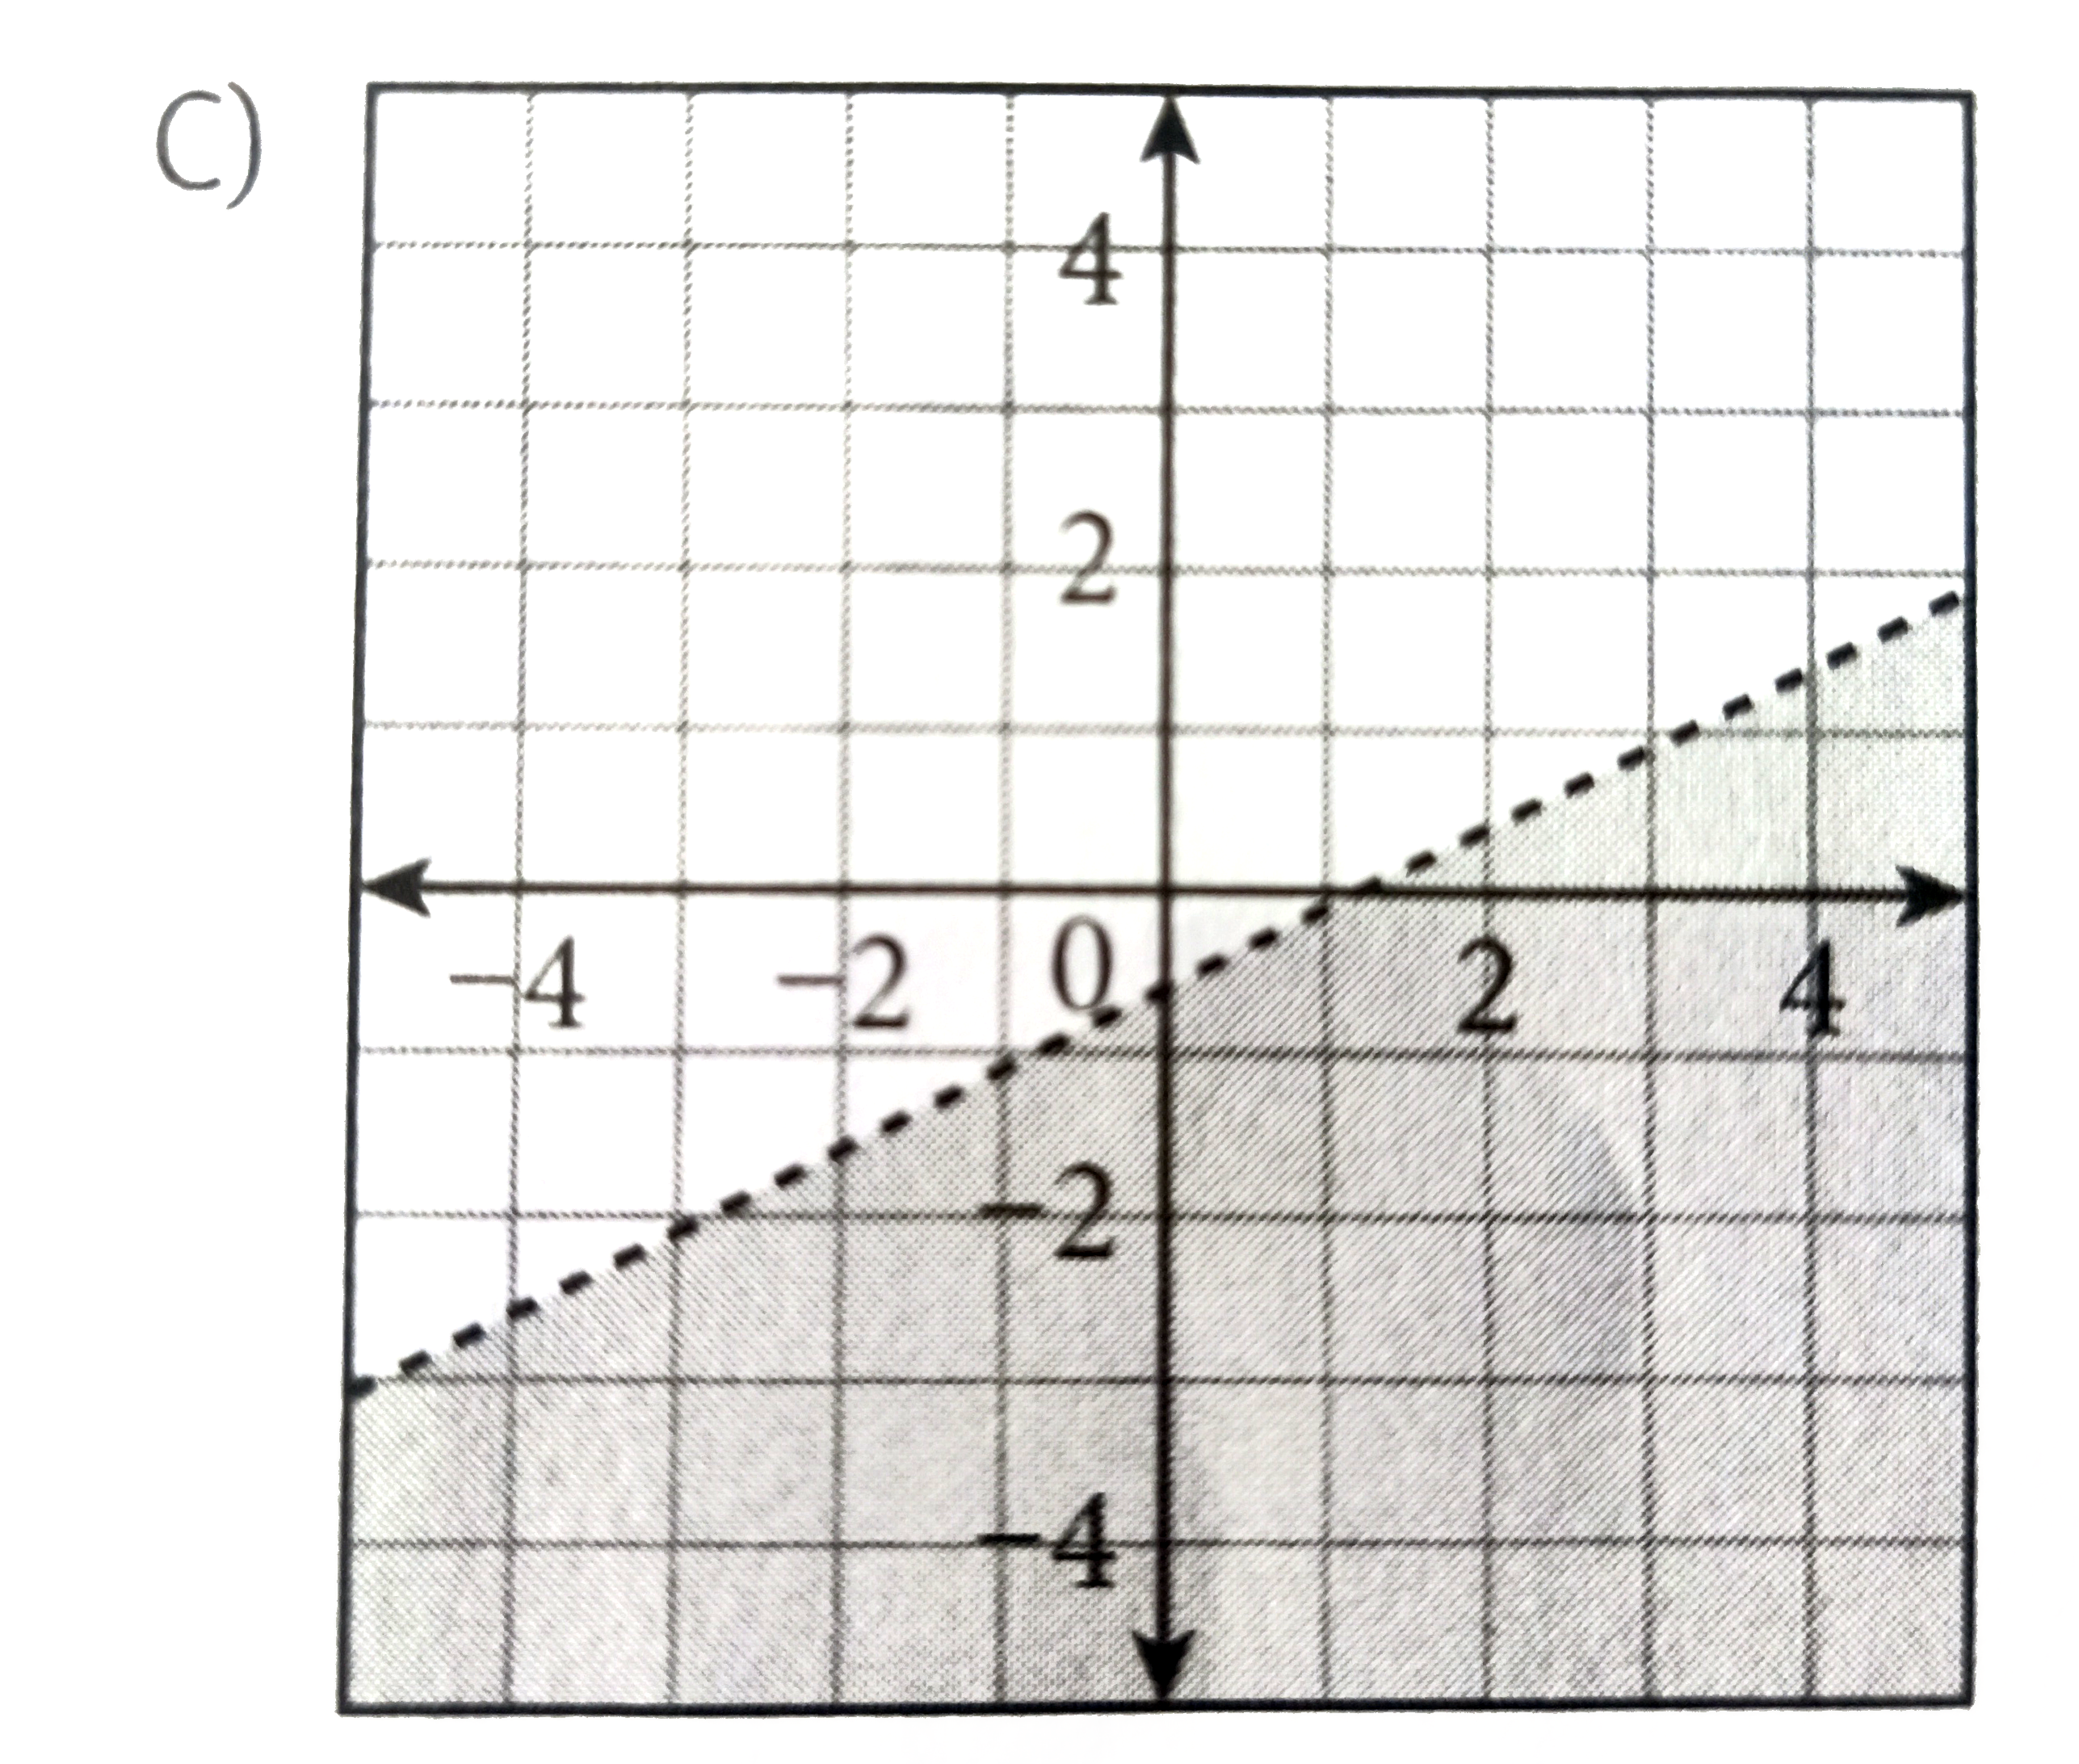
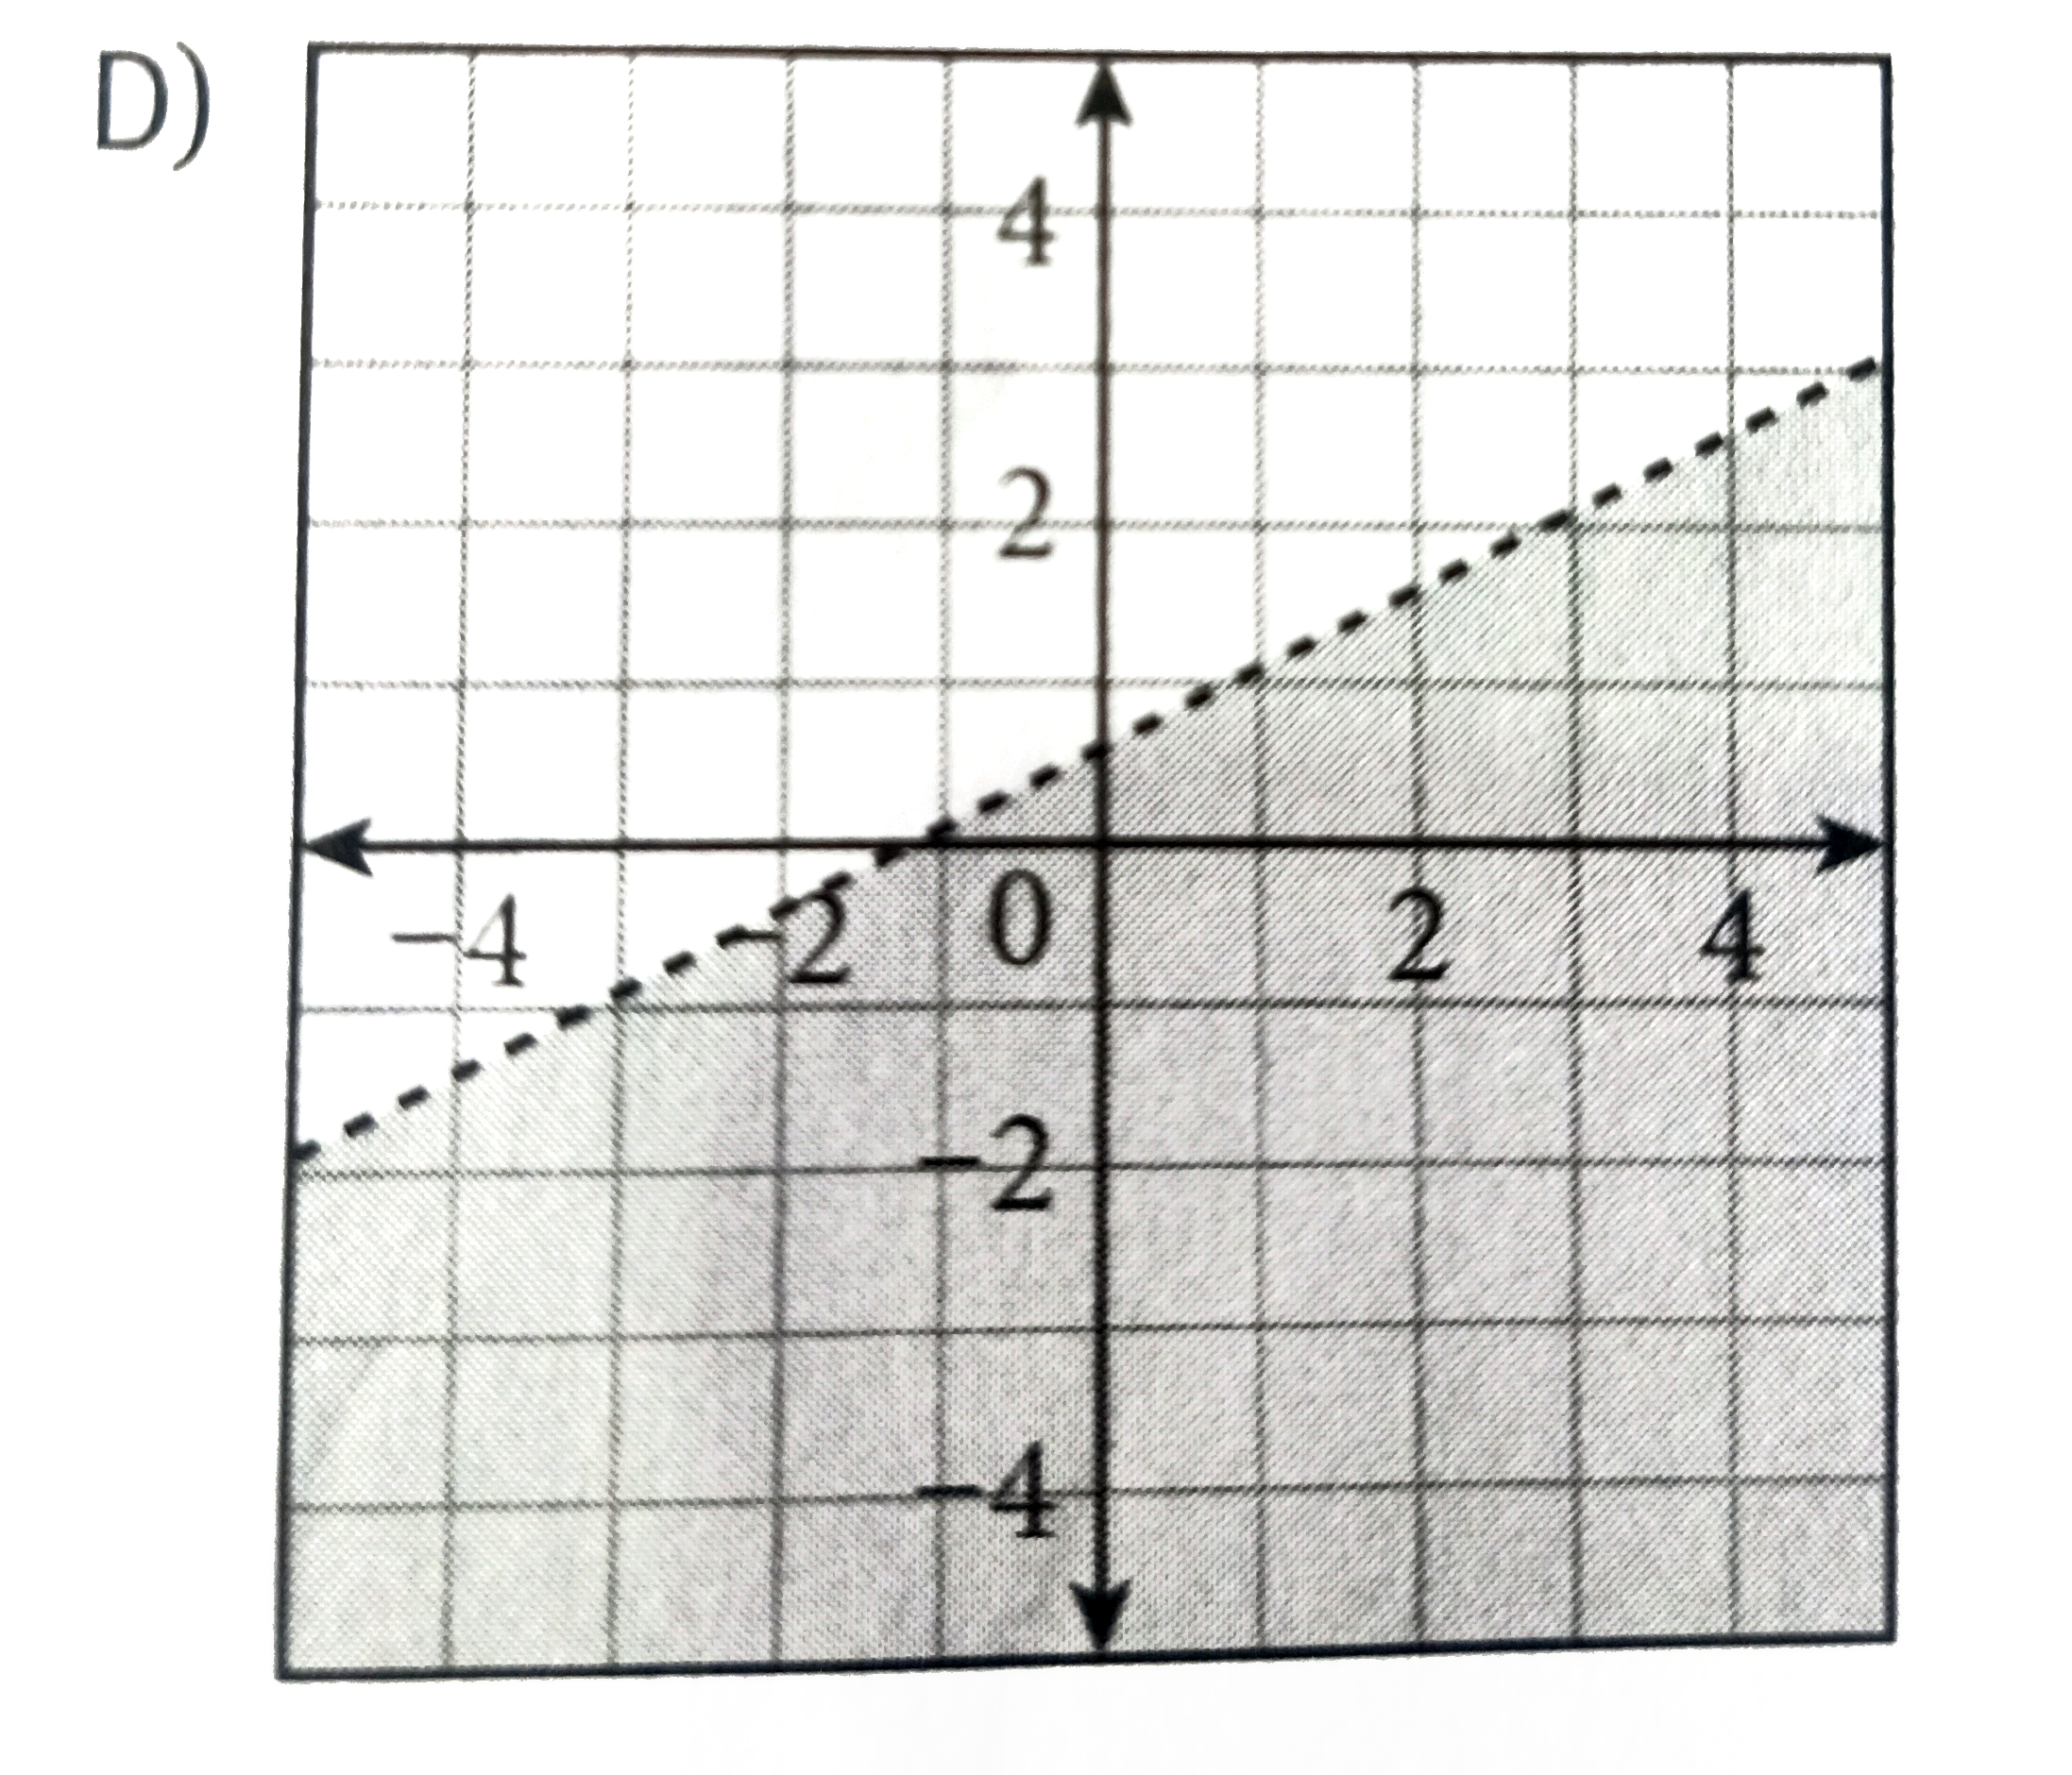
Which of the following graphs represents the soution set for 5x−10y>6 ?
A
B
C
D
Text Solution
The correct Answer is:C
Rewrite the inequalityin slope-intercept from and then identify which half-should be shaded. Substract 5x from both sides of the inequality, divide both sides by −10, and flip the inequality symbol to yield y<12x−35. Eliminate (A) and (D)because they have positive y-intercepts. The "less than" symbol indicates that the half-plane below the line should be shade3d, making (C ) is correct answer.
|
Topper's Solved these Questions
- INEQUALITIESBOOK - KAPLANCHAPTER - INEQUALITIESEXERCISE - SYSTEM OF INEQUALITIES
1 Videos
- INEQUALITIESBOOK - KAPLANCHAPTER - INEQUALITIESEXERCISE - MODELING REAL-LIFE SITUATIONS WITH INEQUALITIES
1 Videos
- INEQUALITIESBOOK - KAPLANCHAPTER - INEQUALITIESEXERCISE - TRY ON YOUR OWN
26 Videos
- IMAGINARY NUMBERS BOOK - KAPLANCHAPTER - IMAGINARY NUMBERS EXERCISE - ARITHMETIC OPERATIONS WITH COMPLEX NUMBERS
1 Videos
- LINEAR EQUATIONS AND GRAPHSBOOK - KAPLANCHAPTER - LINEAR EQUATIONS AND GRAPHSEXERCISE - LINEAR GRAPH
1 Videos
Similar Questions
Knowledge Check
Which of the following graph represents e−x?
A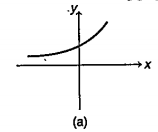 B
B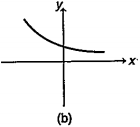 C
C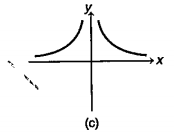 D
D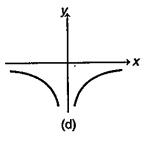
Which of the following graph represents e−x?
A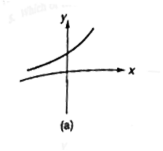 B
B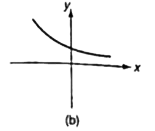 C
C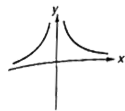 D
D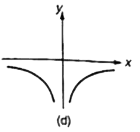
Which of the following graph represents e−x?
A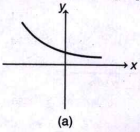 B
B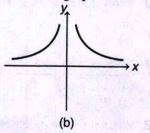 C
C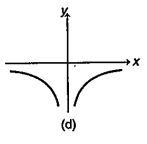 D
D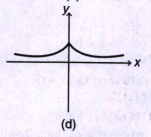
Which of the following represent graph of equation y=x+|x|.
View SolutionWhenever a>0 , which of the following number line graphs represents the solutions for x to the inequality |x−a|≤3 ?
View Solution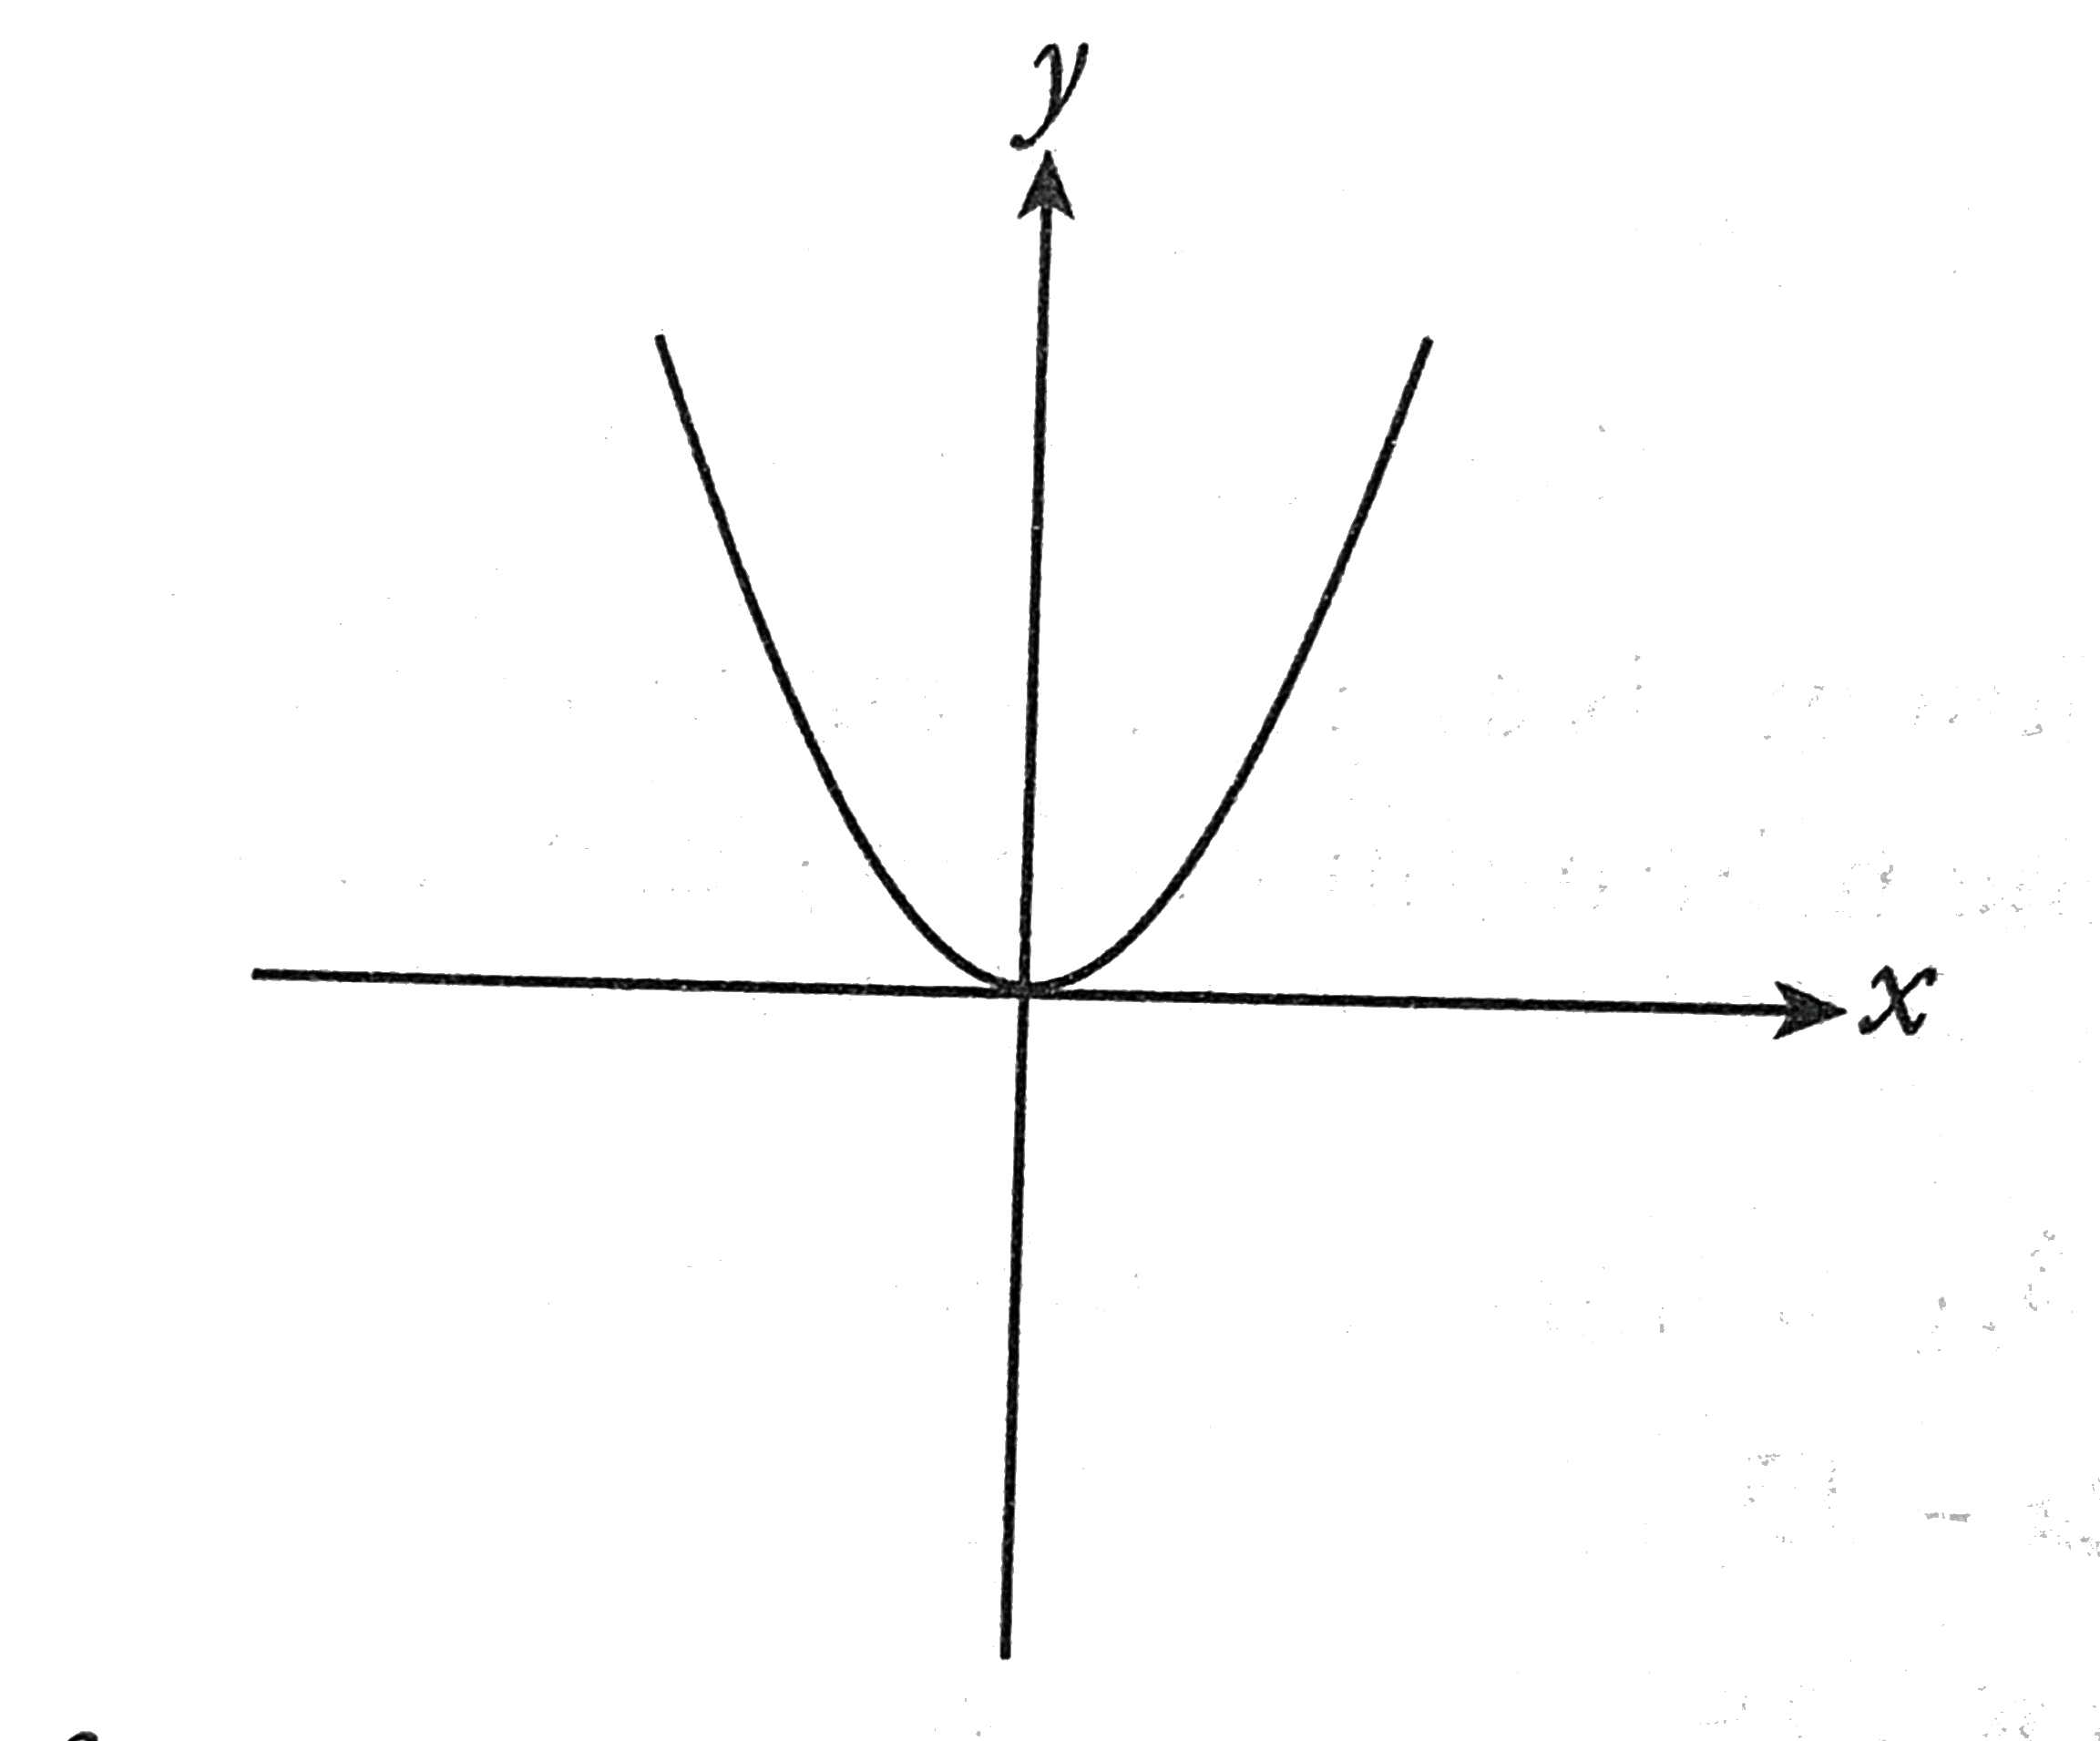
The quadratic y=f(x) is shown above. Which of the following graphs represents the function y=f(x+3)−4?
View SolutionWhich of the following is the solution set of ∣∣∣23x−5∣∣∣>8?
View SolutionWhich of the following represents the graph of e−x2:
View Solution

