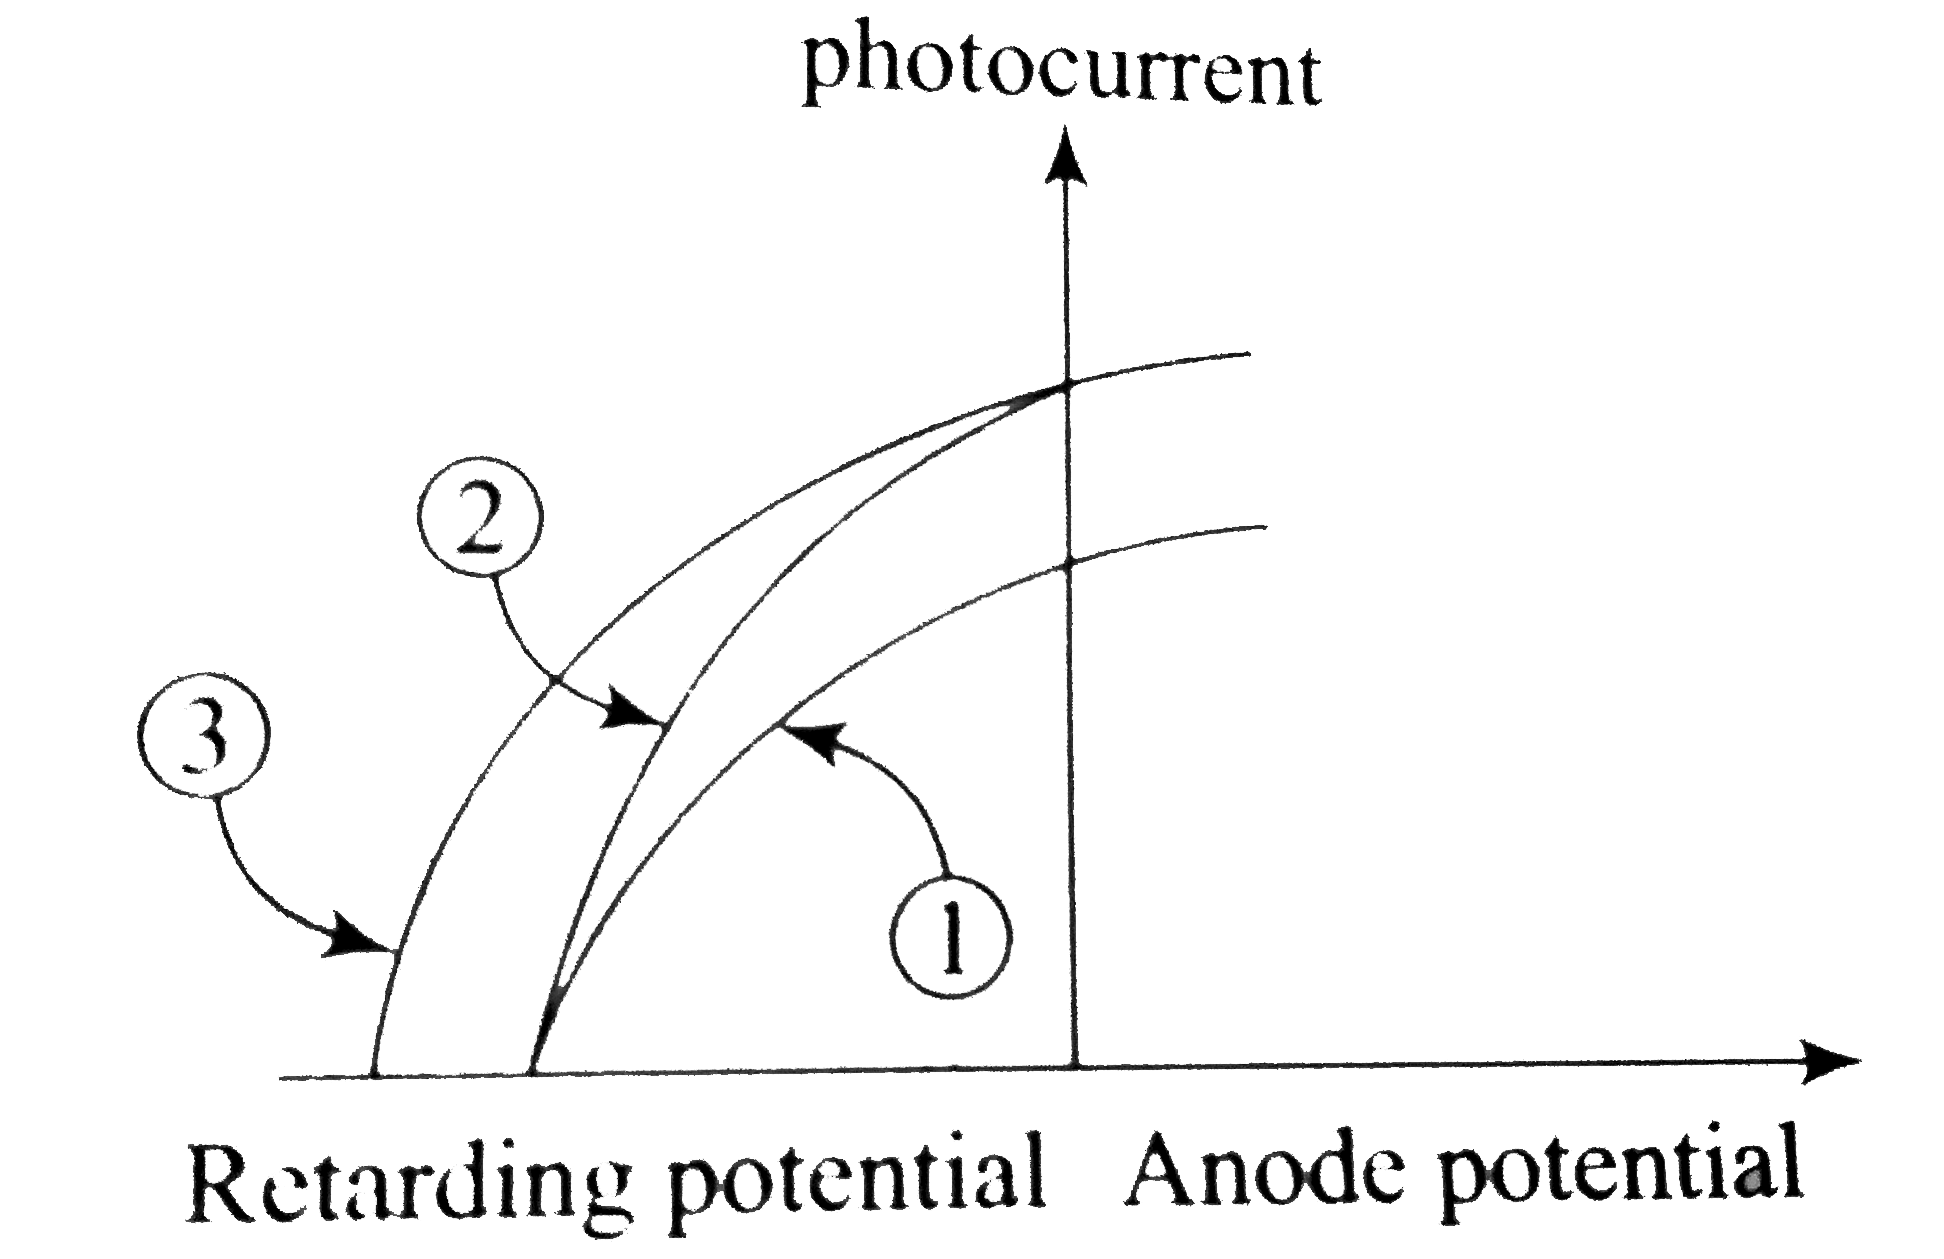
The graph shows the variation of photocurrent with the applied voltage in a photoelectric effect experiment for three different beams of light falling on identical metal surfaces, then which among the following is correct ?
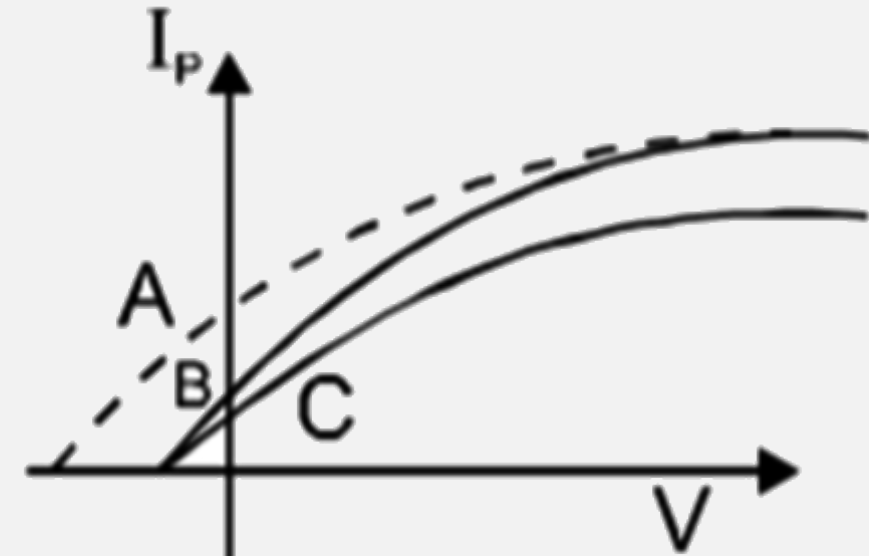
A and B receive the light of the same intensity while B & C receive the light of the same frequency
B and C recieve the light of the same intensity while A & B receive the light of the same frequency
A & B receive the light of the same frequency while B & C receive the light of the same intensity
A and C reveive the light of the same intensity and B & C receive the light of the same frequency
The correct Answer is:A
Step by step video & image solution for The graph shows the variation of photocurrent with the applied voltage in a photoelectric effect experiment for three different beams of light falling on identical metal surfaces, then which among the following is correct ? by Physics experts to help you in doubts & scoring excellent marks in Class 12 exams.
Updated on:21/07/2023Similar Questions
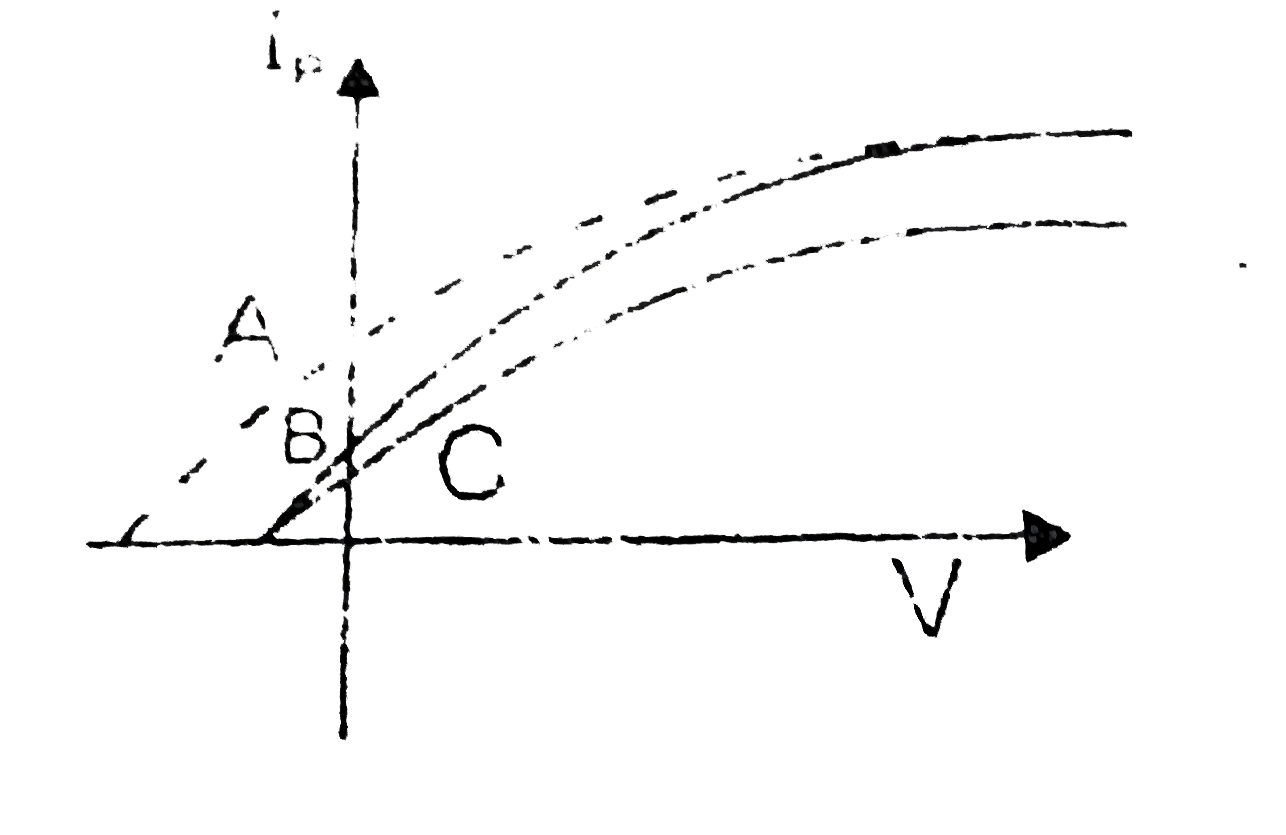
The graph is showing the photocurrent with the applied voltage of a photoelectric effect experiment. Then
 .
.
View SolutionIn photoelectric effect experiment potential difference between plates increases keeping incident light on cathode plate remains unchanged which of the following is correct about saturation current :
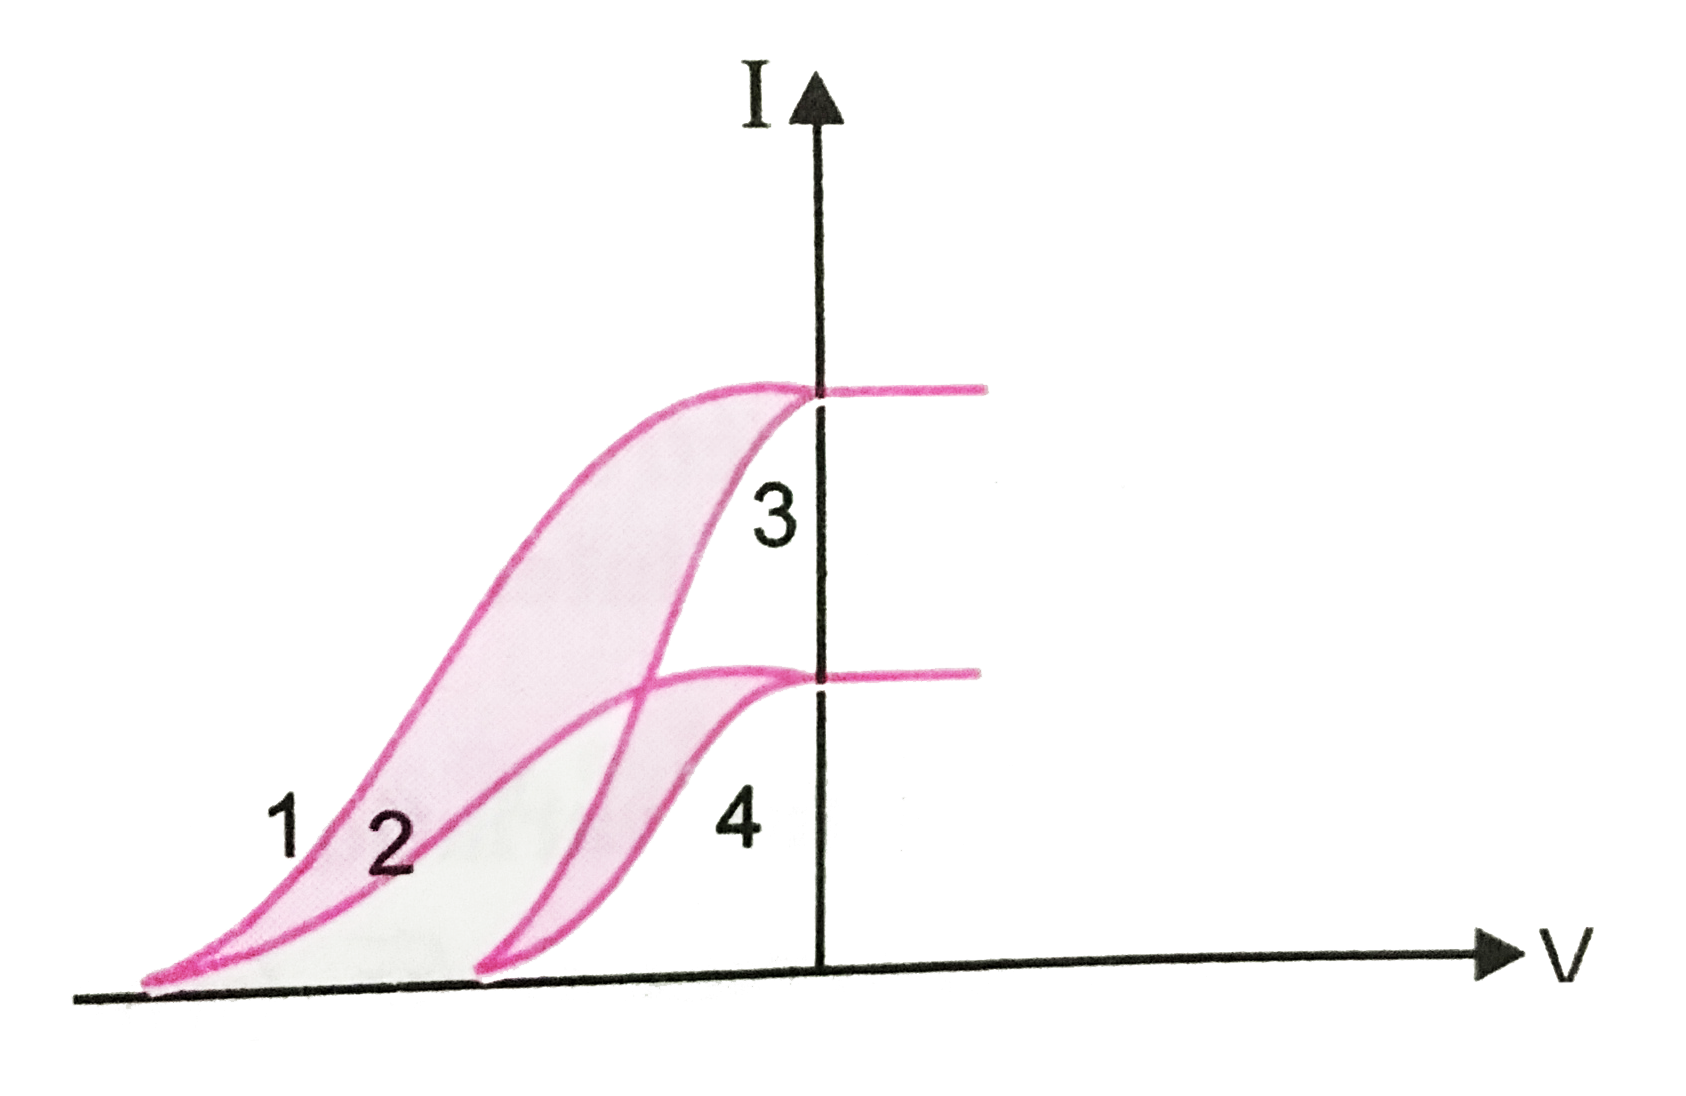
View SolutionThe graph of Fig. shows the variation of photoelectric current (I) versus applied voltage (V) for the two different photosensitive materials for two different intensities of the incident radiation. Identify the pairs of curves that correspond to different materials but same intensity of incident radiation.
View SolutionThe following graph shows the variation of photoelectric current for a photosensitive metal .
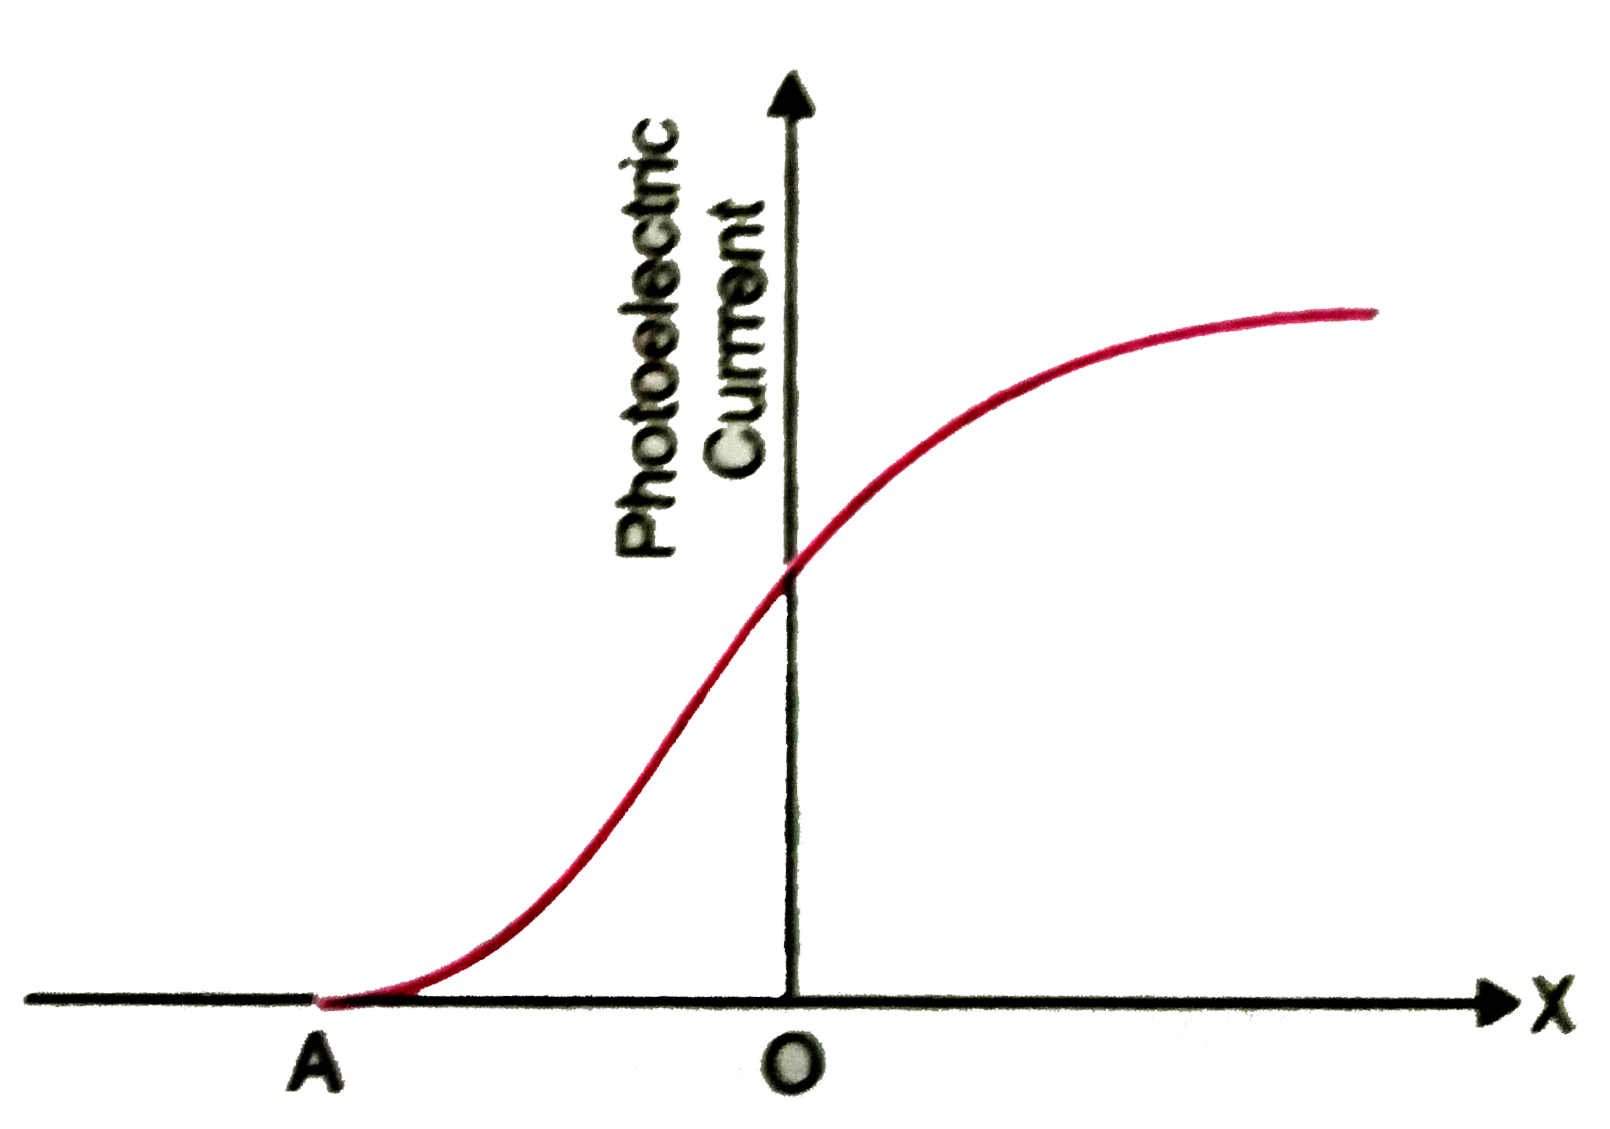
Identify the variable X on the horizontal line.
View SolutionThe figure shows a plot of photo current versus anode potential for a photosensitive surface for three different radiations. Which one of the following is a correct statement ?
View SolutionThe curves (a),(b),(c) and (d) show the variation between the applied potential difference (V) and the photoelectric current (i) , at two different intensities of light (I1>I2). In which figure is the correct variation shown ?
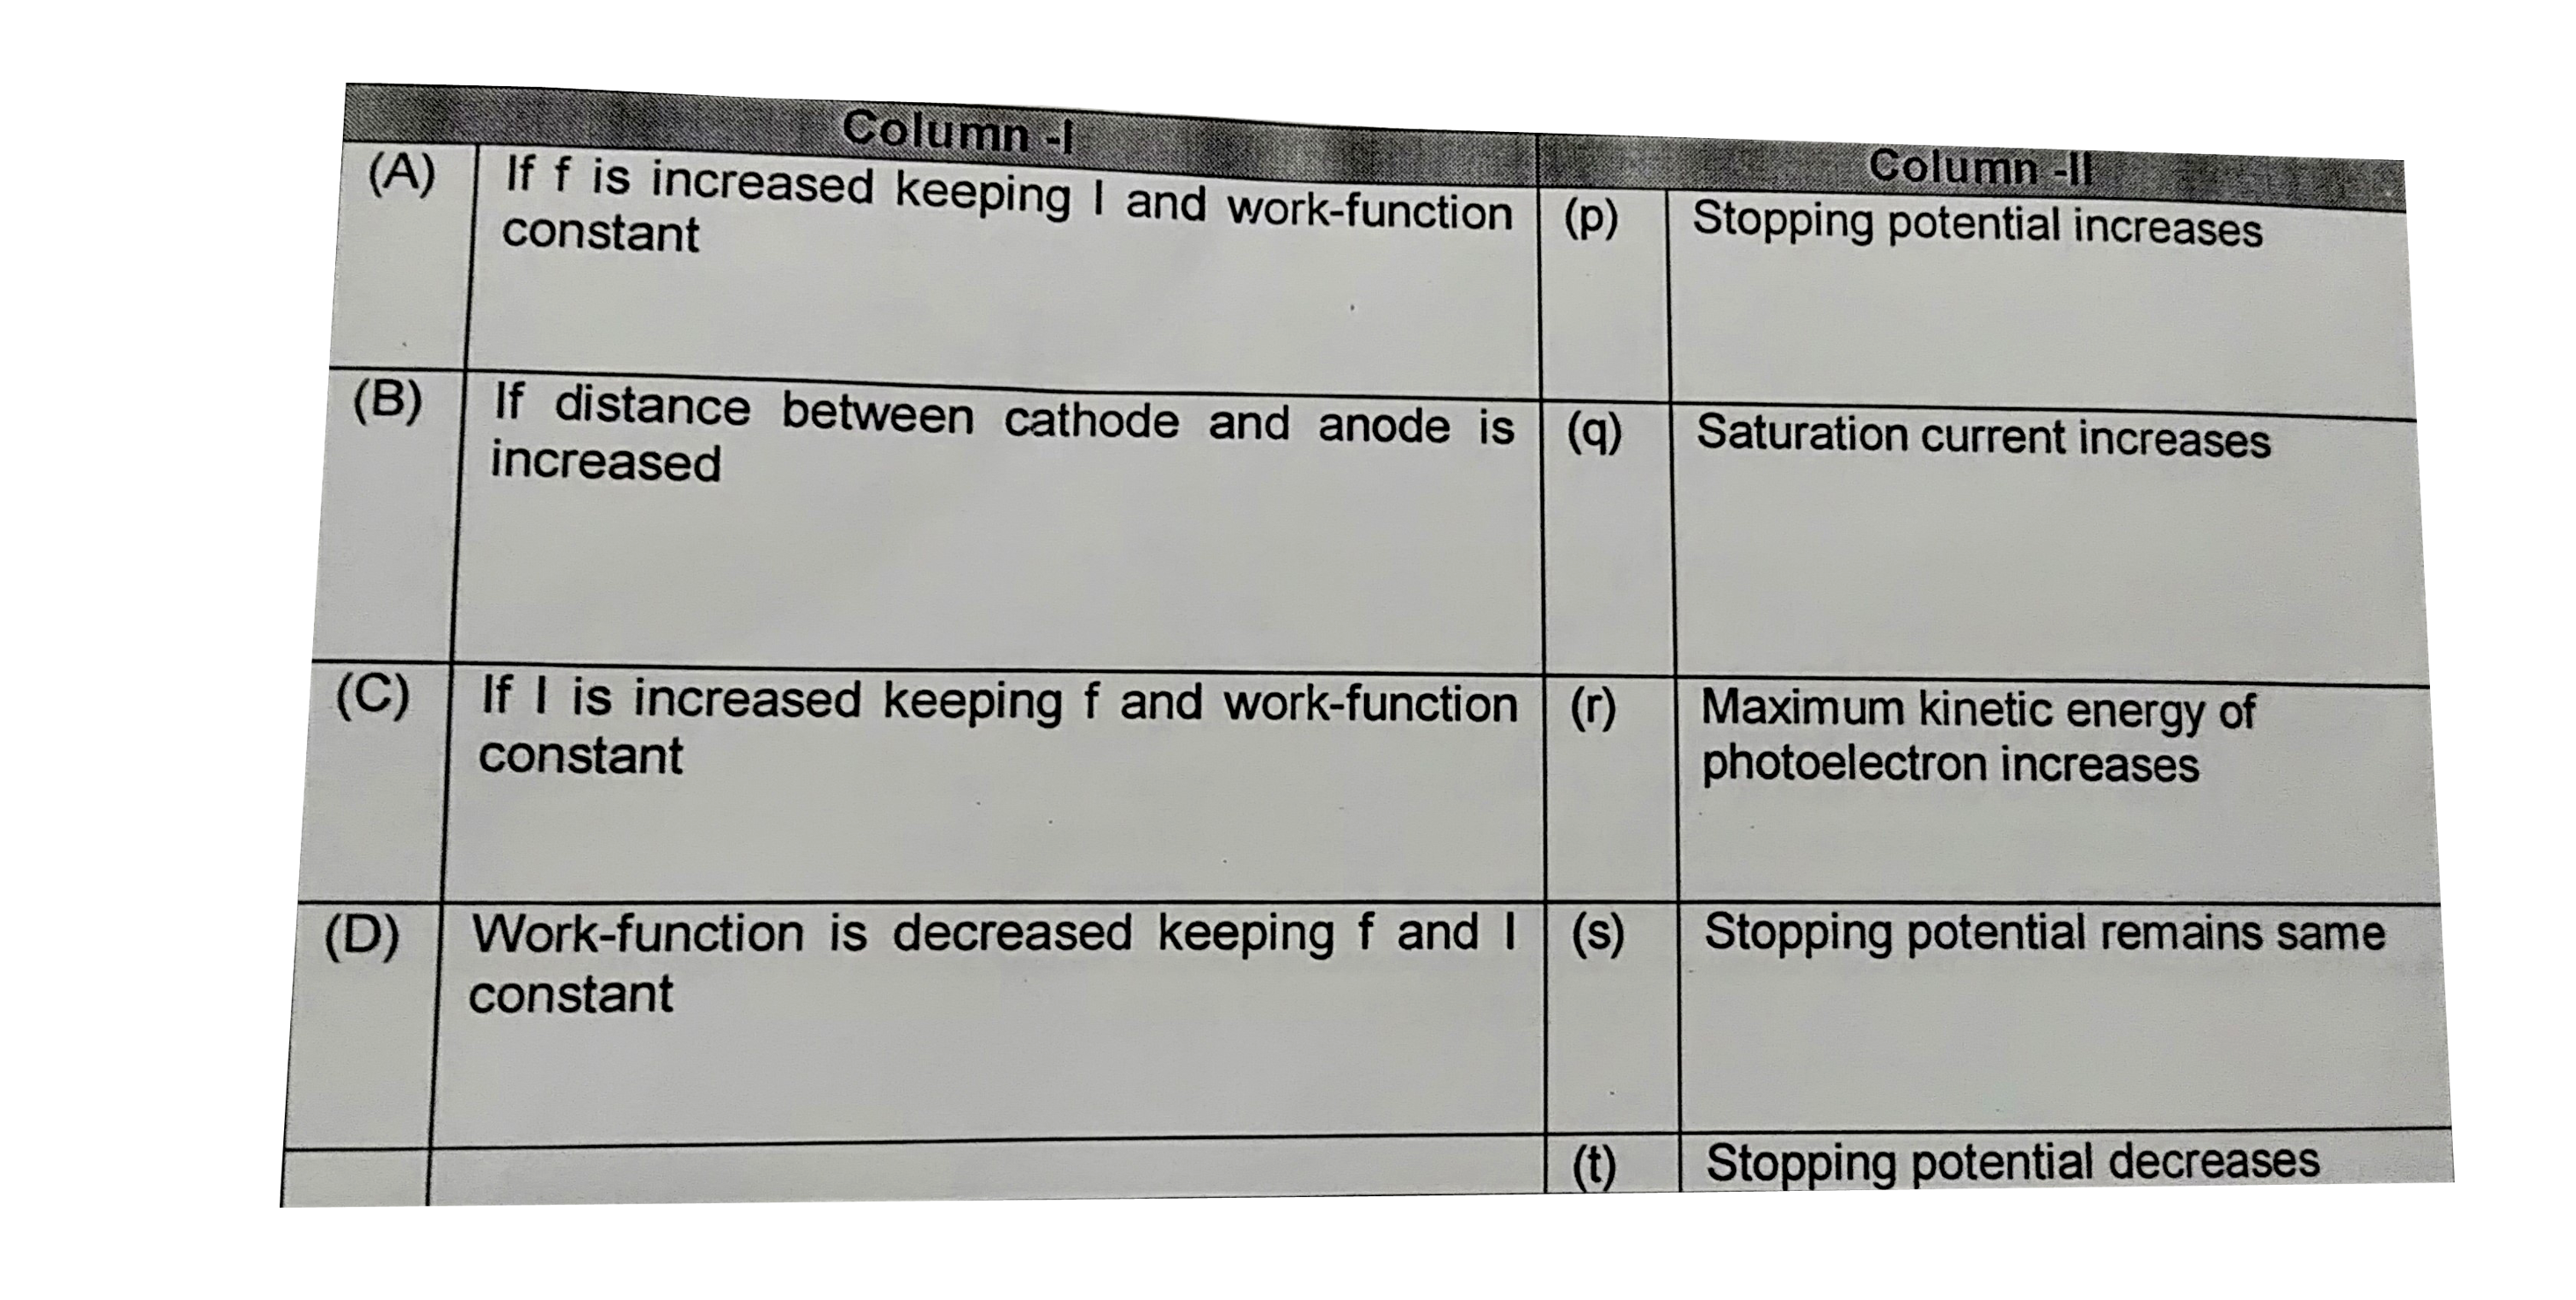
View SolutionIn the photoelectric effect experiment, if f is the frequency of radiation incident on the metal surface and I is the intensity of the intensity radiations, then match the following columns:
View SolutionThe figure shows the variation of photocurrent with anode potential for a photosensitve surface for three different radiations. Let la,lbandlc be the curves a, b and c, respectively
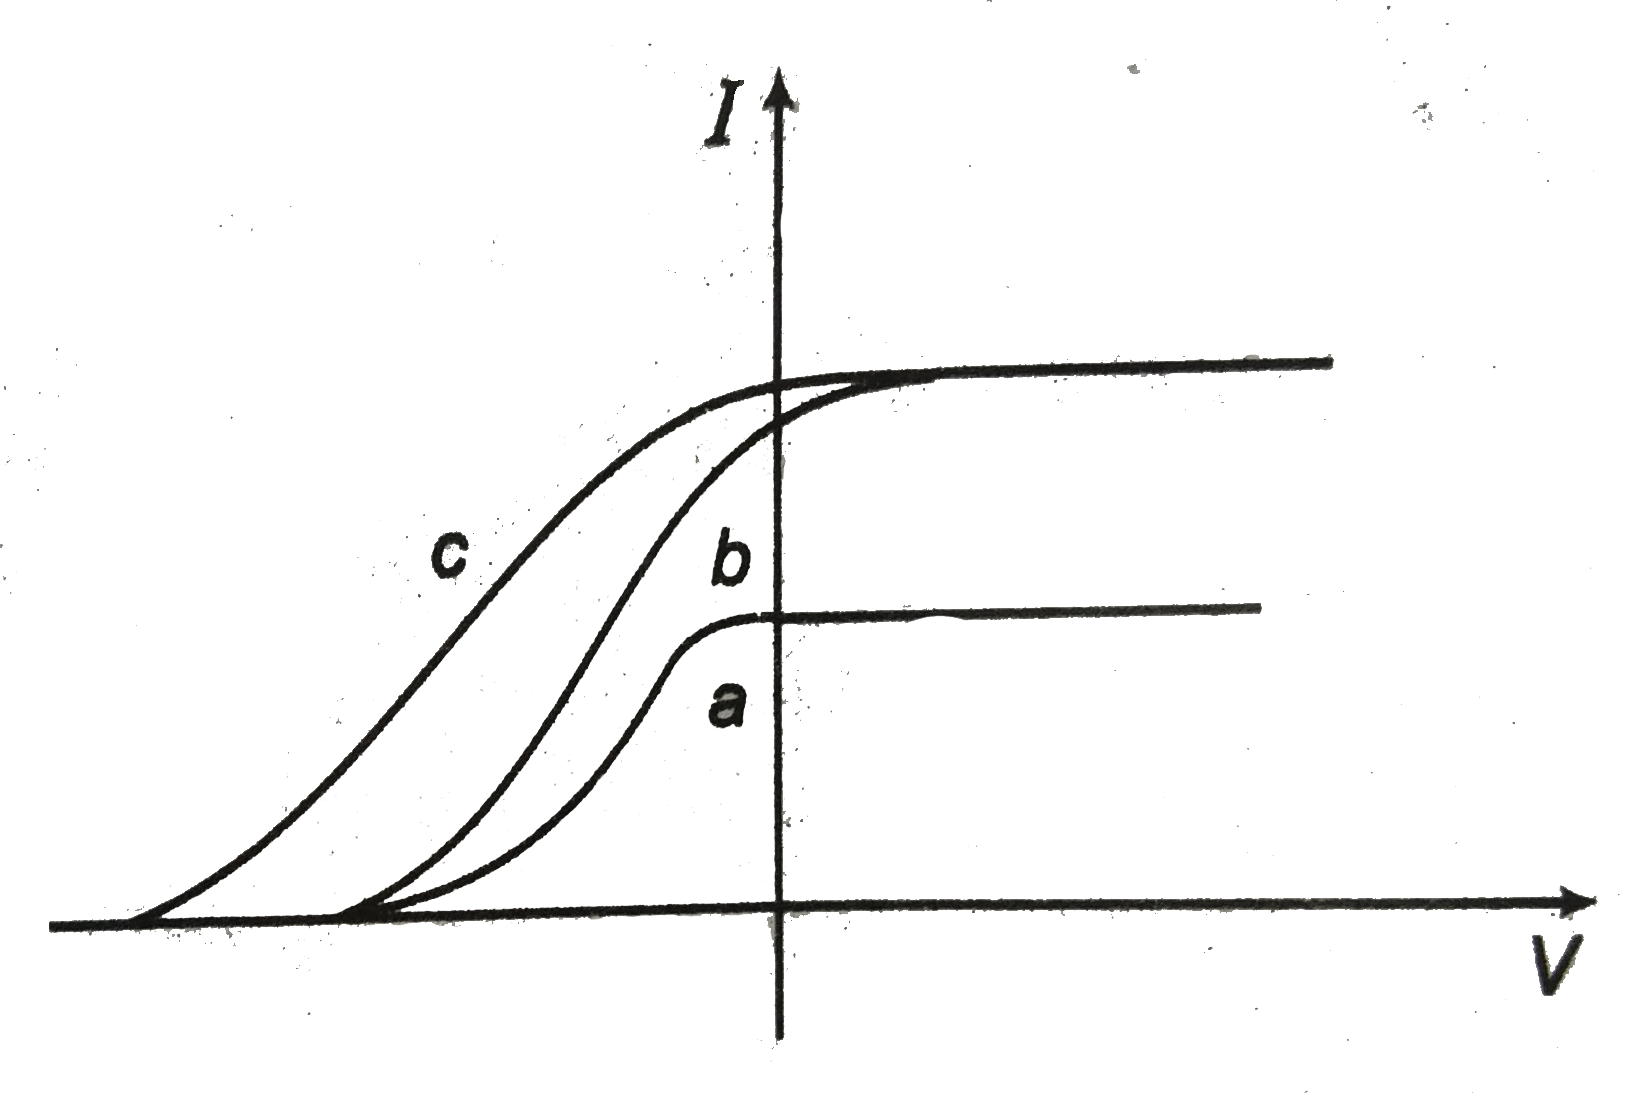
(a) fa=fbandla≠lb (b) fa=fcandla=lc
(c ) fa=fbandla=lb (d) fb=fcandlb=lc
View Solution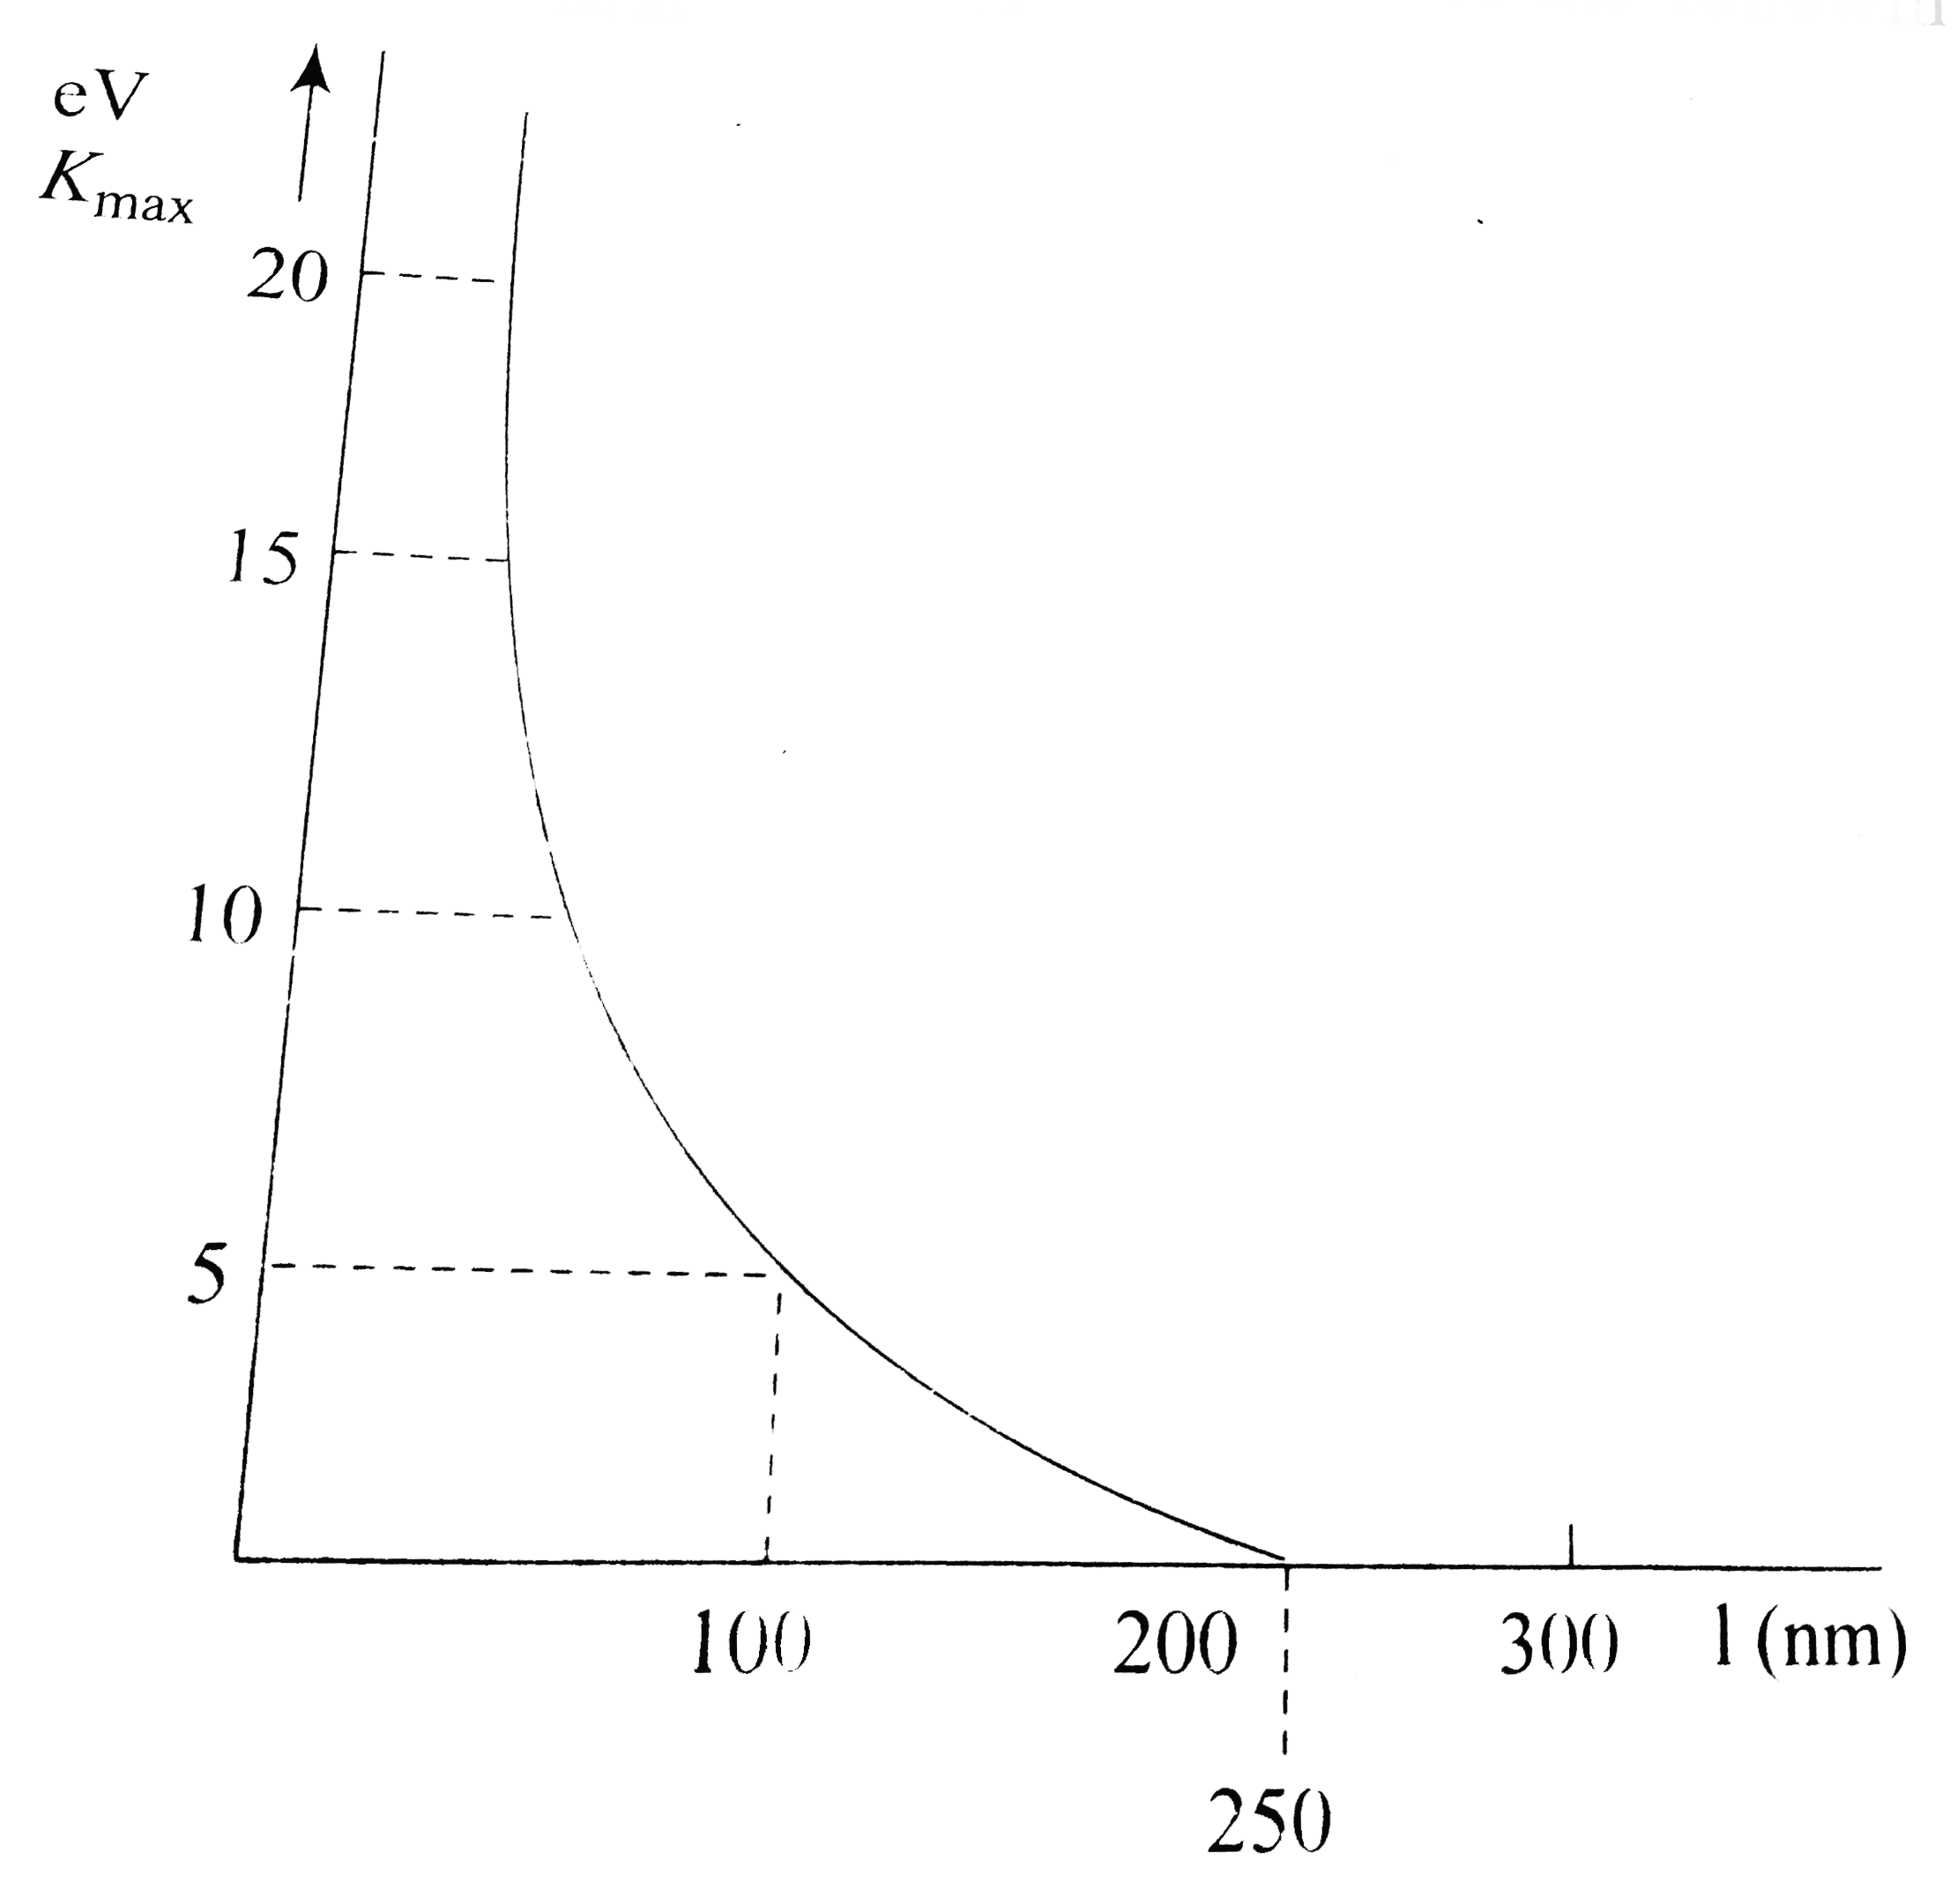
In a photoelectric effect experiment , the maximum kinetic energy of the ejected photoelectrons is measured for various wavelength of the incident light. Figure shows a graph of this maximum kinetic energy Kmax as a function of the wavelength λ of the light falling on the surface of the metal. Which of the following statement/i is/ are correct?
View SolutionDarw graphs showing variation of photoelctric current with applied voltage for two incident radiations of equal frequecny and different intensities. Mark the graph for the radiaiton of higher intensity.
View Solution
