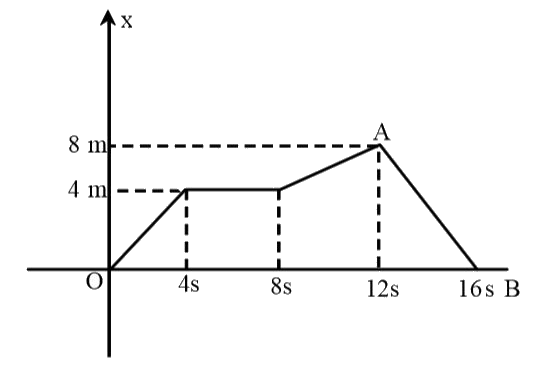
Figure shows the graph of the x-co-ordinate of a particle going along the x-axis as function of time. Find the instantaneous speed of particle at t = 12.5 s (in m/s)
2m/s
8m/s
4m/s
6m/s
The correct Answer is:A
Topper's Solved these Questions
- KINEMATICSBook:MOTIONChapter:KINEMATICSExercise:EXERCISE 2 OBJECTIVE PROBLEMS
Explore 75 Videos
- KINEMATICSBook:MOTIONChapter:KINEMATICSExercise:EXERCISE 2 OBJECTIVE PROBLEMS (Level-2)
Explore 26 Videos
- KINEMATICSBook:MOTIONChapter:KINEMATICSExercise:EXERCISE 4 PREVIOUS YEAR (LEVEL 2)
Explore 6 Videos
- HYDROSTATIC, FLUID MECHANICS & VISCOSITYBook:MOTIONChapter:HYDROSTATIC, FLUID MECHANICS & VISCOSITYExercise:EXERCISE -3 (SECTION-B) PREVIOUS YEAR PROBLEM
Explore 7 Videos
- KINETIC THEORY OF GASES Book:MOTIONChapter:KINETIC THEORY OF GASES Exercise:EXERCISE-3 SECTION-B
Explore 16 Videos
Similar Questions
Fig. shows the graph of the x-coordinate of a particle going along the x-axis as a function of time. Find (a) the average velocity during 0 to 10s, (b) instantaneous velocity at 2, 5, 8 and 12s.
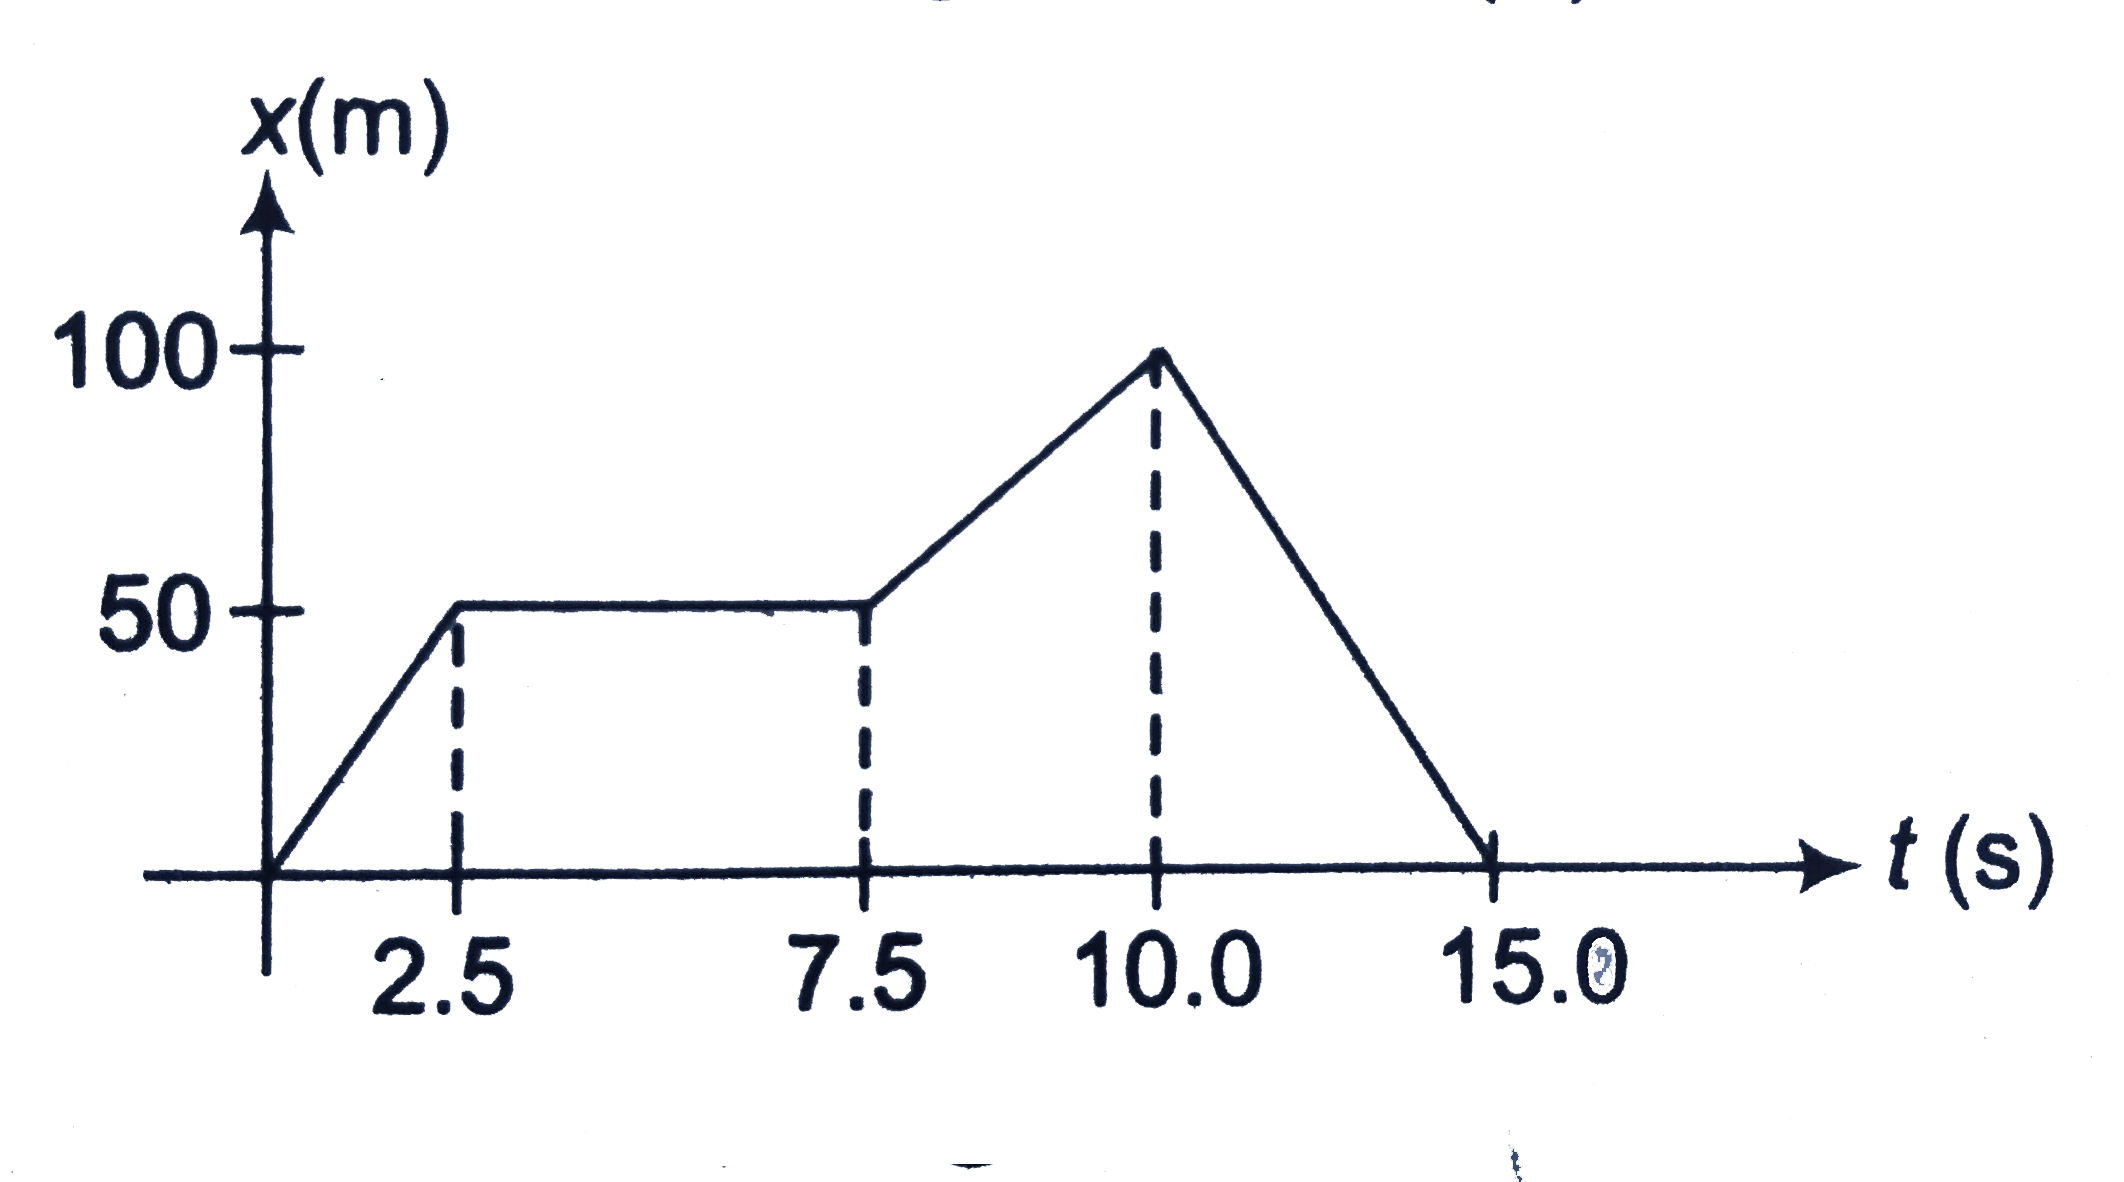
View SolutionFig. shows the graph of the x-coordinate of a particle going along the x-axis as a function of time. Find (a) the average velocity during 0 to 10s, (b) instantaneous velocity at 2, 5, 8 and 12s.

View Solution
Knowledge Check
Figure shows the graph of x - coordinate of a particle moving along x - axis as a function of time. Average velocity during t = 0 to 6 s and instantaneous velocity at t = 3 s respectively, will be
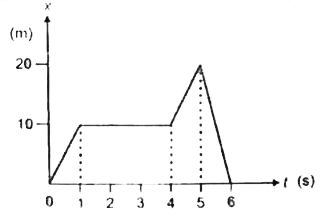 A10m/s,0B60m/s,0C0,0D0,10m/s
Figure show the displacement - time graph of a particle moving on the x-axis
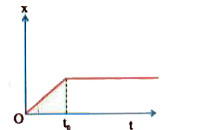 Athe particle is continuously going in positive X directionBthe particle is at restCthe velocity increases up to a time t0 and then becomes constant.Dthe particle moves at constant velocity up to a time t0 and then stops.
Figure shows the graph of the x-coordinaste of a particle going along the X-axis as a function of time.Find a. te average velocity during 0 to 10s, b. instantaneous velocity at 2,5,8 and 12s.
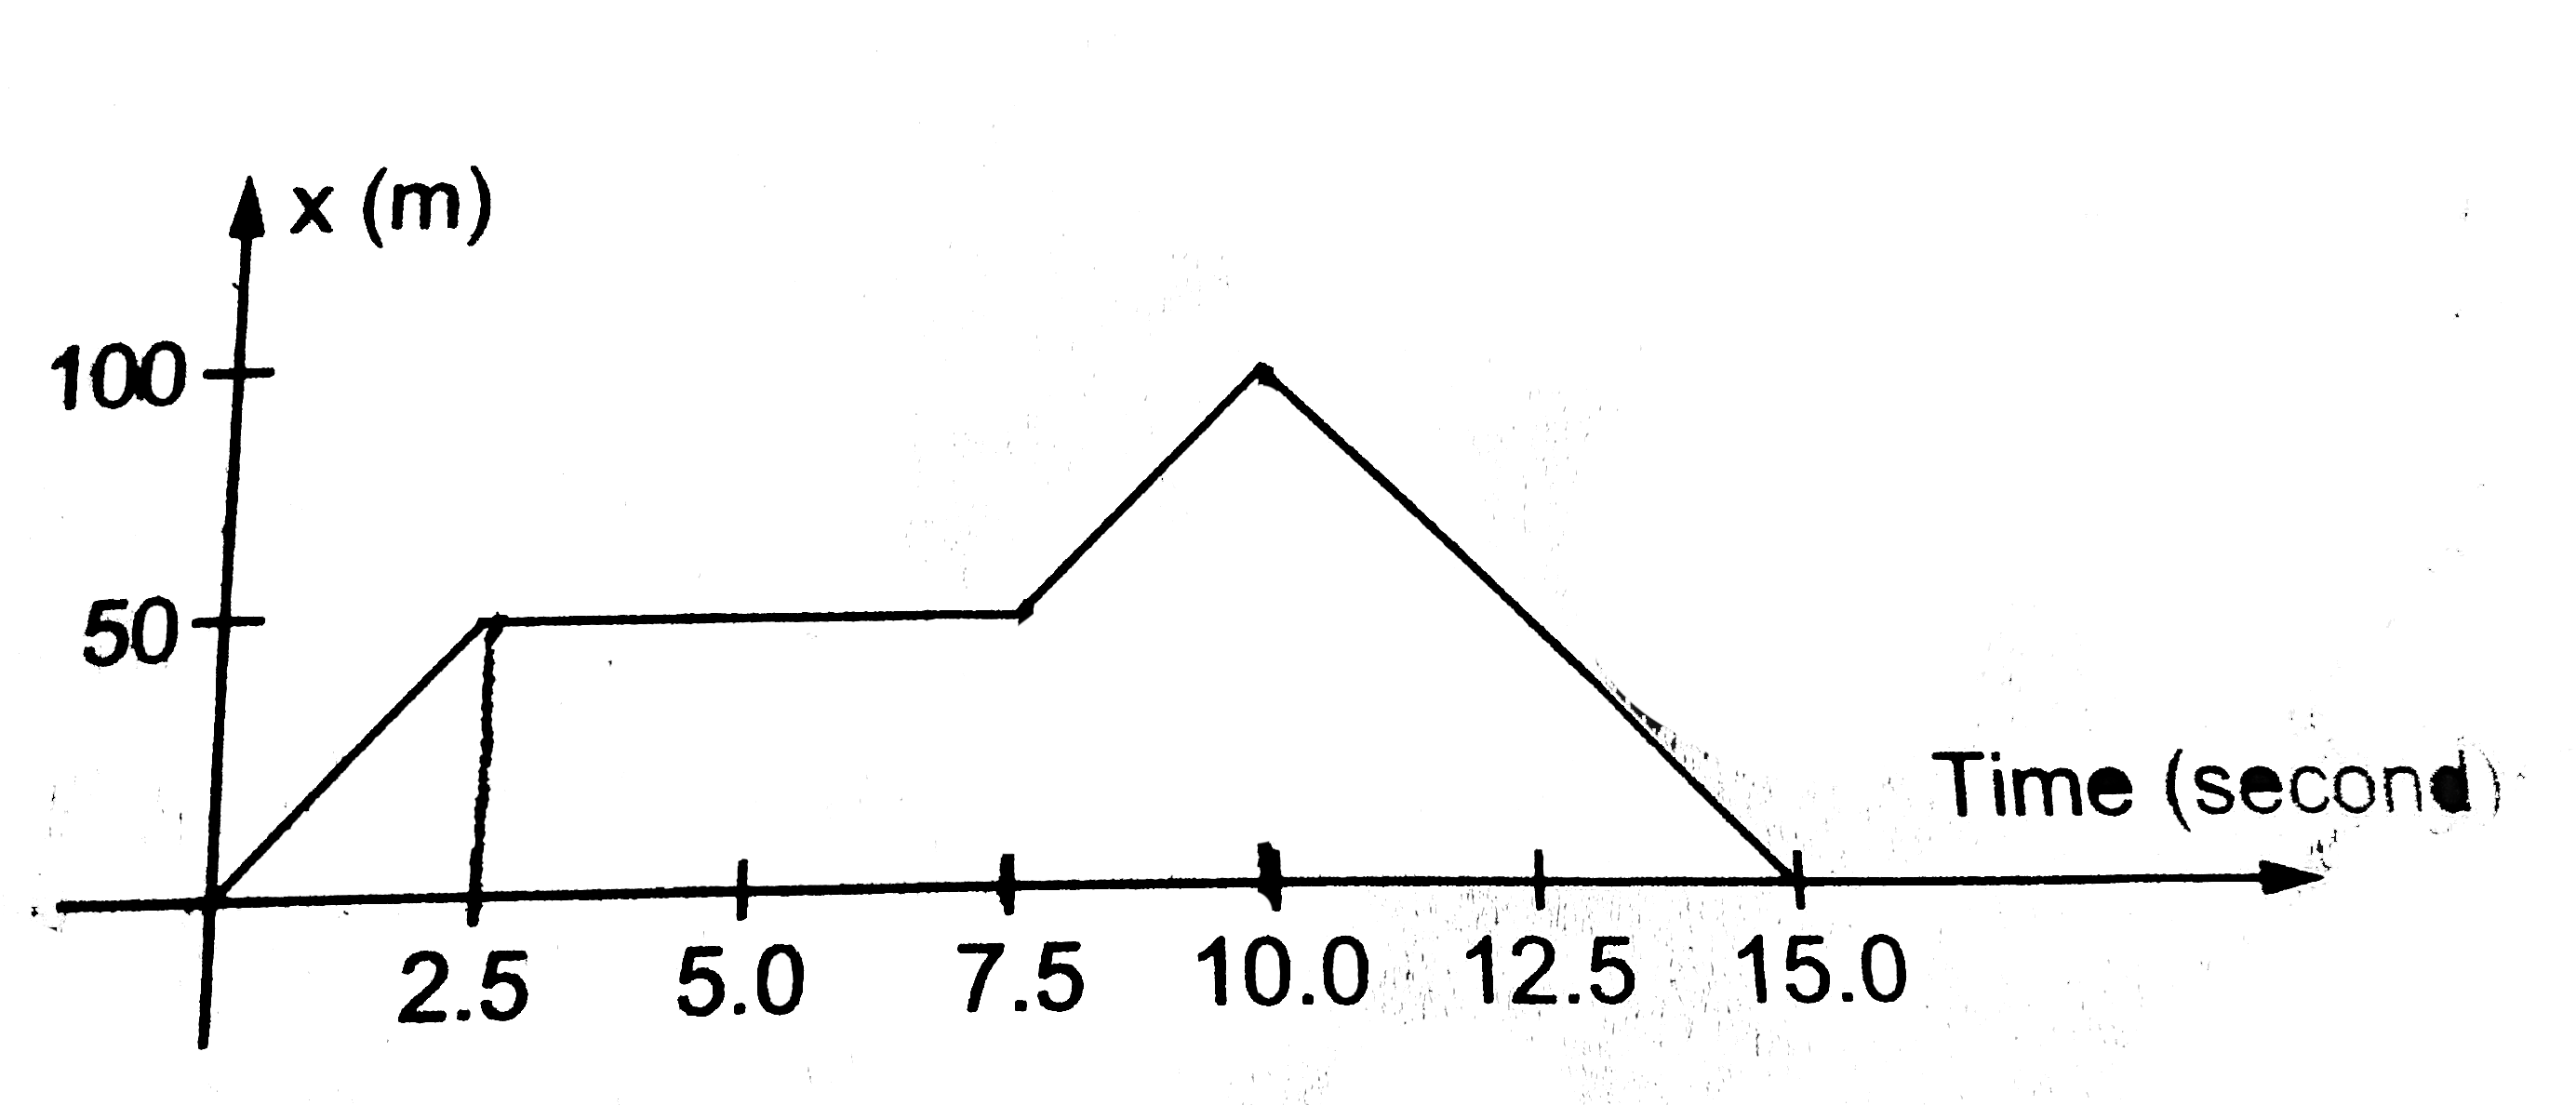
View SolutionFigure shows the graph of the x-coordinaste of a particle going along the X-axis as a function of time.Find a. te average velocity during 0 to 10s, b. instantaneous velocity at 2,5,8 and 12s.

View SolutionFigure shows the graph of x-coordinate of a particle moving along x-axis as a function of time. Average velocity during t = 0 to 4 s and instantaneous velocity at t = 4.113 s respectively will be
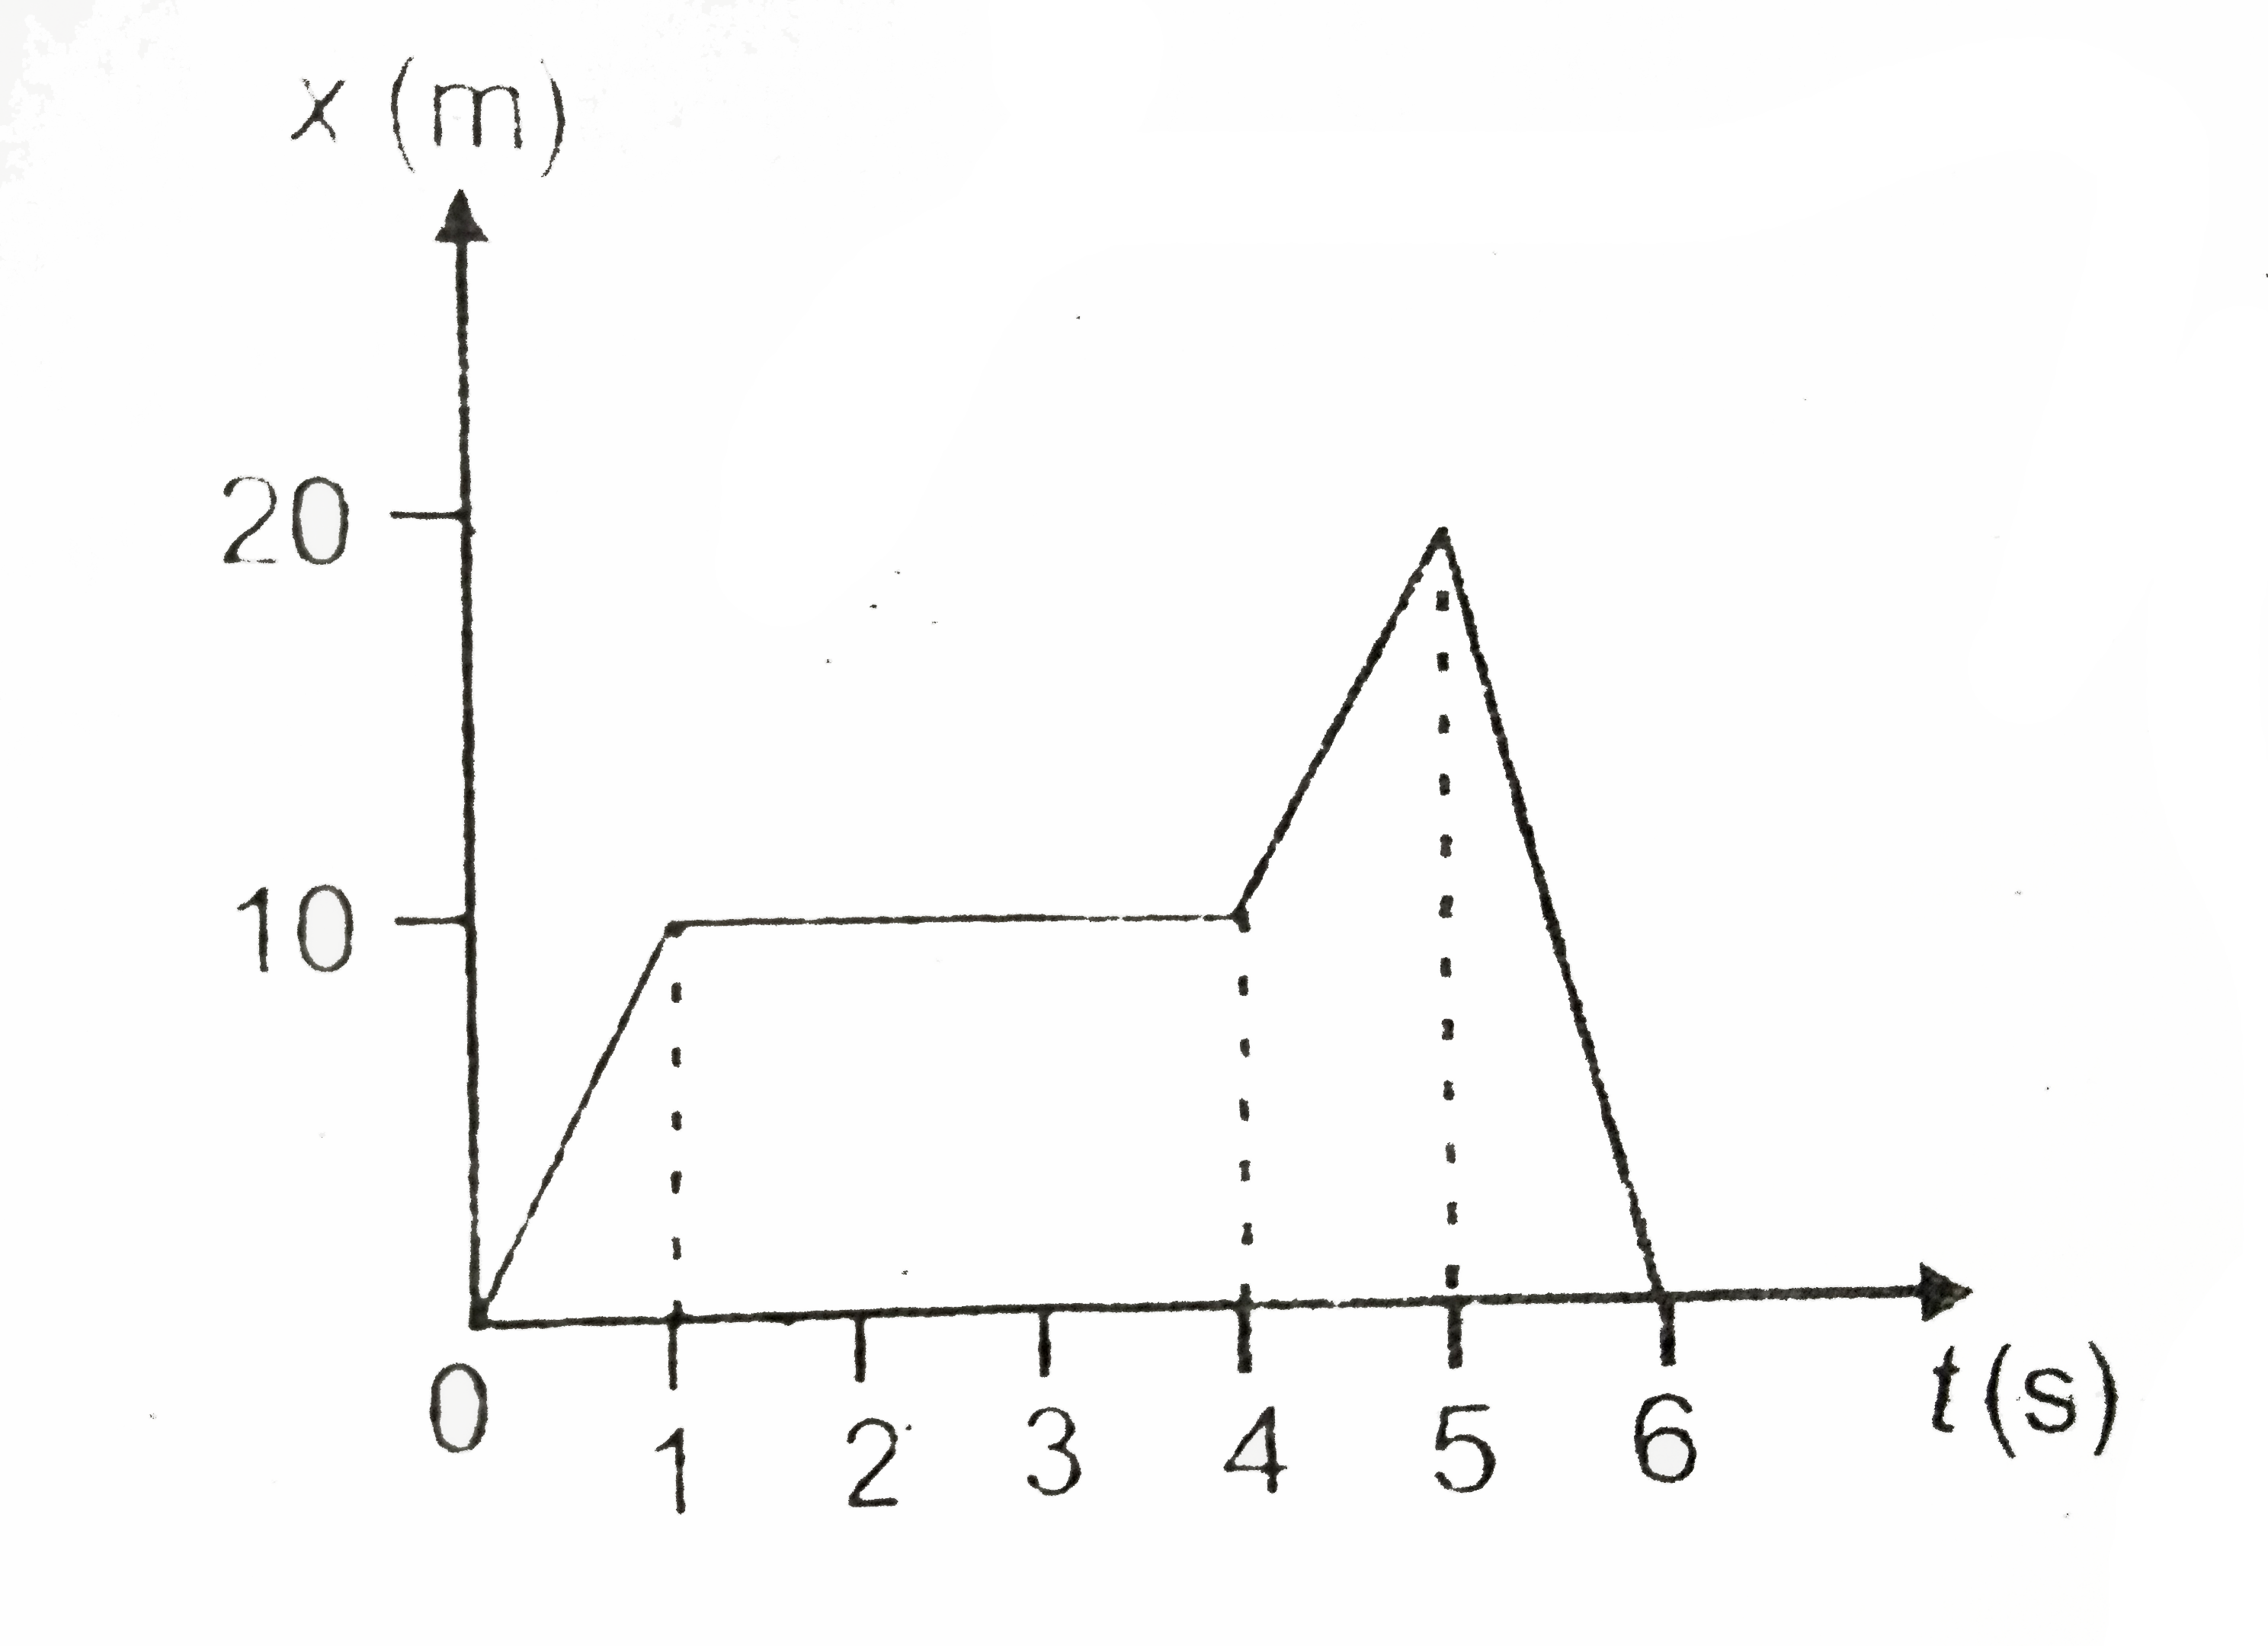
View SolutionFigure shows the graph of x-coordinate of a particle moving along x-axis as a function of time. Average velocity during t = 0 to 4 s and instantaneous velocity at t = 4.113 s respectively will be

View SolutionFigure shows the graph of x - coordinate of a particle moving along x - axis as a function of time. Average velocity during t = 0 to 6 s and instantaneous velocity at t = 3 s respectively, will be

View SolutionFigure shows the displacement time graph of a particle moving on the X-axis

View Solution
