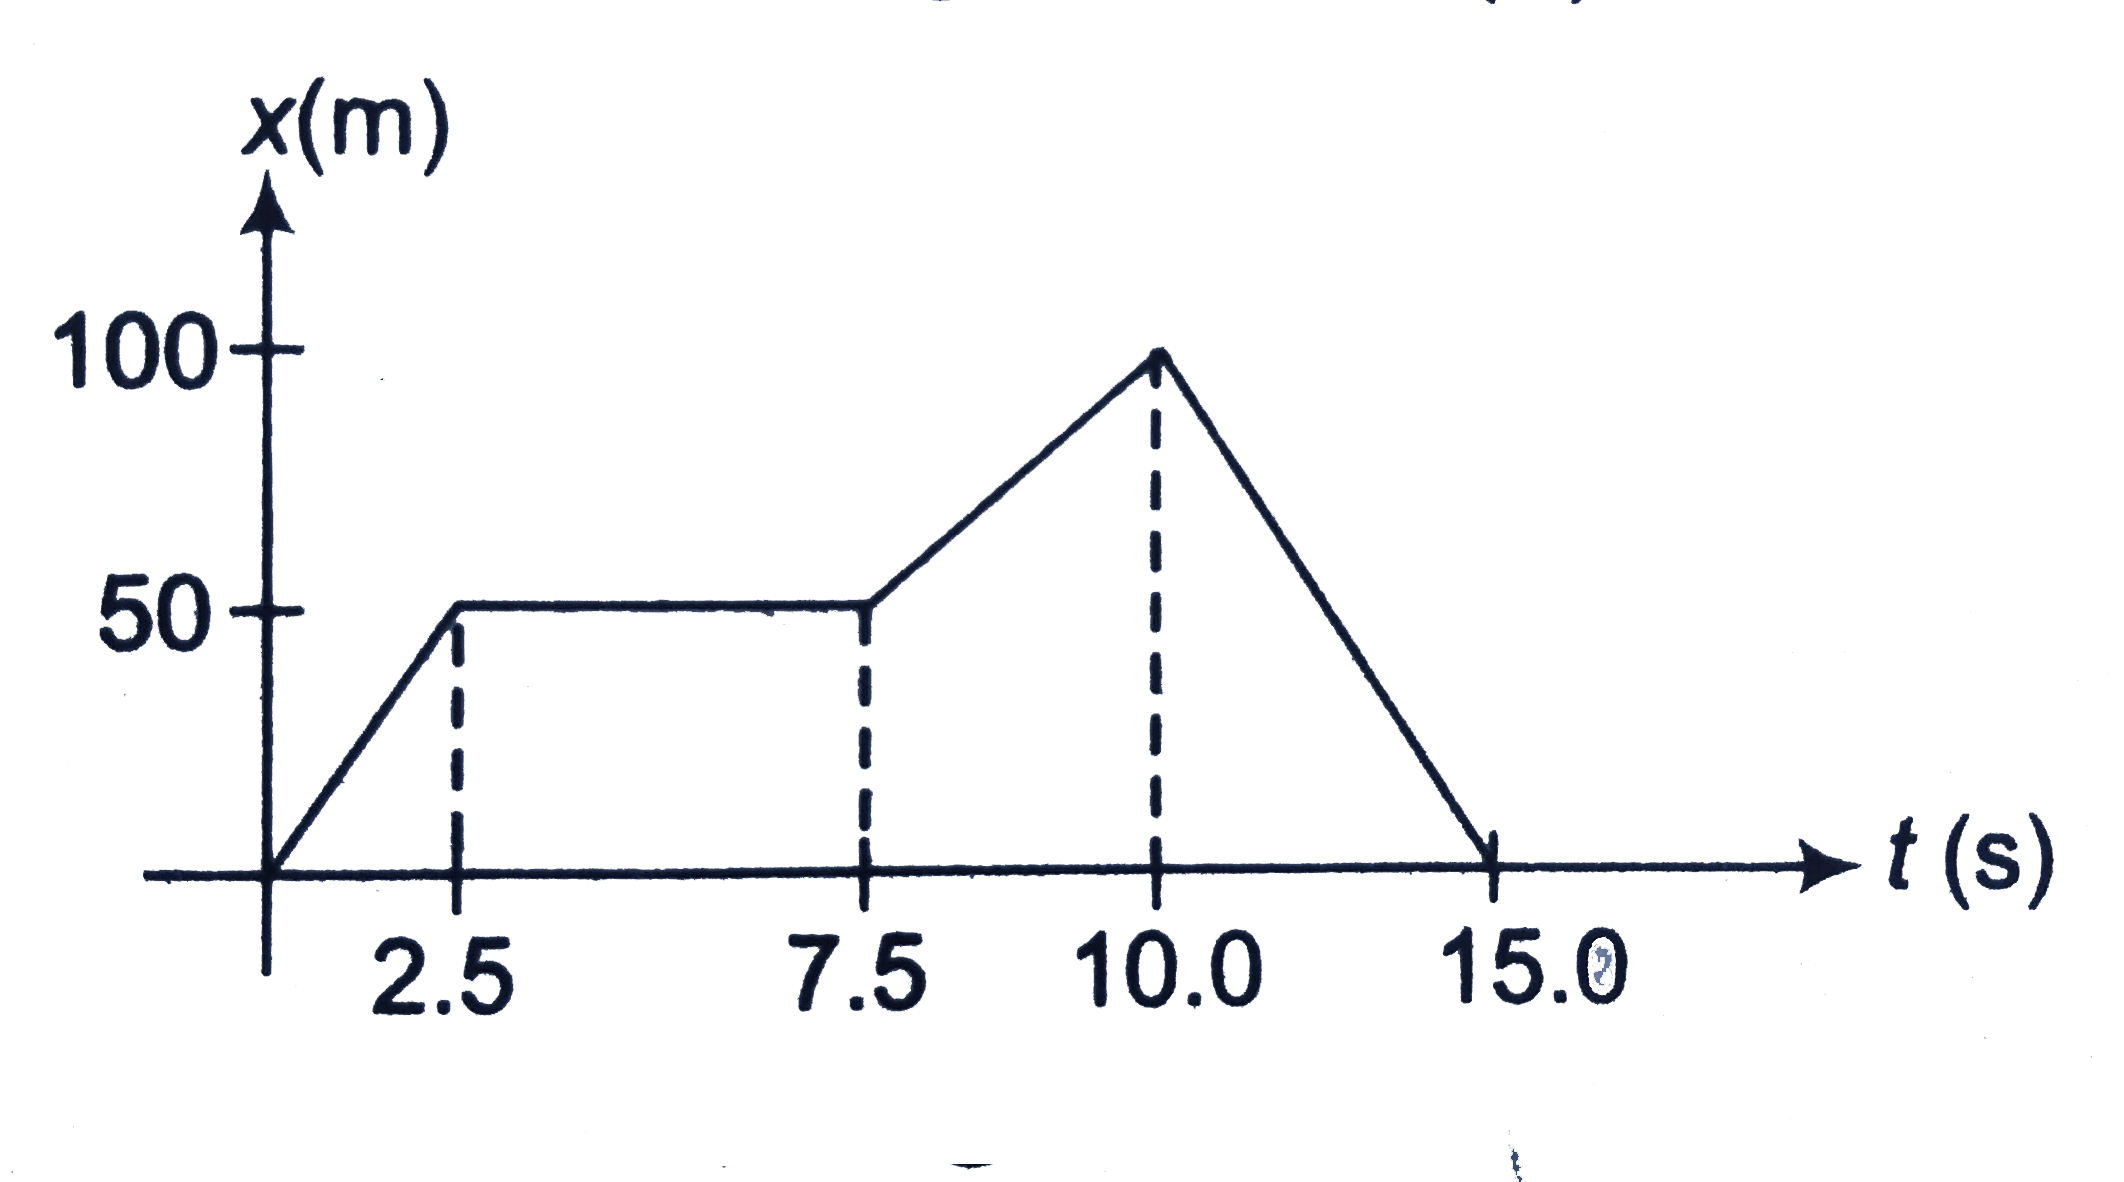
Fig. shows the graph of the x-coordinate of a particle going along the x-axis as a function of time. Find (a) the average velocity during 0 to 10s, (b) instantaneous velocity at 2, 5, 8 and 12s.
The correct Answer is:A, B
(a) Average velocity=st=xf−xit
=x10sec−x0sec10=10010=10m/s
(b) Instantaneous velocity =Slope of x-t graph
Topper's Solved these Questions
- KINEMATICSBOOK - DC PANDEY ENGLISHCHAPTER - KINEMATICSEXERCISE - Exercise 6.9
6 Videos
- KINEMATICSBOOK - DC PANDEY ENGLISHCHAPTER - KINEMATICSEXERCISE - Assertion And Reason
12 Videos
- KINEMATICSBOOK - DC PANDEY ENGLISHCHAPTER - KINEMATICSEXERCISE - Exercise 6.7
3 Videos
- GRAVITATIONBOOK - DC PANDEY ENGLISHCHAPTER - GRAVITATIONEXERCISE - (C) Chapter Exercises
45 Videos
- KINEMATICS 1BOOK - DC PANDEY ENGLISHCHAPTER - KINEMATICS 1EXERCISE - INTEGER_TYPE
15 Videos
Similar Questions
Figure shows the graph of the x-coordinaste of a particle going along the X-axis as a function of time.Find a. te average velocity during 0 to 10s, b. instantaneous velocity at 2,5,8 and 12s.
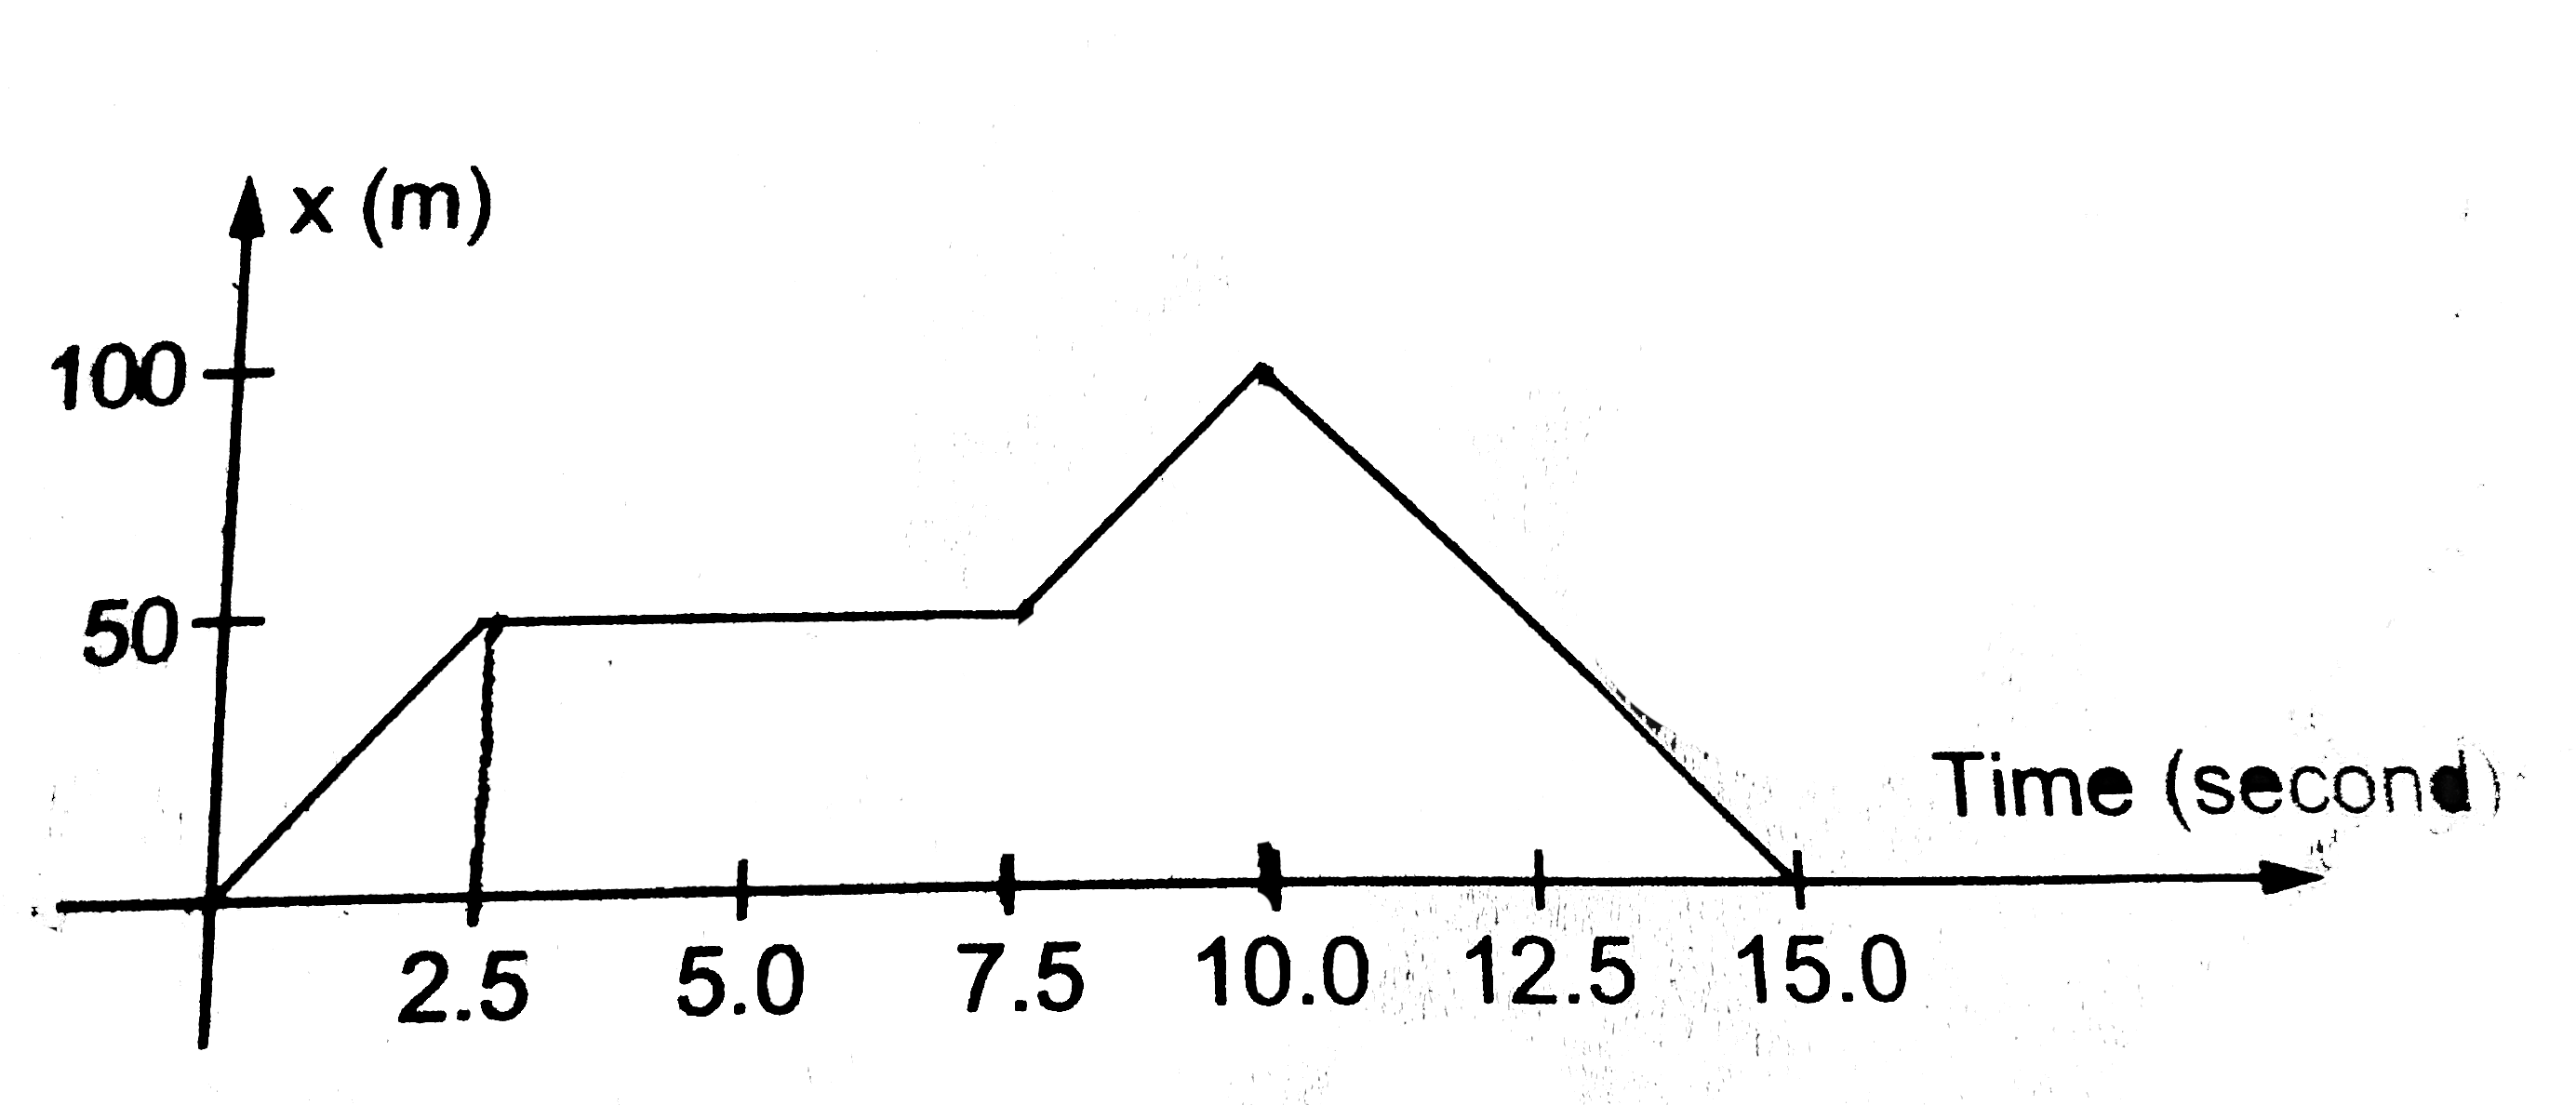
View SolutionFigure shows the graph of x-coordinate of a particle moving along x-axis as a function of time. Average velocity during t = 0 to 4 s and instantaneous velocity at t = 4.113 s respectively will be
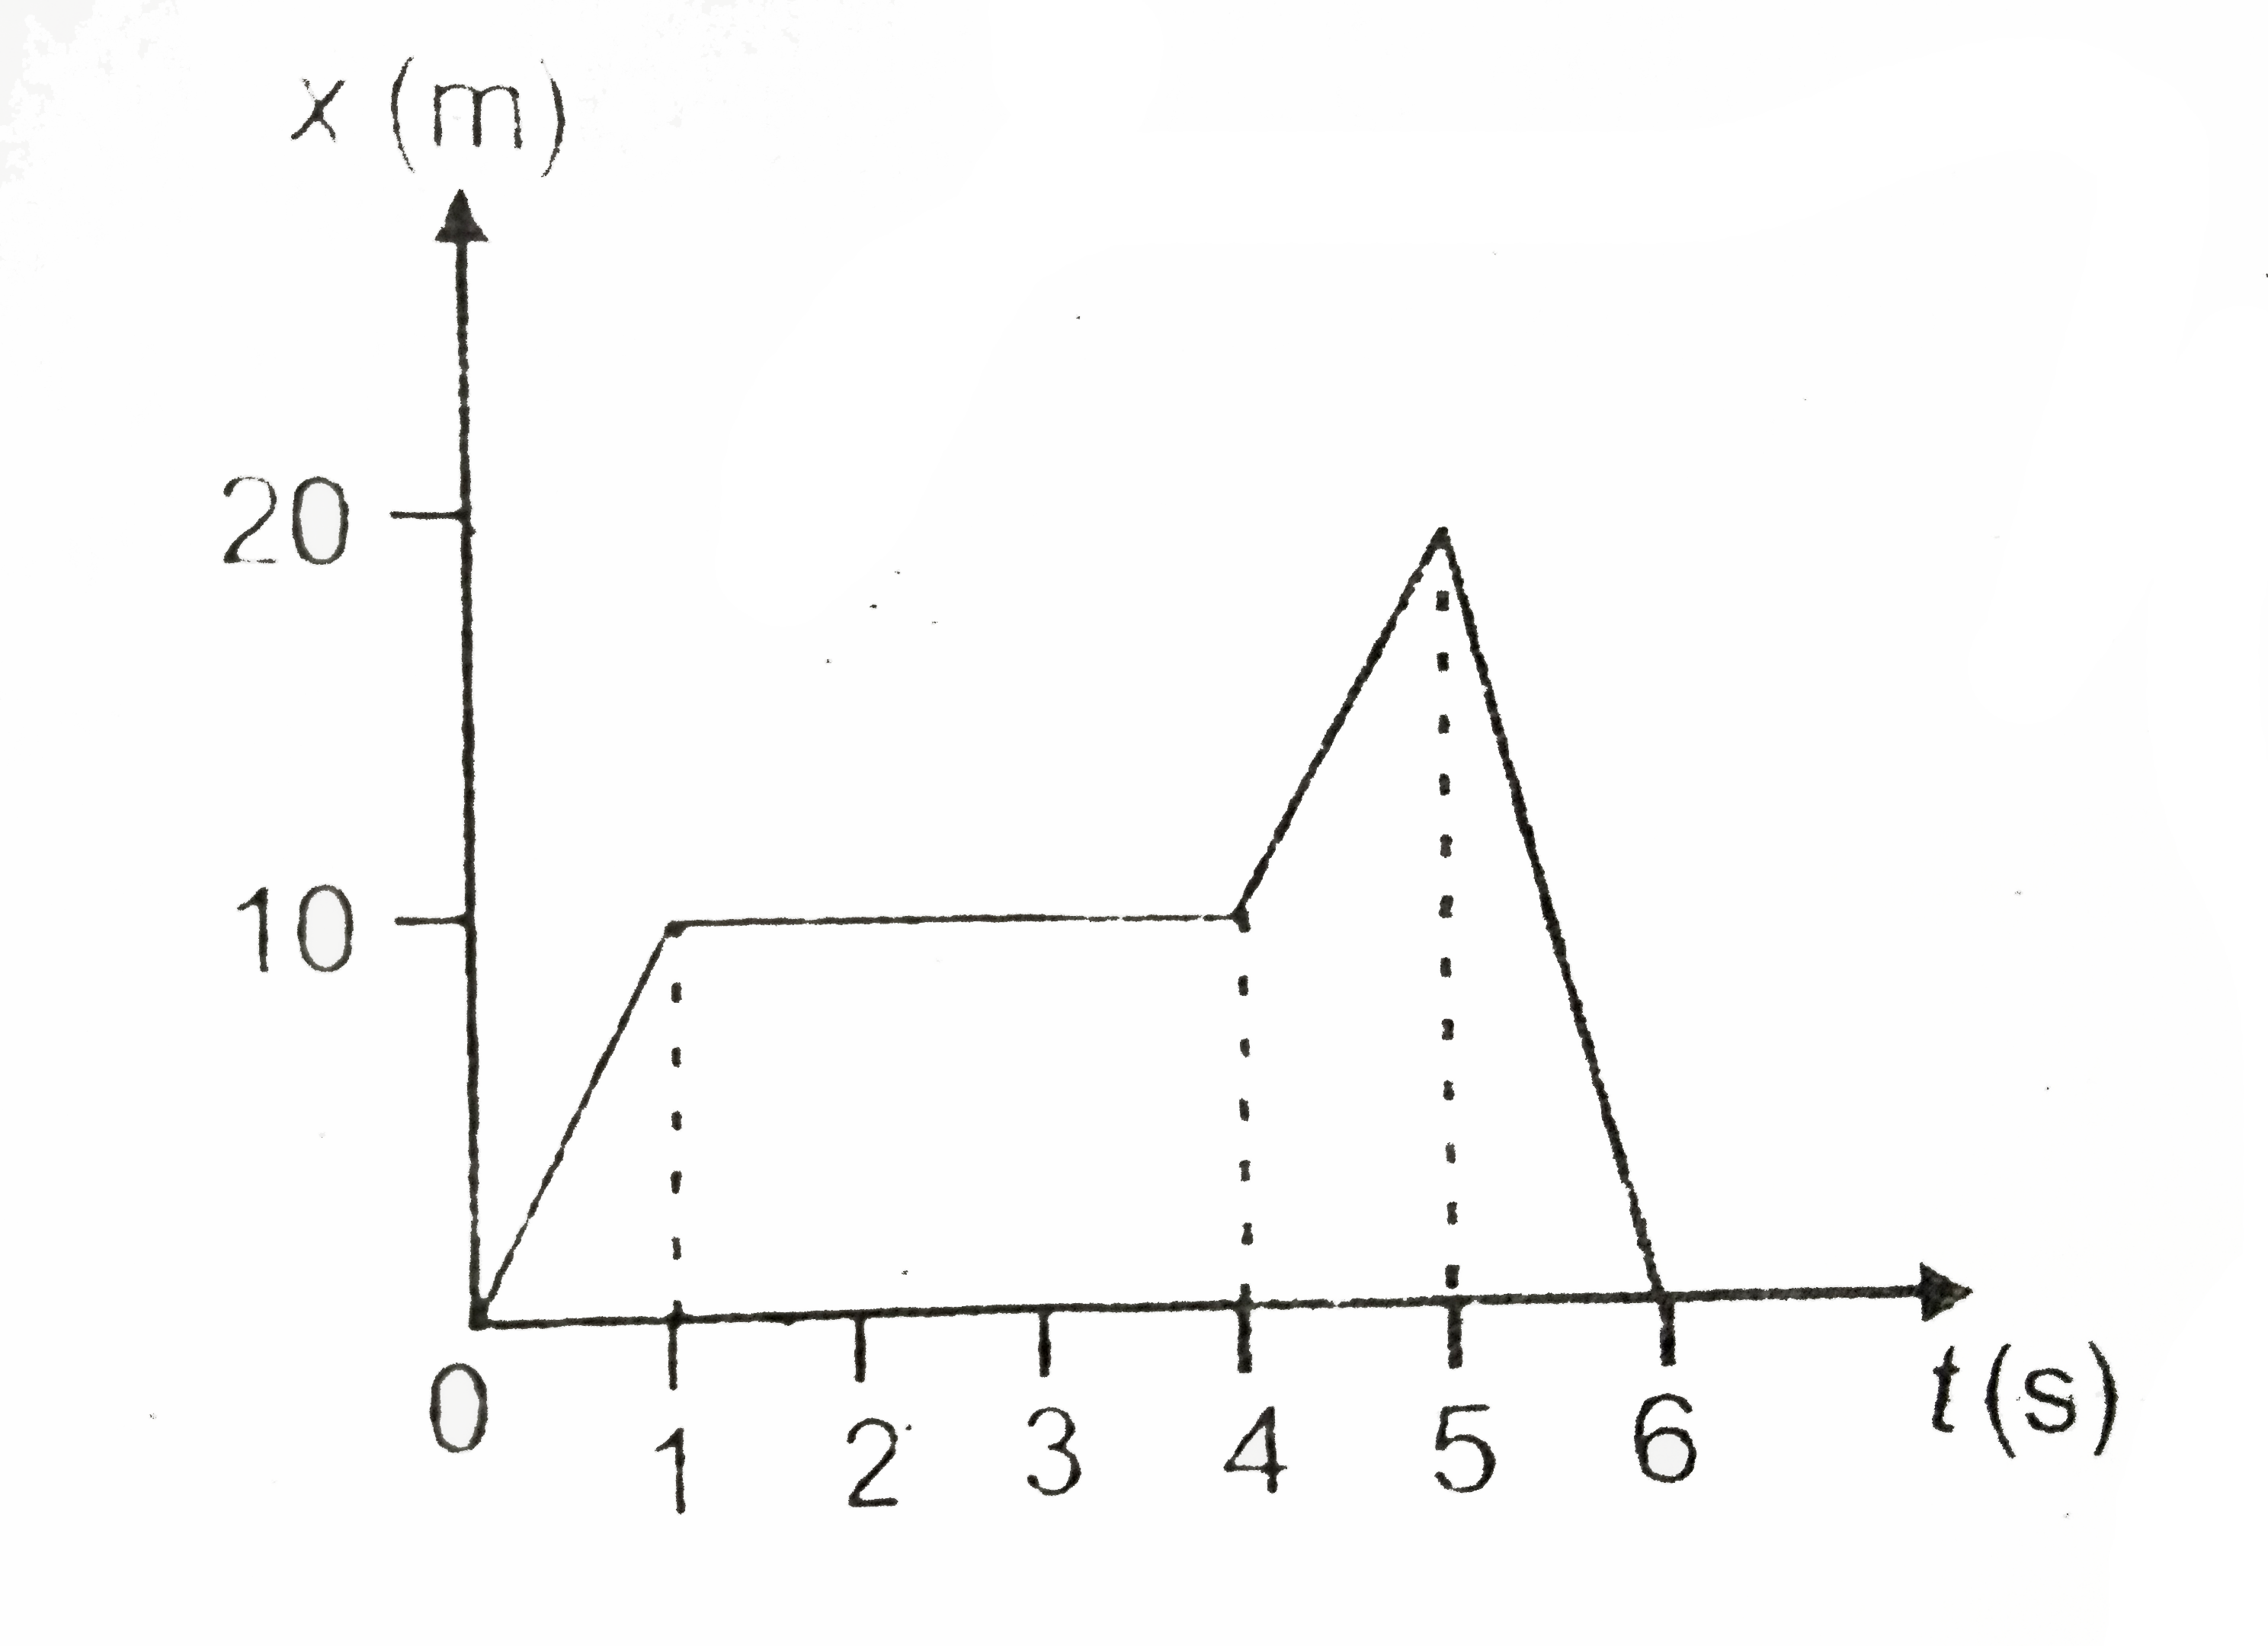
View SolutionFigure shows the graph of x - coordinate of a particle moving along x - axis as a function of time. Average velocity during t = 0 to 6 s and instantaneous velocity at t = 3 s respectively, will be
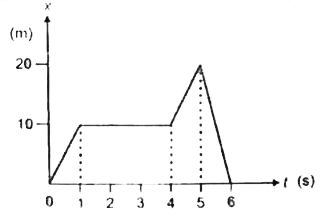
View SolutionFigure shows the displacement of a particle going along the X-axis as a function of time. The force acting on the particle is zero in the region

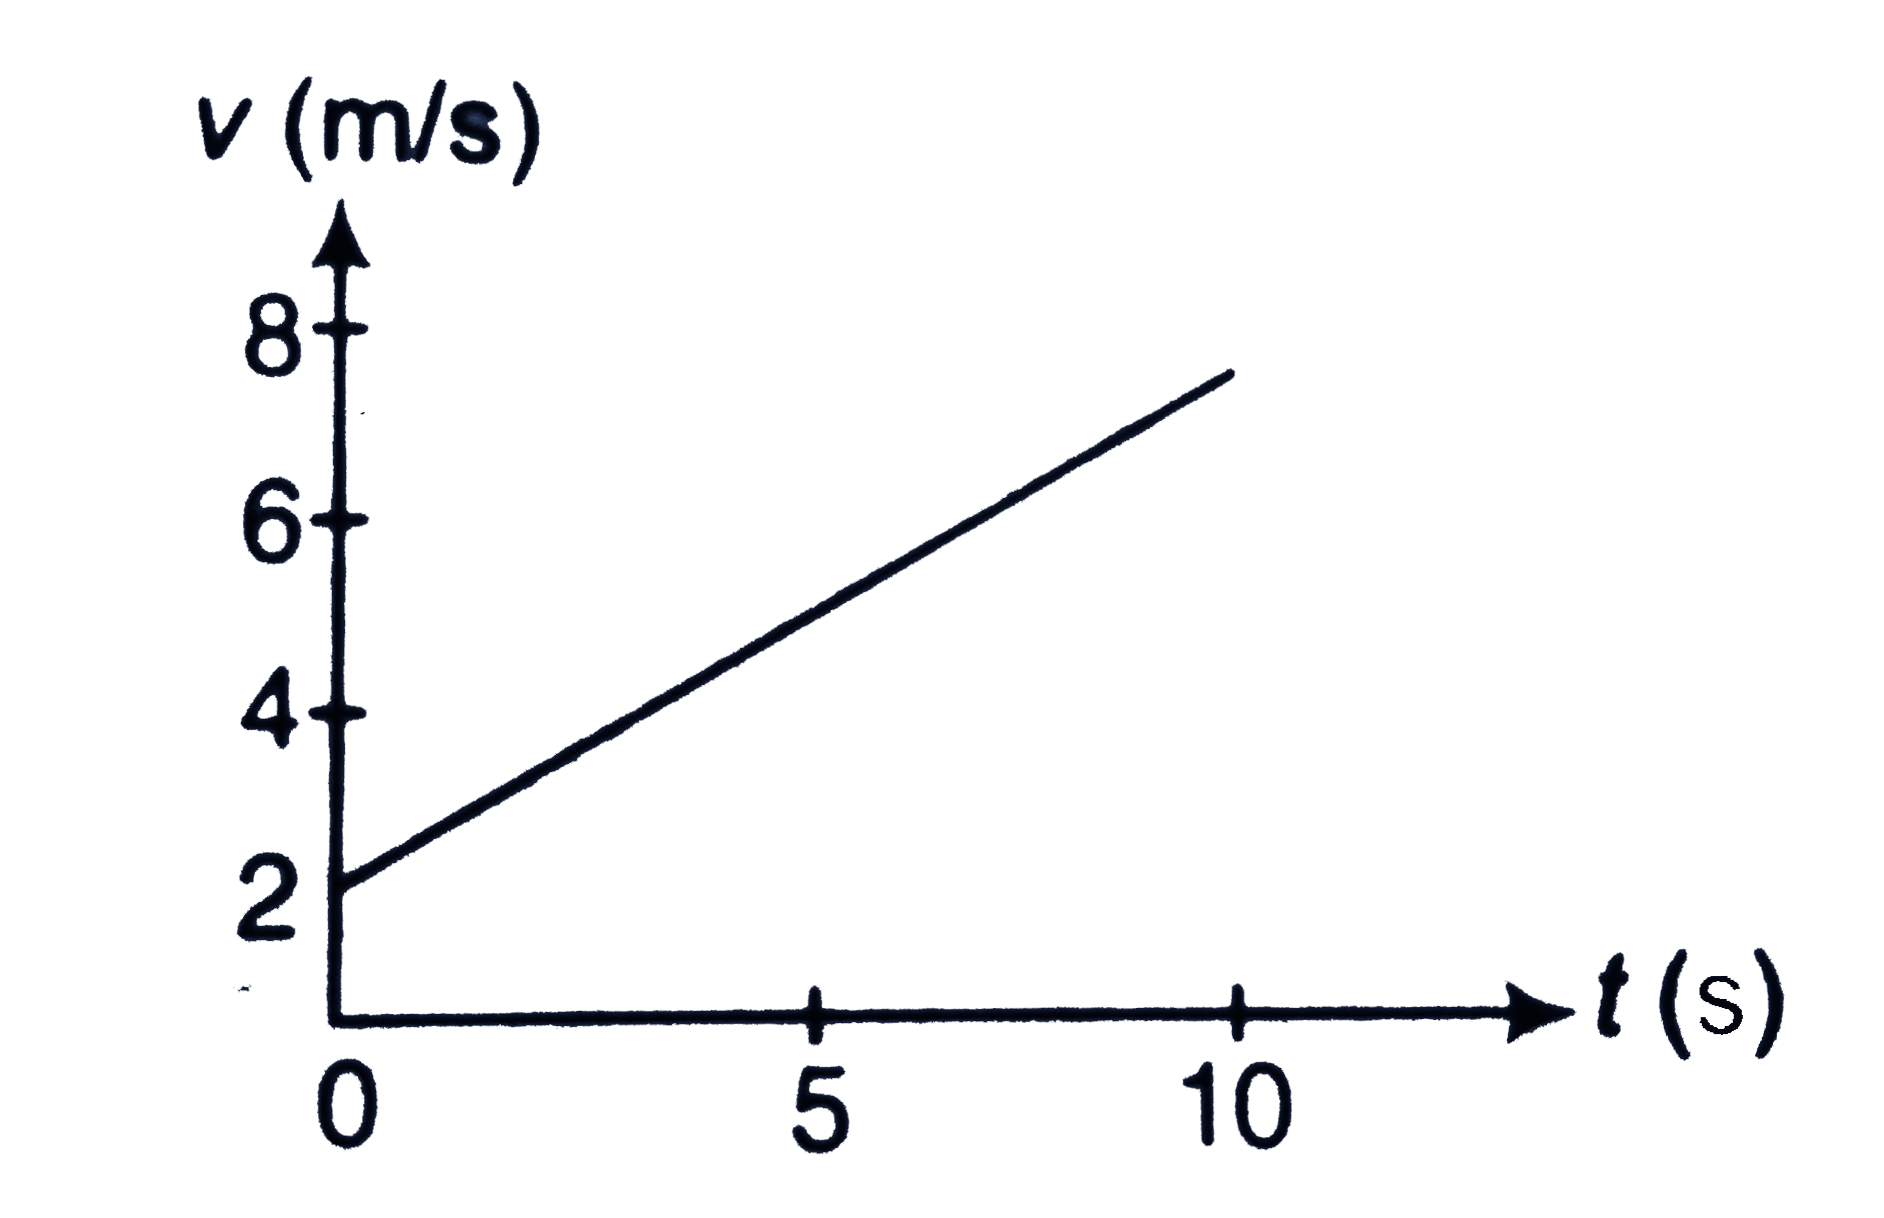
View SolutionFig. shows the graph of velocity versus time for a particle going along the x-axis. Find (a) acceleration, (b) the distance traveled in 0→10s and (c) the displacement in 0 to 10s.
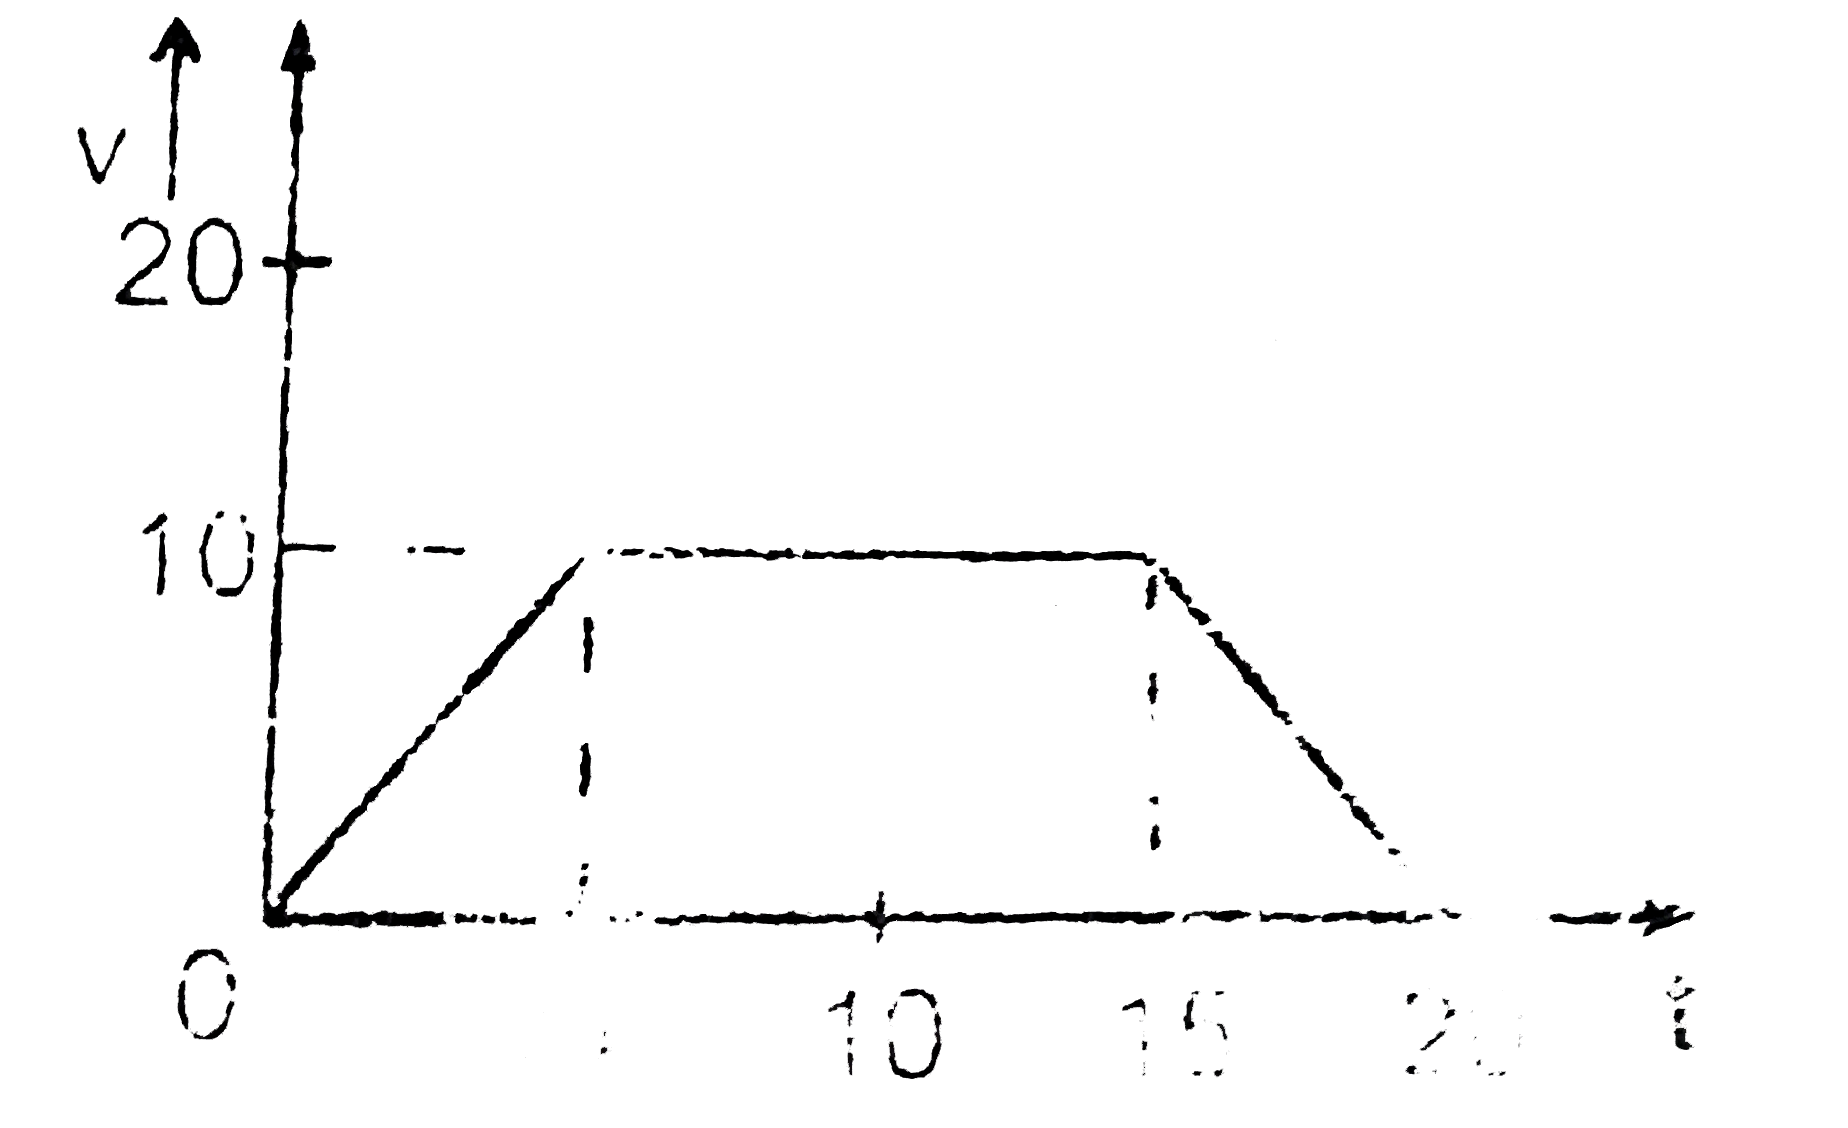
View SolutionFigure shows the velocity time graph of a particle moving along straight line (v is m/s and t is in second). It average velocity in 20 seconds will be:
 .
.
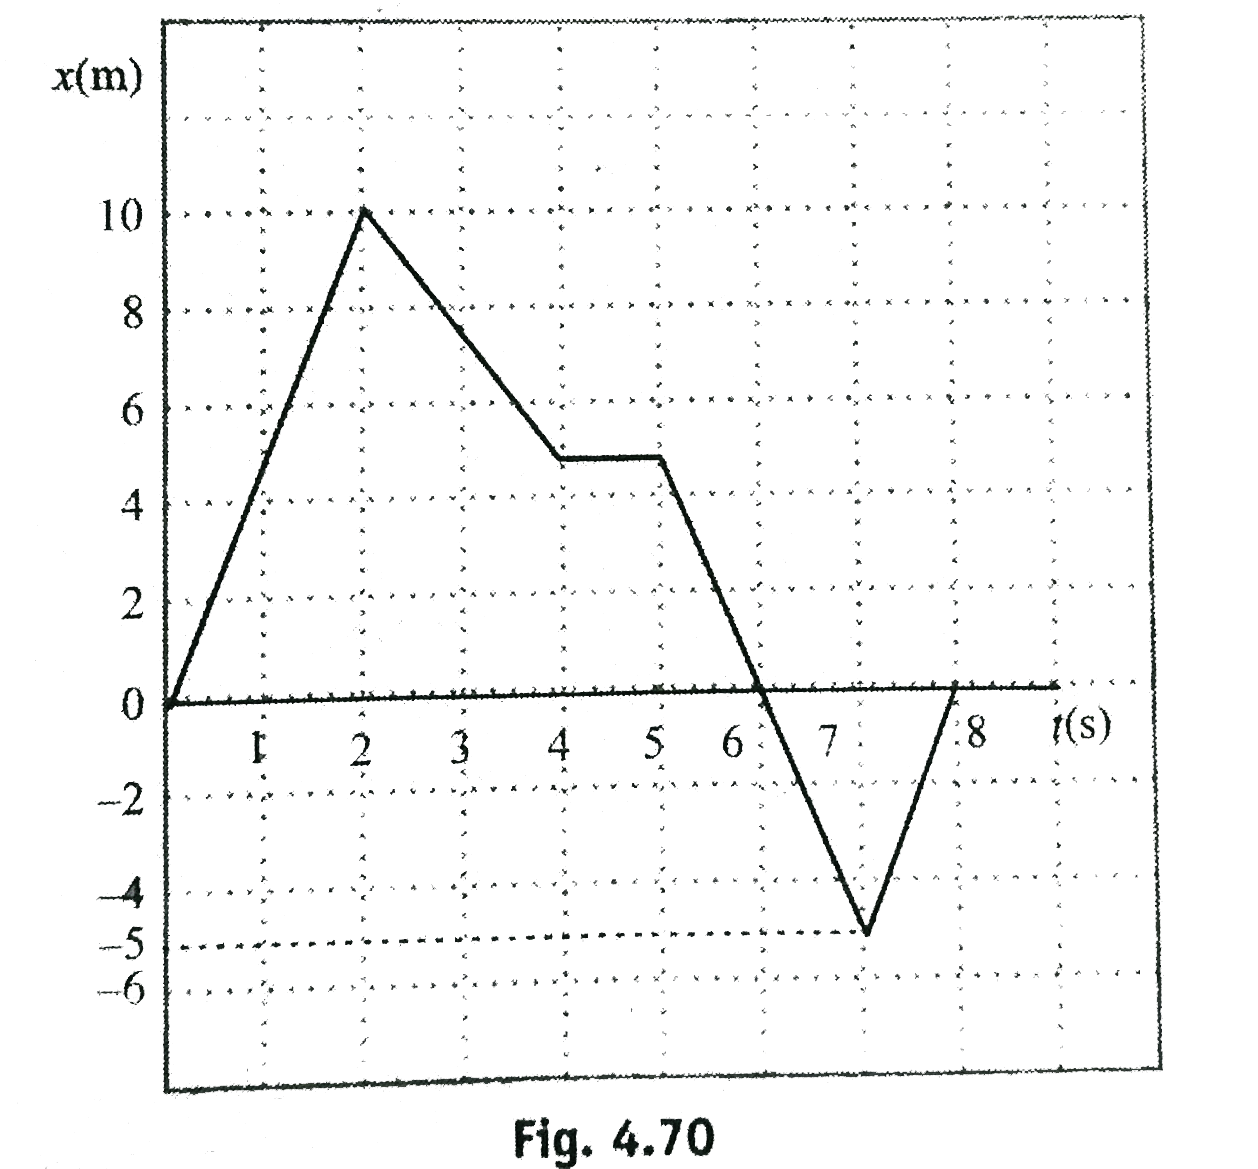
View SolutionThe position verus time graph time graph for a certain particle moving along the x-axis is shown in . Find the average velocity in the time intervals (a) 0 to 2s, (b) 2s to 4s, and (c) 4,s to 7s,
 .
.
View Solutionfigure
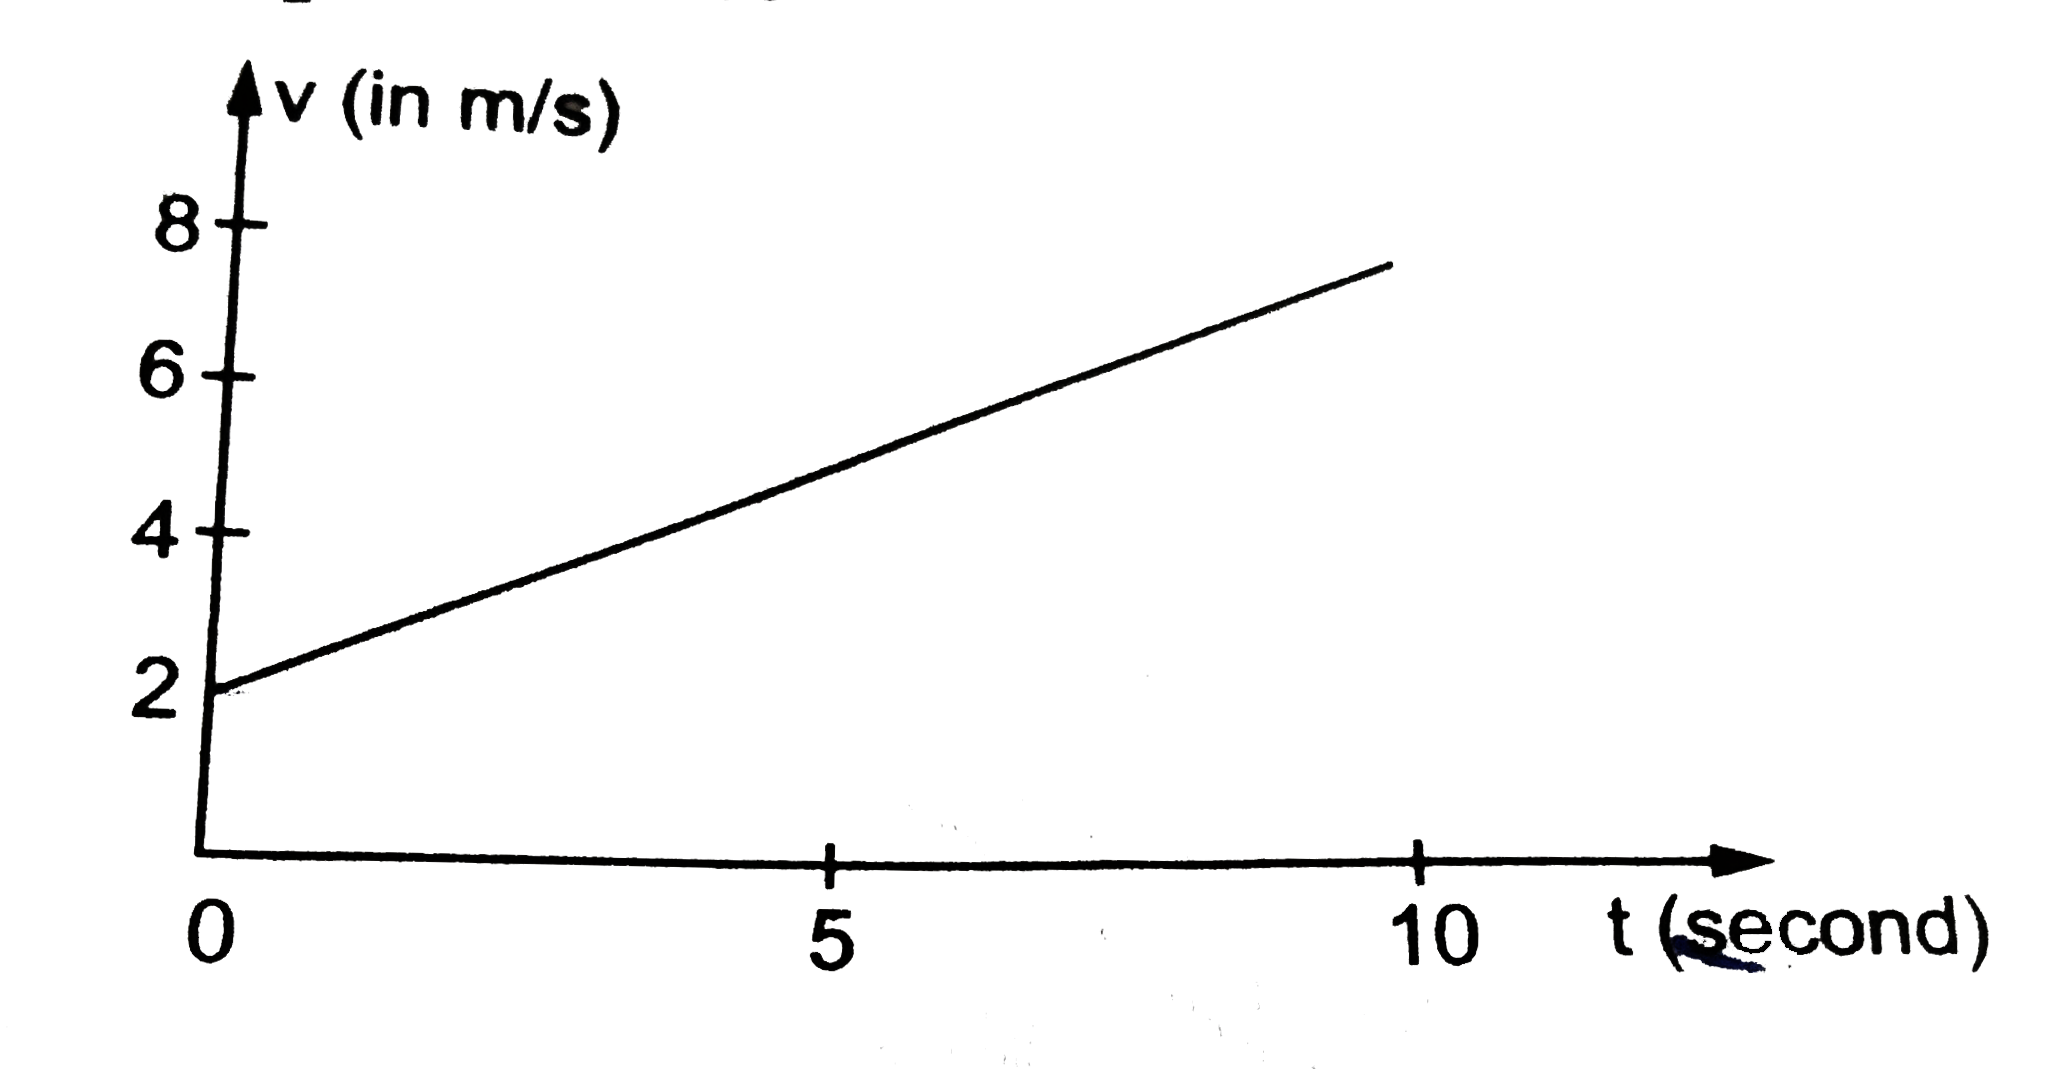 shows the graph of velocity versus tie for a particle going along the X-axis. Find a. the acceleration, b. The distance travelled in 0 to 10 s and c. the displacement in 0 to 10 s.
View SolutionFigure is a graph of the coordinate of a spider crawling along the x-axis. (a) Fraph tis velocity and acceleration as functionsof time. (b) In a motion diagram, show the position, velocity, and acceleration of the spider at the five times: t=2.5s, t=10 s, t=20 s, t=30 s,
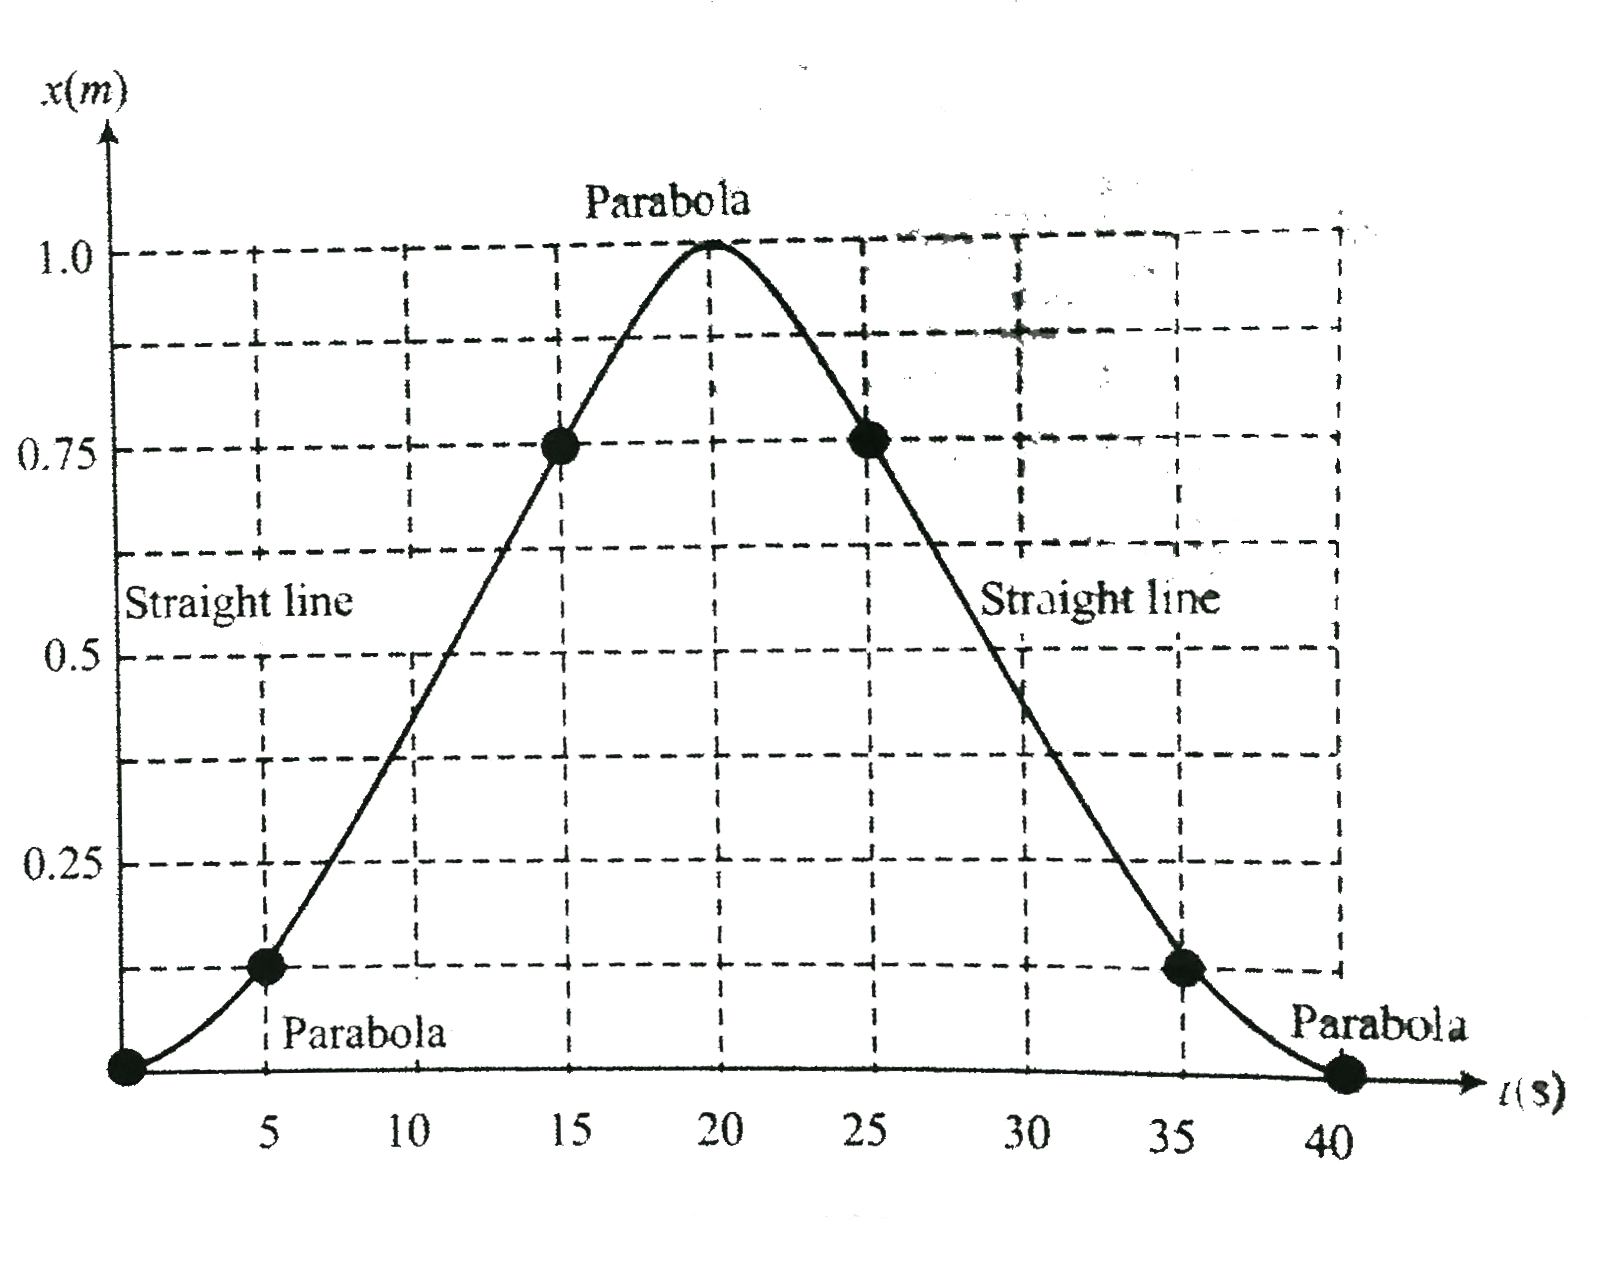 .
.
View SolutionThe displacement of a particle along the x-axis is given by x=3+8t+7t2. Obtain its velocity and acceleration at t=2s.
View Solution