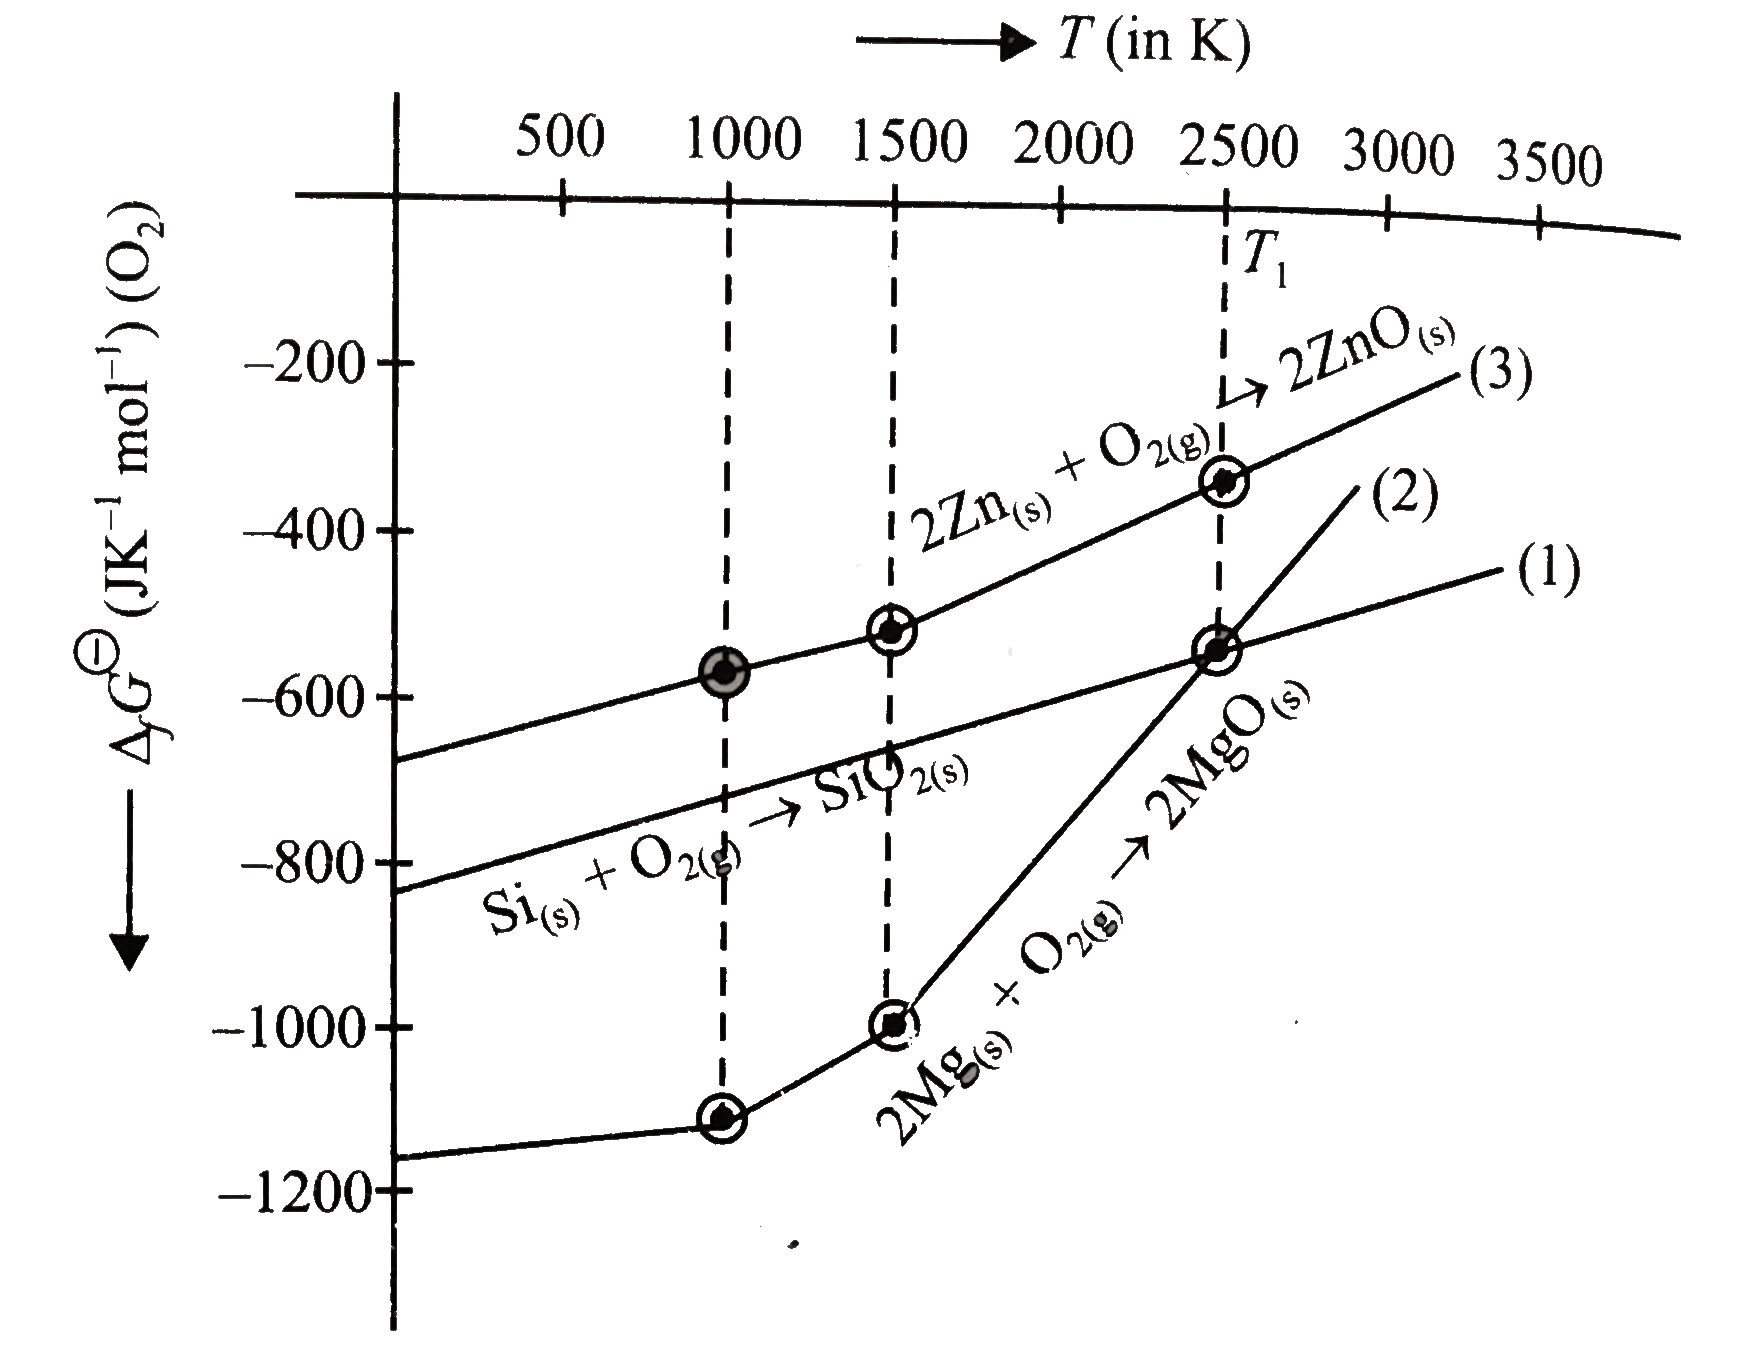
Which of the following plot gives Ellingham diagram ?
A
B
C
D
Text Solution
The correct Answer is:B
|
Topper's Solved these Questions
- MATALLURGYBOOK - SURA PUBLICATIONCHAPTER - MATALLURGYEXERCISE - Answer the following Questions
24 Videos
- MATALLURGYBOOK - SURA PUBLICATIONCHAPTER - MATALLURGYEXERCISE - Evaluate Yourself
4 Videos
- IONIC EQUILIBRIUMBOOK - SURA PUBLICATIONCHAPTER - IONIC EQUILIBRIUMEXERCISE - EXERCISE (LOGN ANSWER)
1 Videos
- MODEL QUESTION PAPER -1 BOOK - SURA PUBLICATIONCHAPTER - MODEL QUESTION PAPER -1 EXERCISE - PART - IV
10 Videos
Similar Questions
Knowledge Check
Which of the following statement is incorrect regarding Ellingham diagram?
AIt represents ΔG with temperatureBIt can be used for oxides, sulphides and chloride oresCIt helps in predicting the feasibility of thermal reduction of an oreDA metal will reduce the oxide of other metals which lie below it in Ellingham diagram
What is Ellingham diagram?
View SolutionWhat is Ellingham diagram?
View SolutionInterpret the following Ellingham diagram.
 .
.
View SolutionInterpret 2 points from the following Ellingham diagram.
 .
.
View SolutionWhich of the following is incorrect about Ellingham diagram?
View SolutionApplications Of Ellingham Diagram
View SolutionWhich of the following statement is incorrect regarding Ellingham diagram?
View Solution
