The following graphs represent velocity - time graph. Identify what kind of motion a paraticle undergoes in each graph.

(a) (i) It represents the uniform acceleration. Body starts from nest and move with constant velocity
(ii) Greater is the slope graph, greater will be the acceleration.
(b) Body moving with uniform velocity. Zero slope indicates zero acceleration.
(c) Straight line graph does not pass the origin. After some time it moves with a uniform acceleration. [acceleration is constant but greater than first graph]
(d) Greater changes in velocity are taking place in equal intervals of time. It represents an increasing acceleration i.e. acceleration is variable.
Topper's Solved these Questions
- KINEMATICSBOOK - SURA PUBLICATIONCHAPTER - KINEMATICSEXERCISE - ADDITIONAL QUESTIONS (MULTIPLE CHOICE QUESTIONS)
26 Videos
- KINEMATICSBOOK - SURA PUBLICATIONCHAPTER - KINEMATICSEXERCISE - ADDITIONAL QUESTIONS (FILL IN THE BLANKS):
10 Videos
- KINEMATICSBOOK - SURA PUBLICATIONCHAPTER - KINEMATICSEXERCISE - EXERCISE QUESTIONS (LONG ANSWER QUESTIONS)
11 Videos
- HEAT AND THERMODYNAMICSBOOK - SURA PUBLICATIONCHAPTER - HEAT AND THERMODYNAMICSEXERCISE - Value Based Question
1 Videos
- KINETIC THEORY OF GASES BOOK - SURA PUBLICATIONCHAPTER - KINETIC THEORY OF GASES EXERCISE - VALUE BASED QUESTIONS
4 Videos
Similar Questions
The following figure represents the velocity-time graph of a moving car on a road:
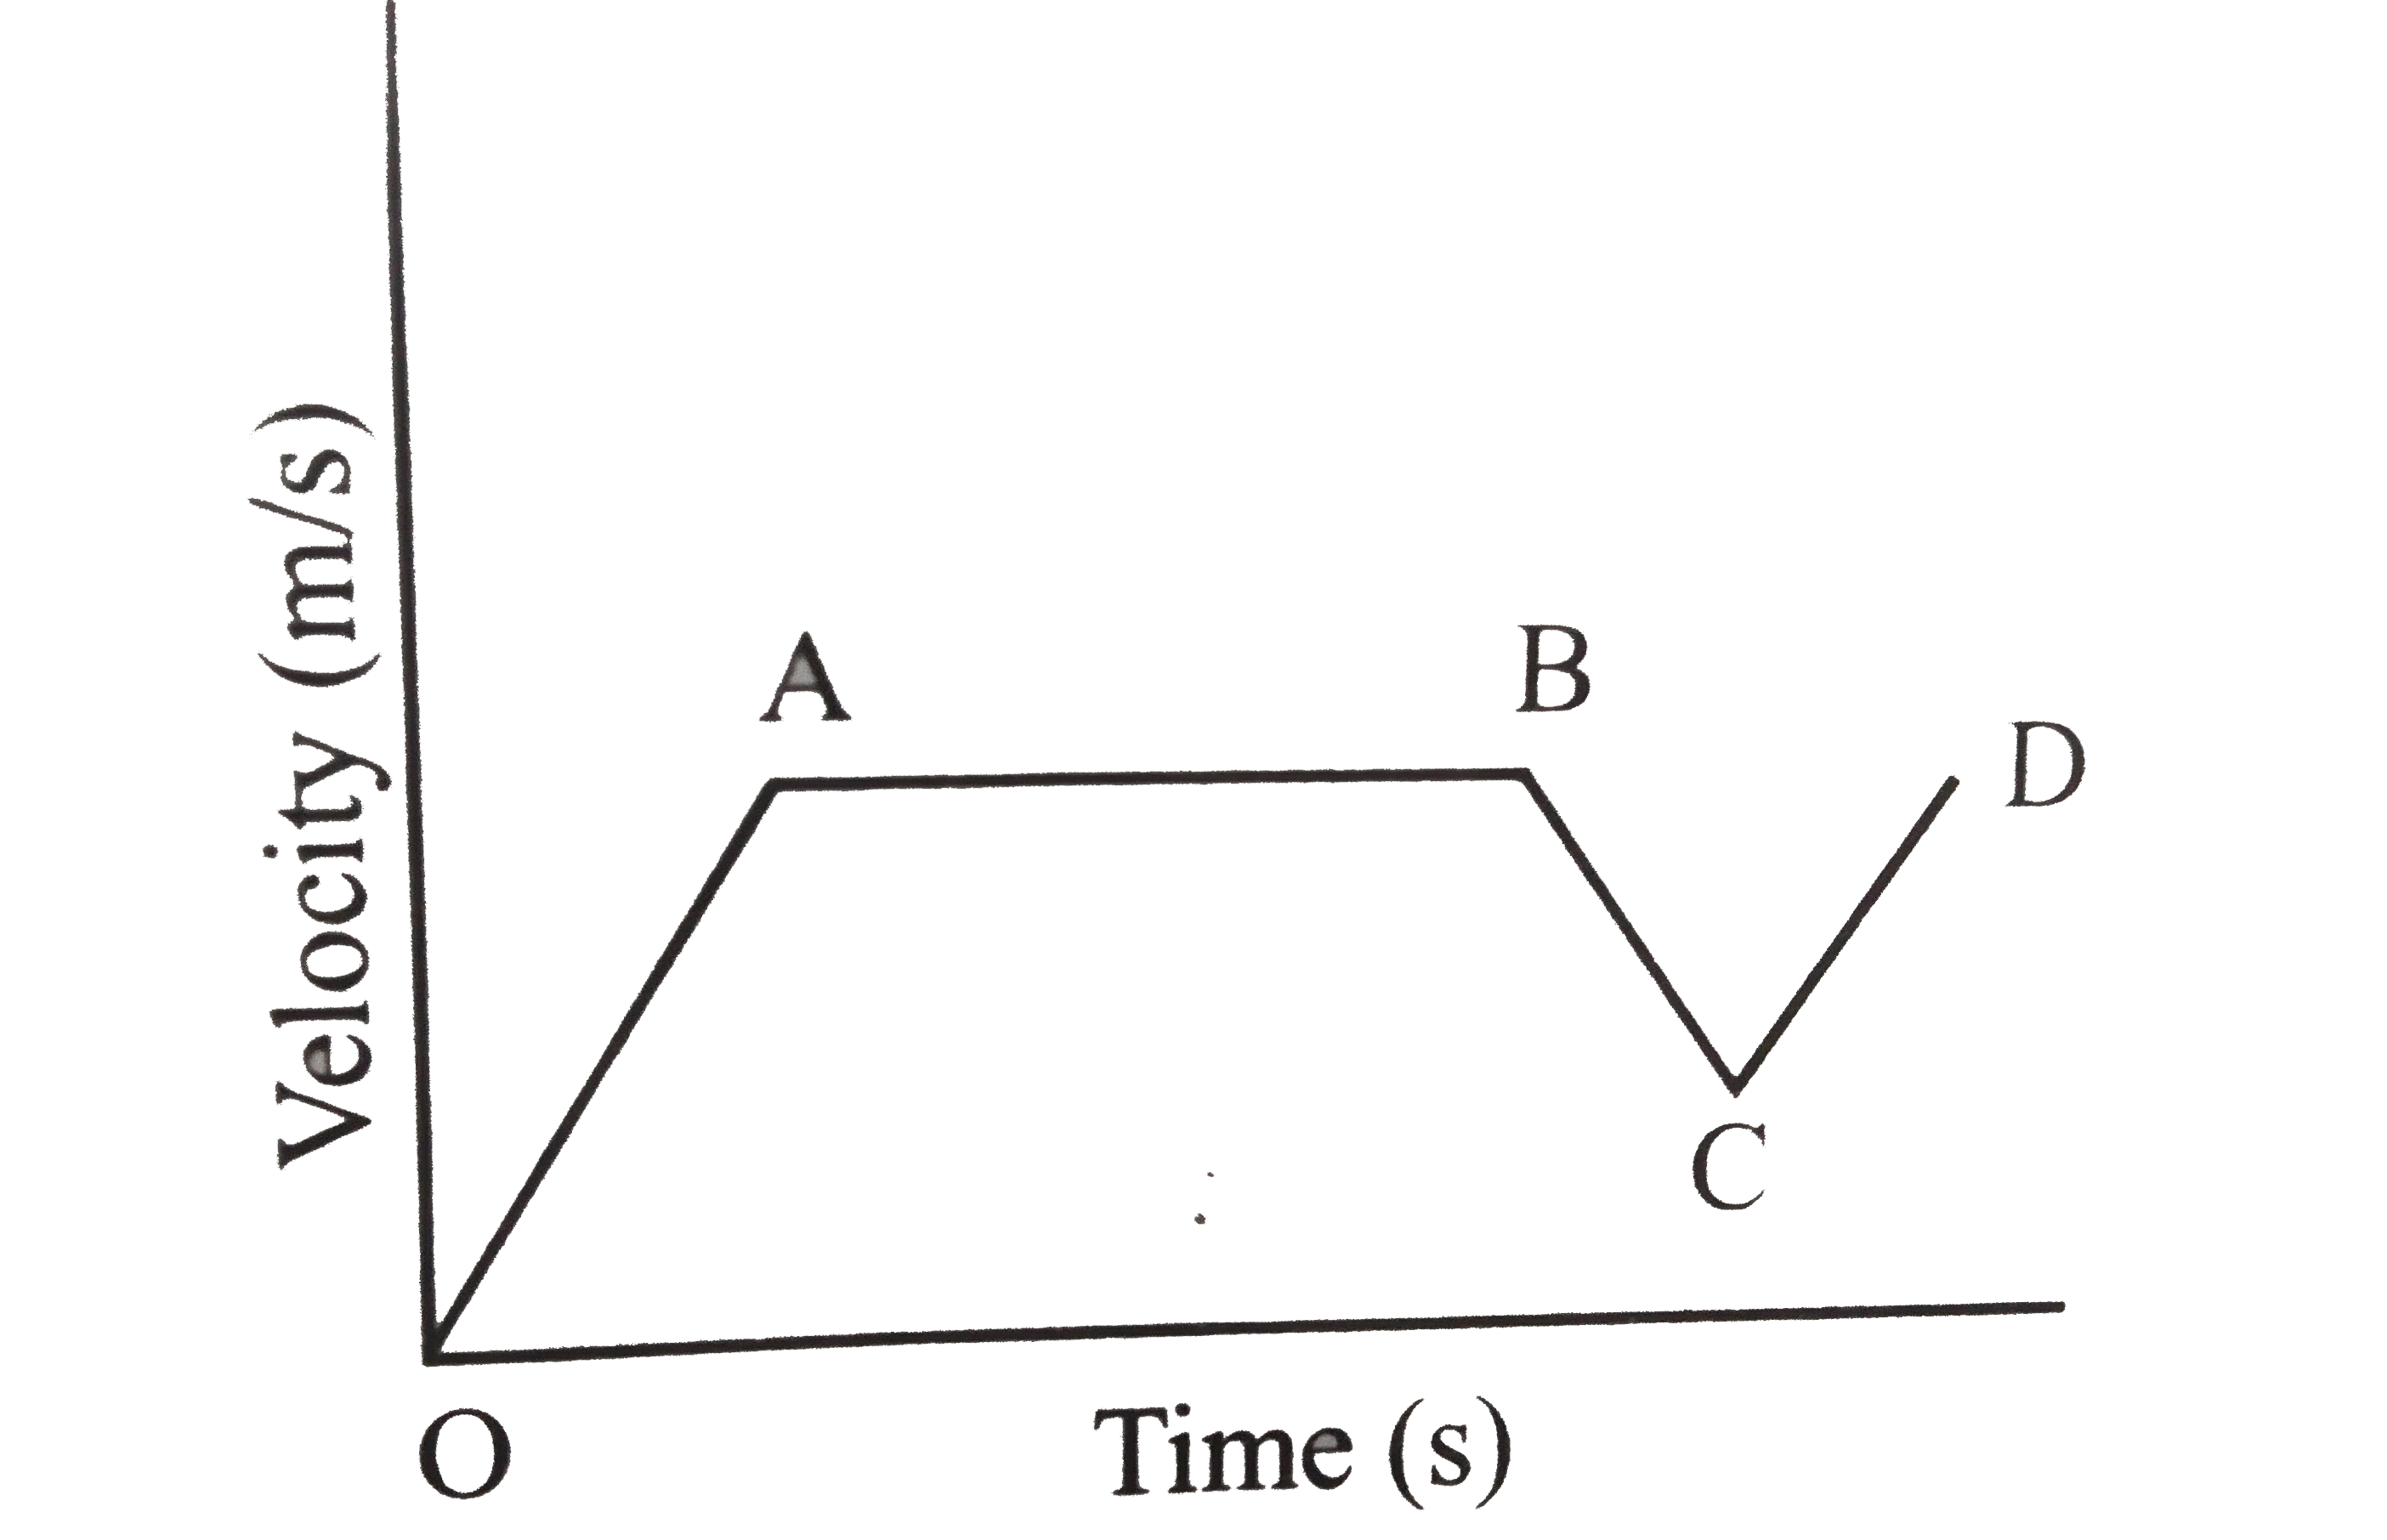
Which segment of the graph represents the retardation?
View SolutionA ball is thrown vertically upwards. Which of the following graph/graphs represent velocity-time graph of the ball during its flight (air resistance is neglected)
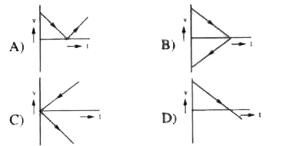
View Solution
Knowledge Check
The velocity -time graph for a body with non-uniform motion is a
Astraight lineBstraight line parallel to x-axisCstraight line parallel to y-axisDcurved lineA ball is thrown vertically upwards. Which of the following graph/graphs represent velocity time graph of the ball during its flight ( air resistance is neglected).
A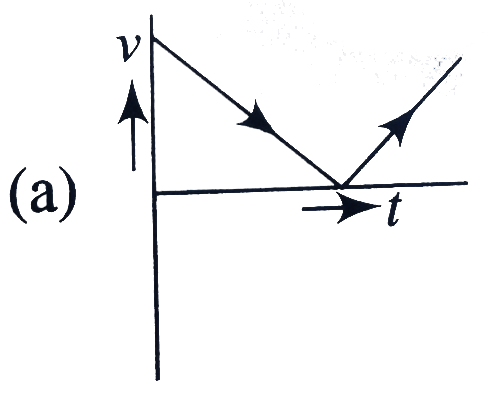 B
B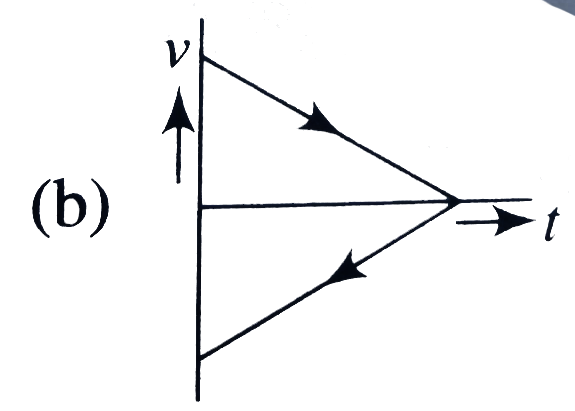 C
C D
D
The velocity time graph of the motion of a car is given here.
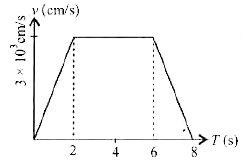 AThe distance travelled by the car in the first six seconds is 150 m.BThe deceleration of the car during the last two seconds are −15ms2.CThe distance travelled by the car in the first six second is 220 m.DThe deceleration of the car during the last two second is −20ms2
Which of the following velocity-time graphs represent uniform motion
View SolutionWhich of the following graphs represents the position time-graph of a particle moving with negative velocity?
View SolutionWhich of the following graphs represents the position time-graph of a particle moving with negative velocity?
View SolutionWhich of the following graphs represents the displacement (s) -time (t) graph for uniform motion ?
View SolutionWhich of the following represents distance(s)-time(t) graph for a retarded motion?
View Solution
