In , you were asked to prepare a frequency distribution table regarding the concentration of sulphur dioxide in the air in parts per million of a certain city for 30 day . Using this table , find the probability of the concentration of sulphur dioxide in the interval 0.12−0.16 on any of these days . Solution in Kannada
The correct Answer is:110
Step by step video, text & image solution for In , you were asked to prepare a frequency distribution table regarding the concentration of sulphur dioxide in the air in parts per million of a certain city for 30 day . Using this table , find the probability of the concentration of sulphur dioxide in the interval 0.12 - 0.16 on any of these days . by Maths experts to help you in doubts & scoring excellent marks in Class 9 exams.
Topper's Solved these Questions
Similar Questions
Use suitable identities of find the following products
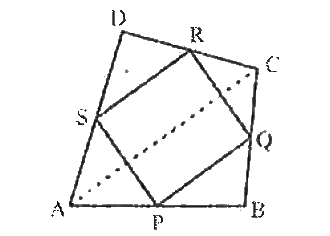
(x+4)(x+10)03:30View SolutionABCD is a quadrilateral in which P, Q, R and S are mid- points of the sides AB, BC, CD and DA. AC is a diagonal. Show that :
SR|A|C and SR=12AC
 01:55View Solution
Given below is the frequency distribution table regarding the concentration of sulphur dioxide in the air in parts per million of a certain city for 30 days.
Conc. of SO2 0.00-0.04 0.04-0.08 0.08-0.12 0.12-0.16 0.16-0.20 0.20-0.24
No of days: 4 8 9 2 4 3 Find the probability of concentration of sulphur dioxide in the interval 0.12-0.16 on any of these days.06:49View SolutionGiven below is the frequency distribution table regarding the concentration of sulphur dioxide in the air in parts per million of a certain city for 30 days.
Concentration0.00−0.040.04−0.080.08−0.120.12−0.160.16−0.200.20−0.24No. of days:489243
Find the probability of concentration of sulphur dioxide in the interval 0.12-0.16 on any of these days.02:20View SolutionA study was conduced to find out the concentration of sulphur dioxide in the air in parts per million (ppm) of a certain city. The data obtained for 30 days is as follow:
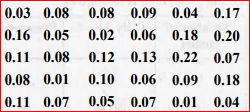
0.03 0.08 0.08 0.09 0.04 0.170.16 0.05 0.02 0.06 0.18 0.200.11 0.08 0.12 0.13 0.22 0.070.08 0.01 0.10 0.06 0.09 0.180.11 0.07 0.05 0.07 0.01 0.04
You were asked to prepare a frequency distribution table, regarding the concentration of sulphur dioxide in the air in parts per million of a certain city for 30 days. Using this table, find the probability of the concentration of sulphur dioxide in the interval 0.12-0.16 on any of these days.03:16View Solutionएक नगर में वायु में सल्फर डाई-ऑक्साइड का सांद्रण भाग प्रति मिलियन में ज्ञात करने के लिए एक अध्ययन किया गया। 30 दिनों के प्राप्त किए गए आँकड़े ये है:
0.030.080.080.090.040.170.160.050.020.060.180.200.110.080.120.130.220.070.080.010.100.060.090.180.110.070.050.070.010.04
इस सारणी की सहायता से इनमे से किसी एक दिन अंतराल (0.12-0.16) में सल्फर डाई-ऑक्साइड के सांद्रण होने की प्रायिकता ज्ञात कीजिए।02:39View Solutionएक नगर में वायु में सल्फर डाइऑक्साइड का सांद्रण भाग प्रति मिलियन में ज्ञात करने के लिए 30 दिनों के प्राप्त किए गए आँकड़े निम्नलिखित हैं -
0.170.200.070.180.040.010.040.180.220.090.090.060.130.060.070.080.020.120.100.050.080.050.080.010.070.030.160.110.080.11
इन आँकड़ों का 0.04 माप के एक वर्गीकृत बारंबारता बंटन सारणी बनाएँ | बताएँ कि -
सल्फर डाइऑक्साइड कि सांद्रता कितने दिन 0.08 भाग प्रति मिलियन से कम रही |00:55View SolutionA study was conducted to find out the concentration of sulphur dioxide in the air in parts per million (ppm) of a certain city. The data obtained for 30 days is as follows :
0.030.080.080.090.040.170.160.050.020.060.180.200.110.080.120.130.220.070.080.010.100.060.090.180.110.070.050.070.010.04
(i) Makes a grouped frequency distribution table for this data with class intervals as 0.00-0.04,0.04-0.08, and so on.03:44View SolutionA study was conducted to find out the concentration of sulphur dioxide in the air in parts per million (ppm) of a certain city. The data obtained for 30 days is as follows :
0.030.080.080.090.040.170.160.050.020.060.180.200.110.080.120.130.220.070.080.010.100.060.090.180.110.070.050.070.010.04
(ii) For how many days, was the concentration of sulphur dioxide more than 0.11 parts per million ?01:44View SolutionA study was conducted to find out the concentration of sulphur dioxide in the air in parts per million (ppm) of a certain city. The data obtained for 30 days is as follows :

You were asked to prepare a frequency distribution table, regarding the concentration of sulphur dioxide in the air in parts per million (ppm) of a certain city for 30 days . Using this table, find the probability of the concentration of sulphur dioxide in the interval 0.12-0.16 on any of these days.02:32View SolutionGiven below is the frequency distribution table regarding the concentration of sulphur dioxide in the air in parts per million of a certain city for 30 days.
Concentration0.00−0.040.04−0.080.08−0.120.12−0.160.16−0.200.20−0.24No. of days:489243
Find the probability of concentration of sulphur dioxide in the interval 0.12-0.16 on any of these days.05:02View SolutionIn sum you were asked to prepare a frequency distribution table, regarding the concentration of sulphur dioxide in the air in parts per million of a certain city for 30 days. Using this table, find the probability of the concentration of sulphur dioxide in the interval 0.12 -0.16 on any of these days.
View SolutionA study was conducted to find out the concentration of sulphur dioxide in the air in parts per million (ppm) of a certain city. The data obtained for 30 days is as follows:

(i) Make a grouped frequency distribution table for this data with class intervals as 0.00 -0.04, 0.04 -0.08, and so on. (ii) For how many days, was the concentration of sulphur dioxide more than 0.11 parts per million ?07:49View SolutionIn sum you were asked to prepare a frequency distribution table, regarding the concentration of sulphur dioxide in the air in parts per million of a certain city for 30 days. Using this table, find the probability of the concentration of sulphur dioxide in the interval 0.12 -0.16 on any of these days.
03:38View SolutionA study was conducted to find out the concentration of sulphur dioxide in the air in parts per million (ppm) of a certain city. The data obtained for 30 days is as follows :
 Make a grouped frequency distribution table for this data with class intervals as 0.00 - 0.04, 0.04 -0.08 and so on.02:37View Solution

