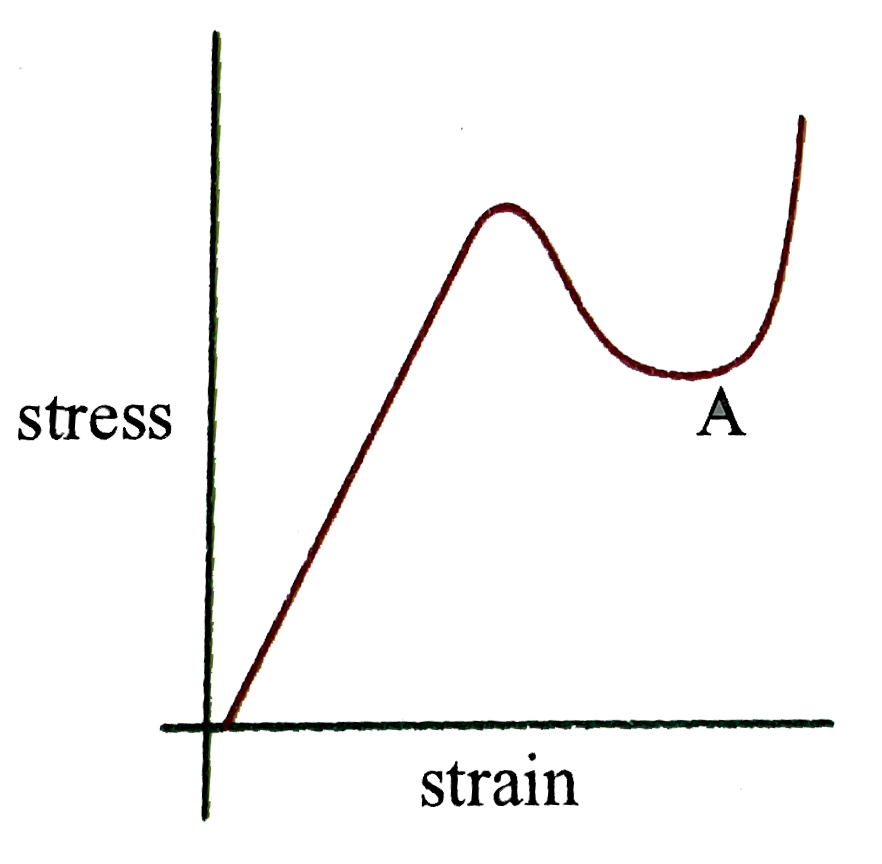
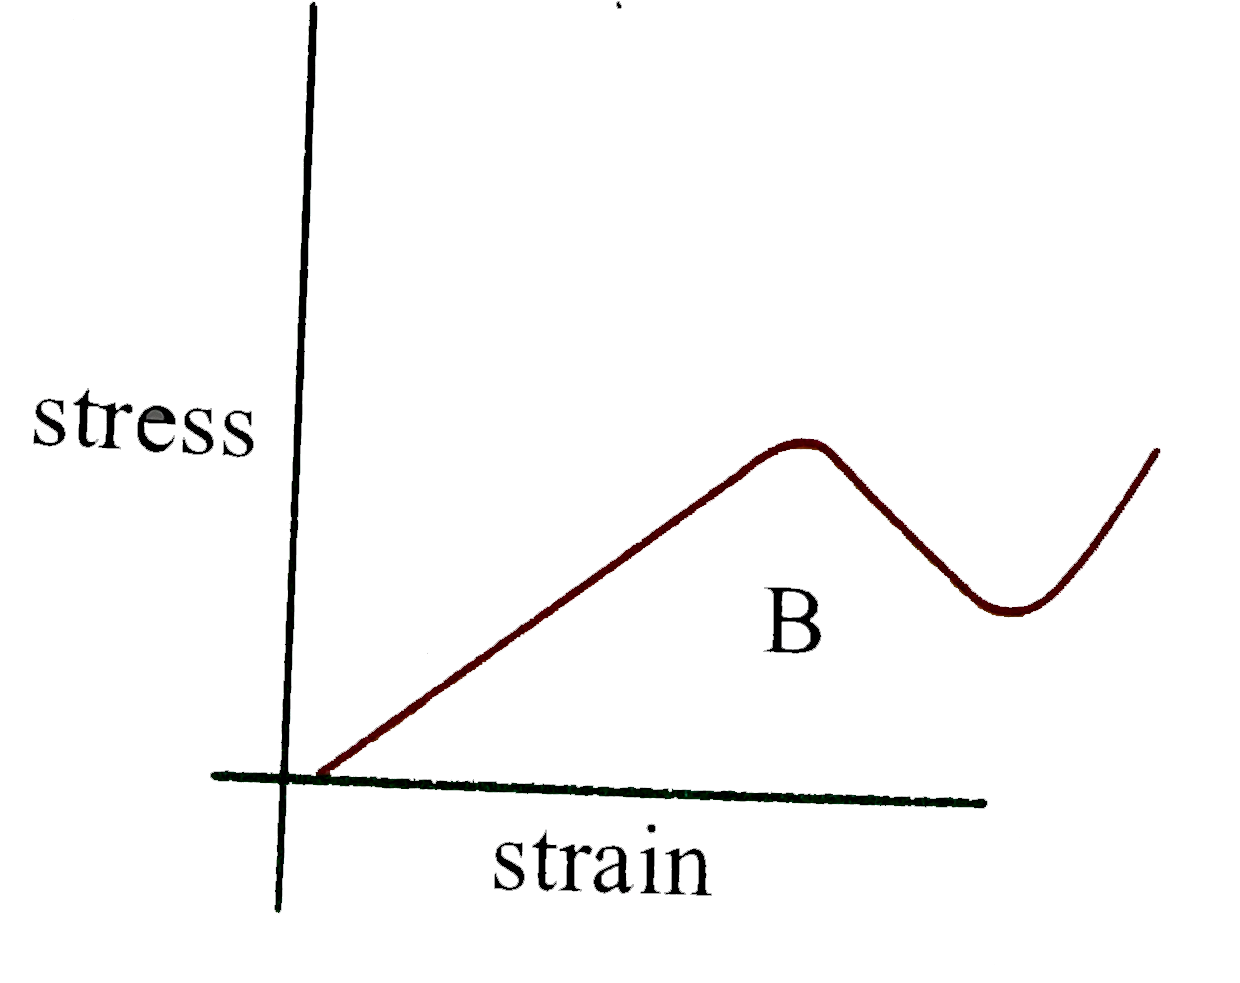
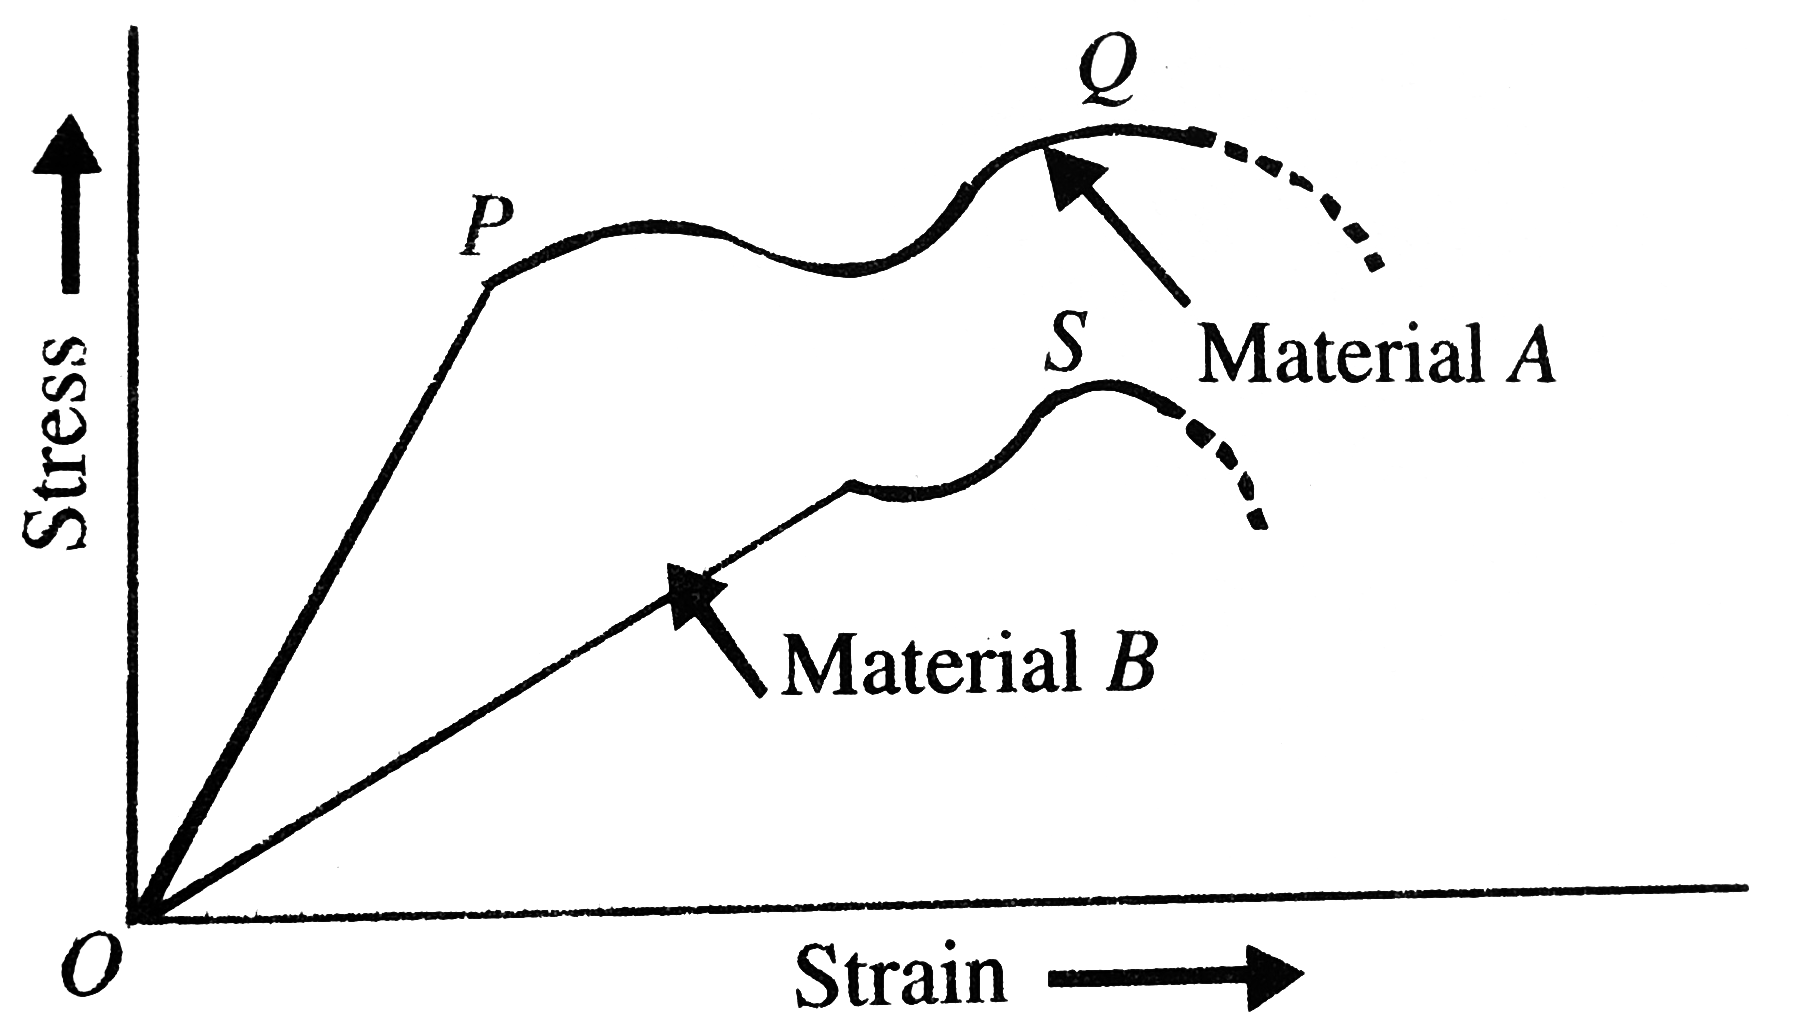
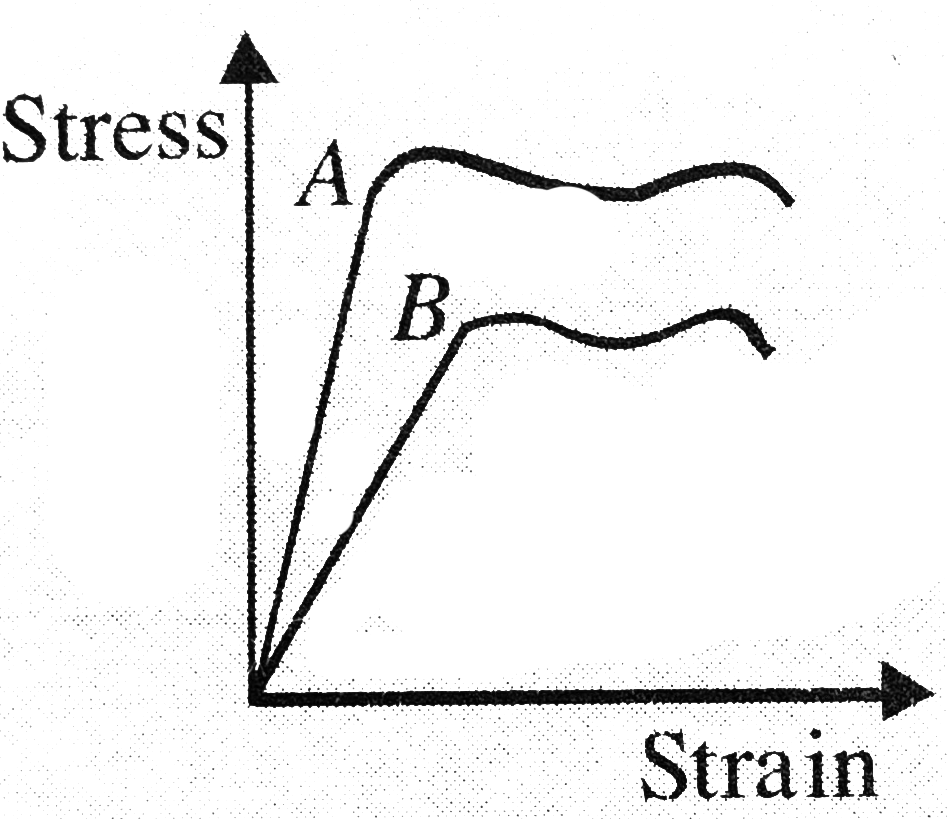
The diagram shows stress v/s strain curve for the materials A and B. From the curves we infer that
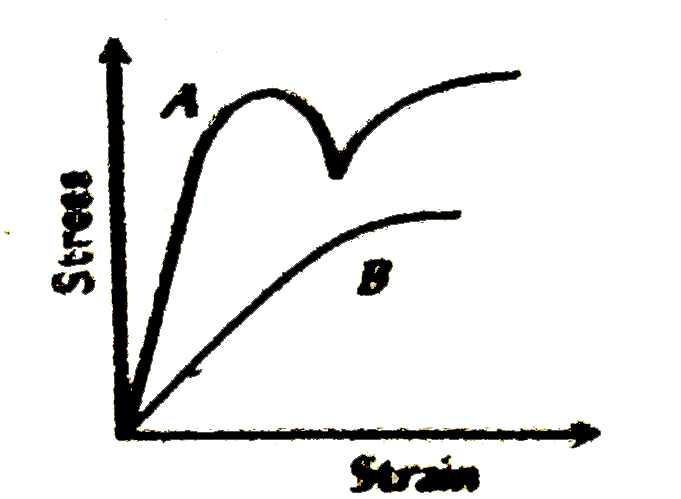
A is brittle but B ductile
A is ductile and B brittle
Both A and B are ductile
Both A and B are brittle
The correct Answer is:B
Step by step video & image solution for The diagram shows stress v/s strain curve for the materials A and B. From the curves we infer that by Physics experts to help you in doubts & scoring excellent marks in Class 12 exams.
Topper's Solved these Questions
- BOOK - MOTIONCHAPTER - ELASTICITY AND THERMAL EXPANSIONEXERCISE - Exercise -1 (Section B - Thermal Stress, Hookes Law)6videos
ELASTICITY AND THERMAL EXPANSION
- BOOK - MOTIONCHAPTER - ELASTICITY AND THERMAL EXPANSIONEXERCISE - Exercise -1 (Section C - Youngs Modulus, Poissions Ratio)4videos
ELASTICITY AND THERMAL EXPANSION
- BOOK - MOTIONCHAPTER - ELASTICITY AND THERMAL EXPANSIONEXERCISE - Exercise - 4 (Level-II)11videos
ELASTICITY AND THERMAL EXPANSION
- BOOK - MOTIONCHAPTER - ELASTICITYEXERCISE - EXERCISE -360videos
ELASTICITY
- BOOK - MOTIONCHAPTER - Electrical Instrument EXERCISE - EXERCISE -316videos
Electrical Instrument
Similar Questions
Knowledge Check
- Question 1 - Select One
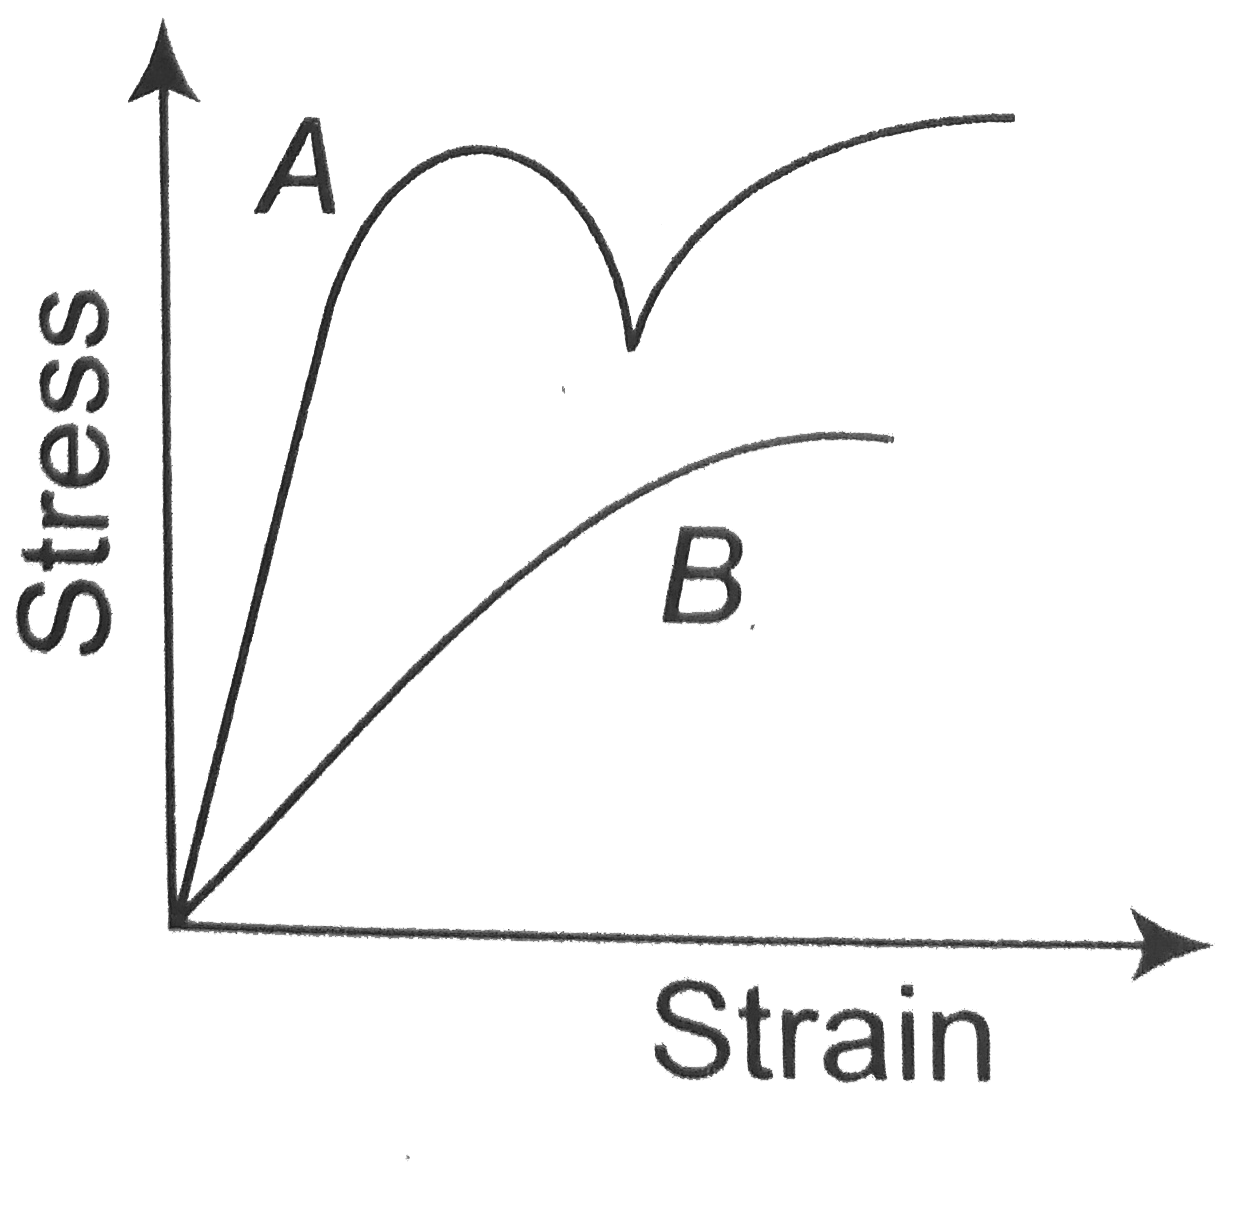
The diagram shoes stress v/s strain curve for the materials A and B. From the curves we infer thatAA is brittle but B is ductileBA is ductile and B is brittleCBoth A and B are ductileDBoth A and B are brittle - Question 2 - Select One or More
Figure shows the stress-strain graphs for materials .A and B. From the graph it follows that
 Ato material A has a higher Young's modulusBmaterial B is more ductileCmaterial A can withstand greater stressDmaterial B can withstand greater stress
 - Question 3 - Select One
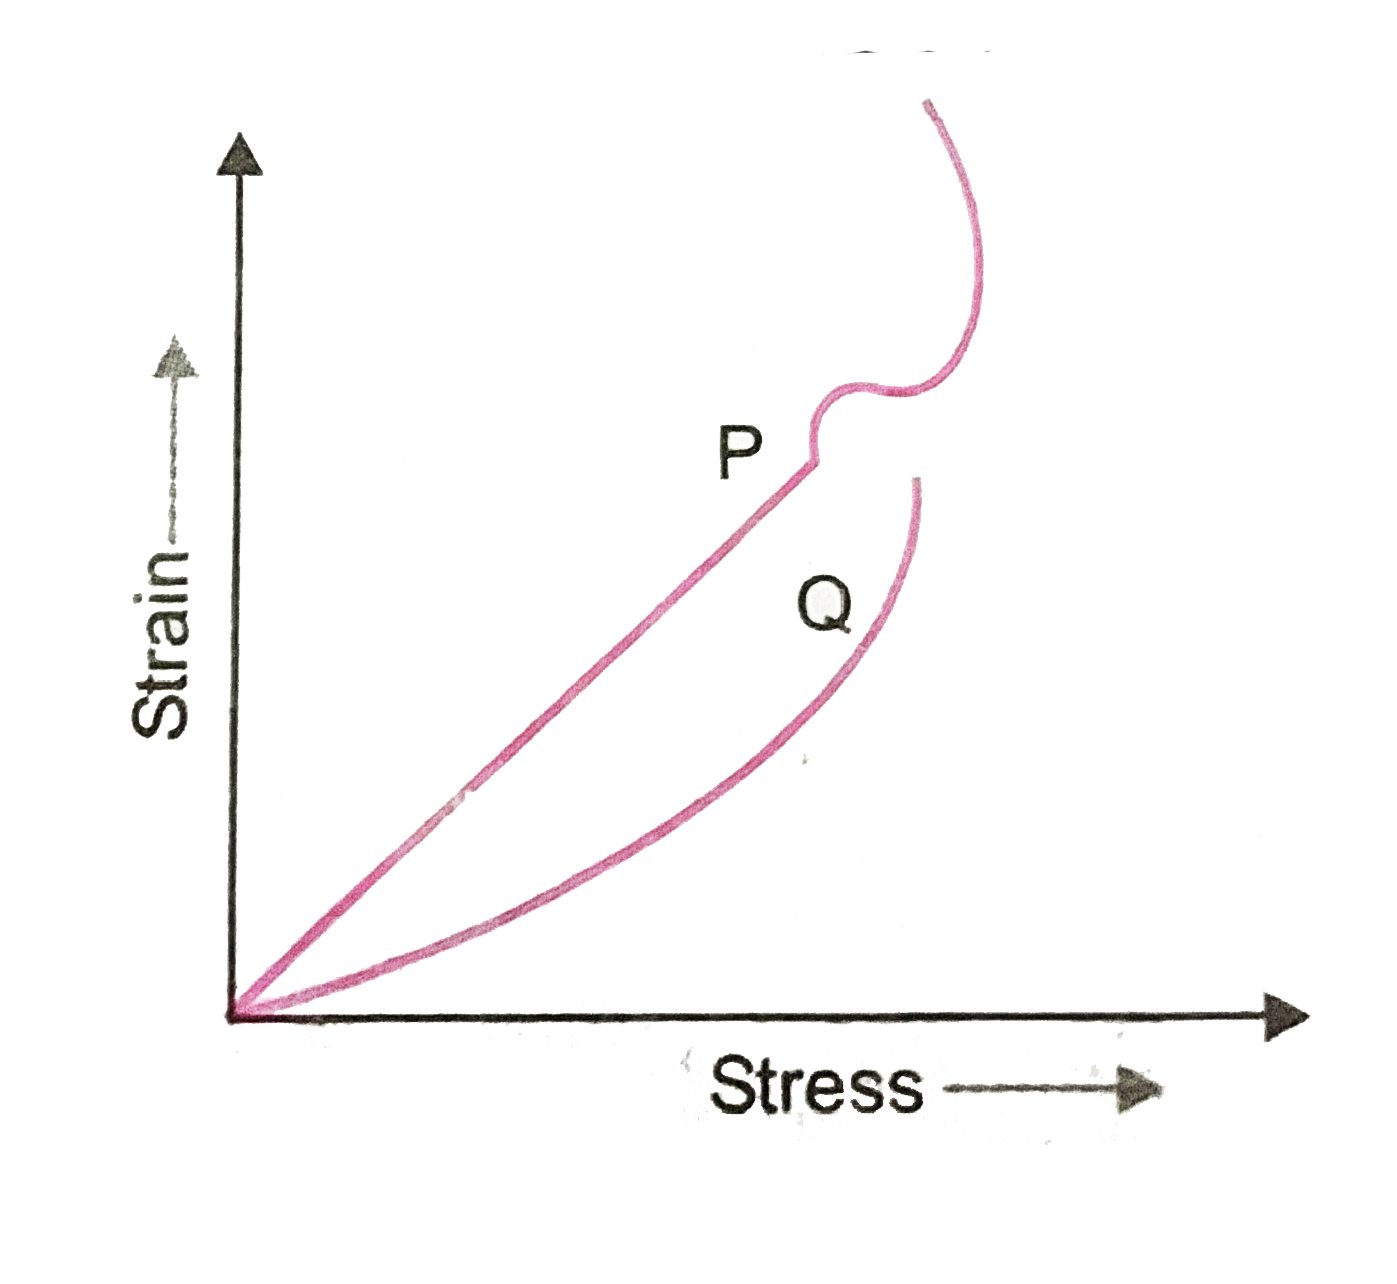
Figure shows the stress-strain curve of two metals P and Q. From the graph, it can be concluded that
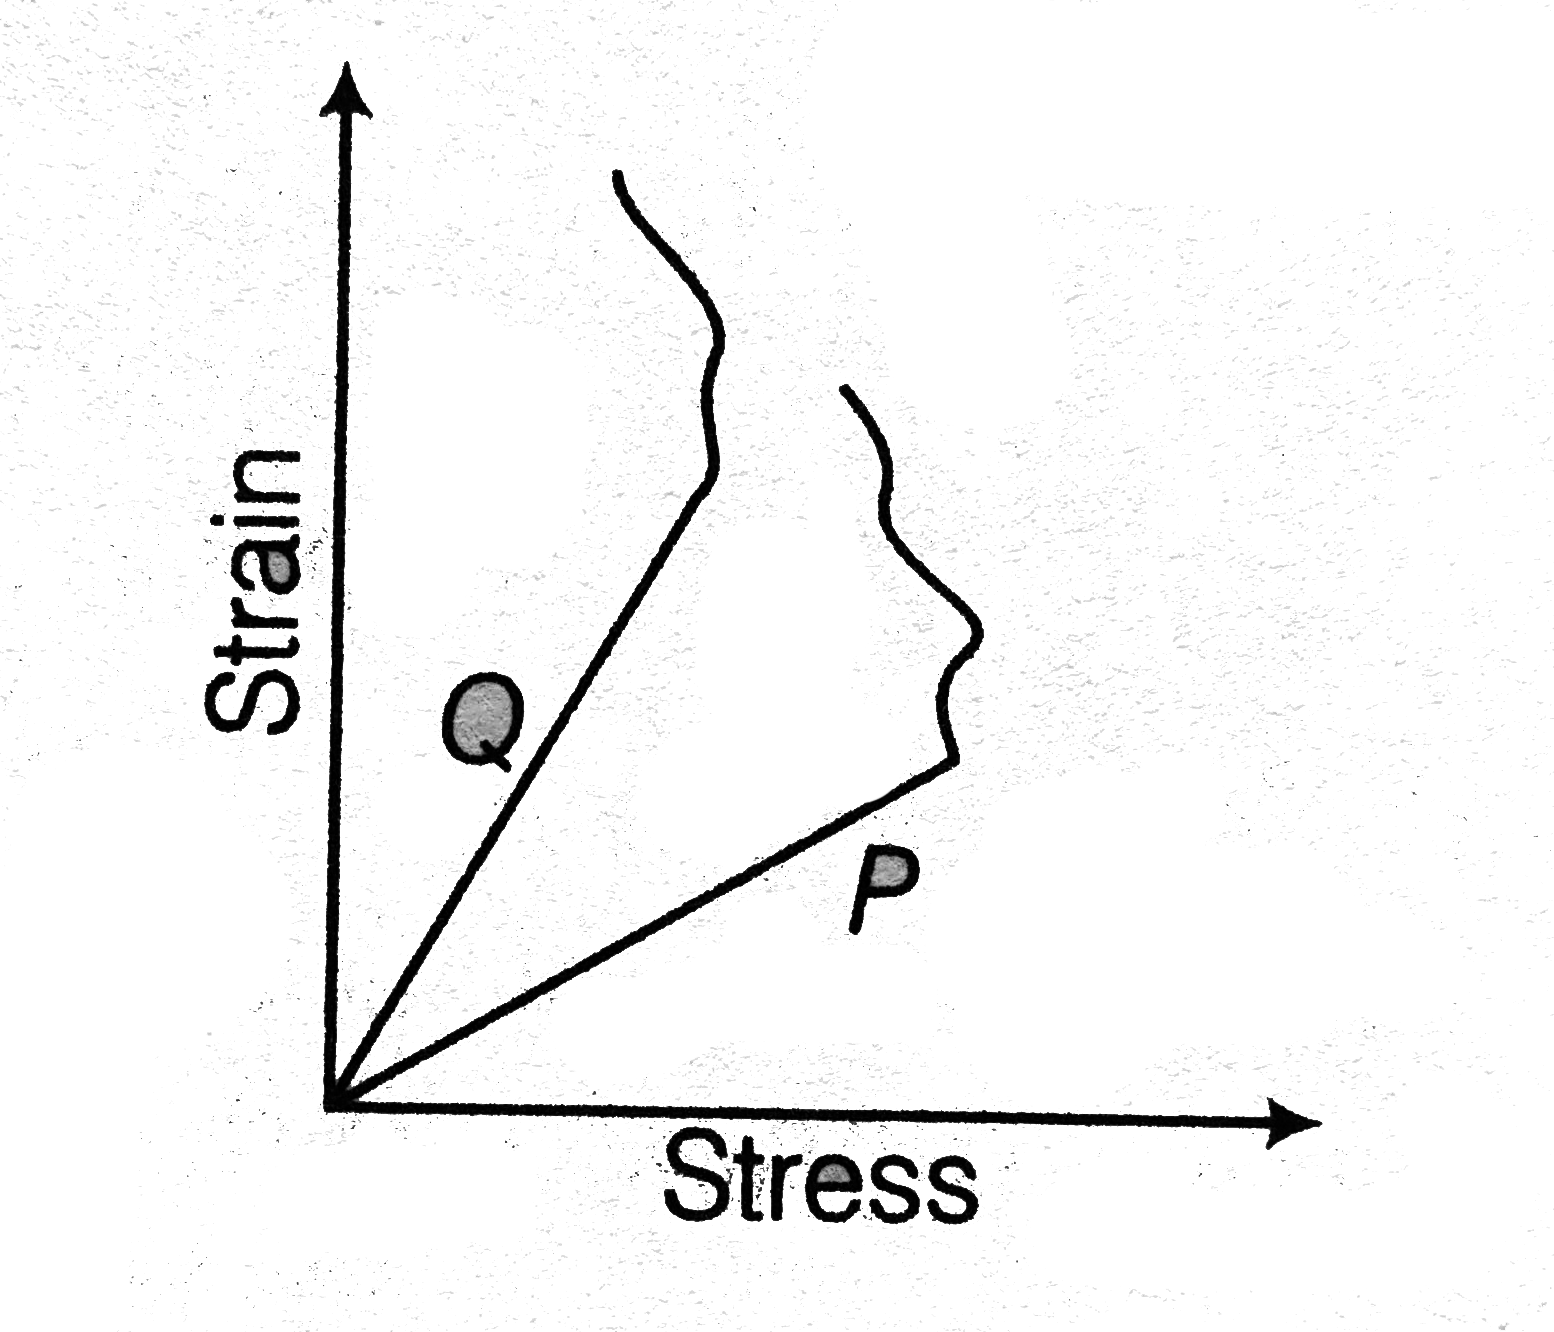 A(A) P has greater young's modulus and lesser ductilityB(B) Q has greater young's modulus and lesser ductilityC(C) P has greater young's modulus and greater ductilityD(D) Q has greater young's modulus and greater ductility
The diagram shows the transportation of materials by
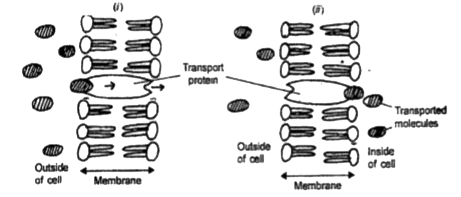 View Solution
The stress versus strain graphs for wires of two materials A and B are as shown in the figure. If YAandYB are the younng's moduli of the materials, then
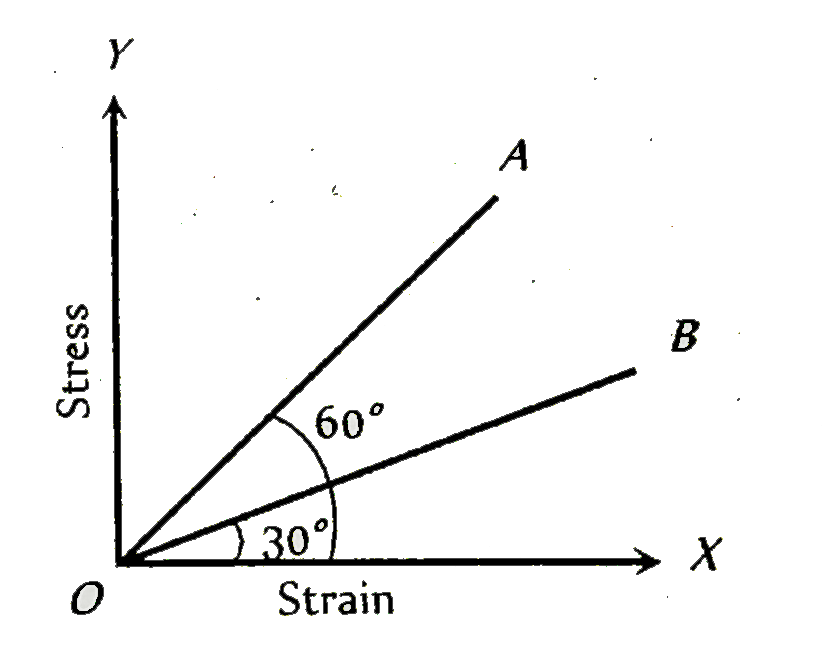 View Solution
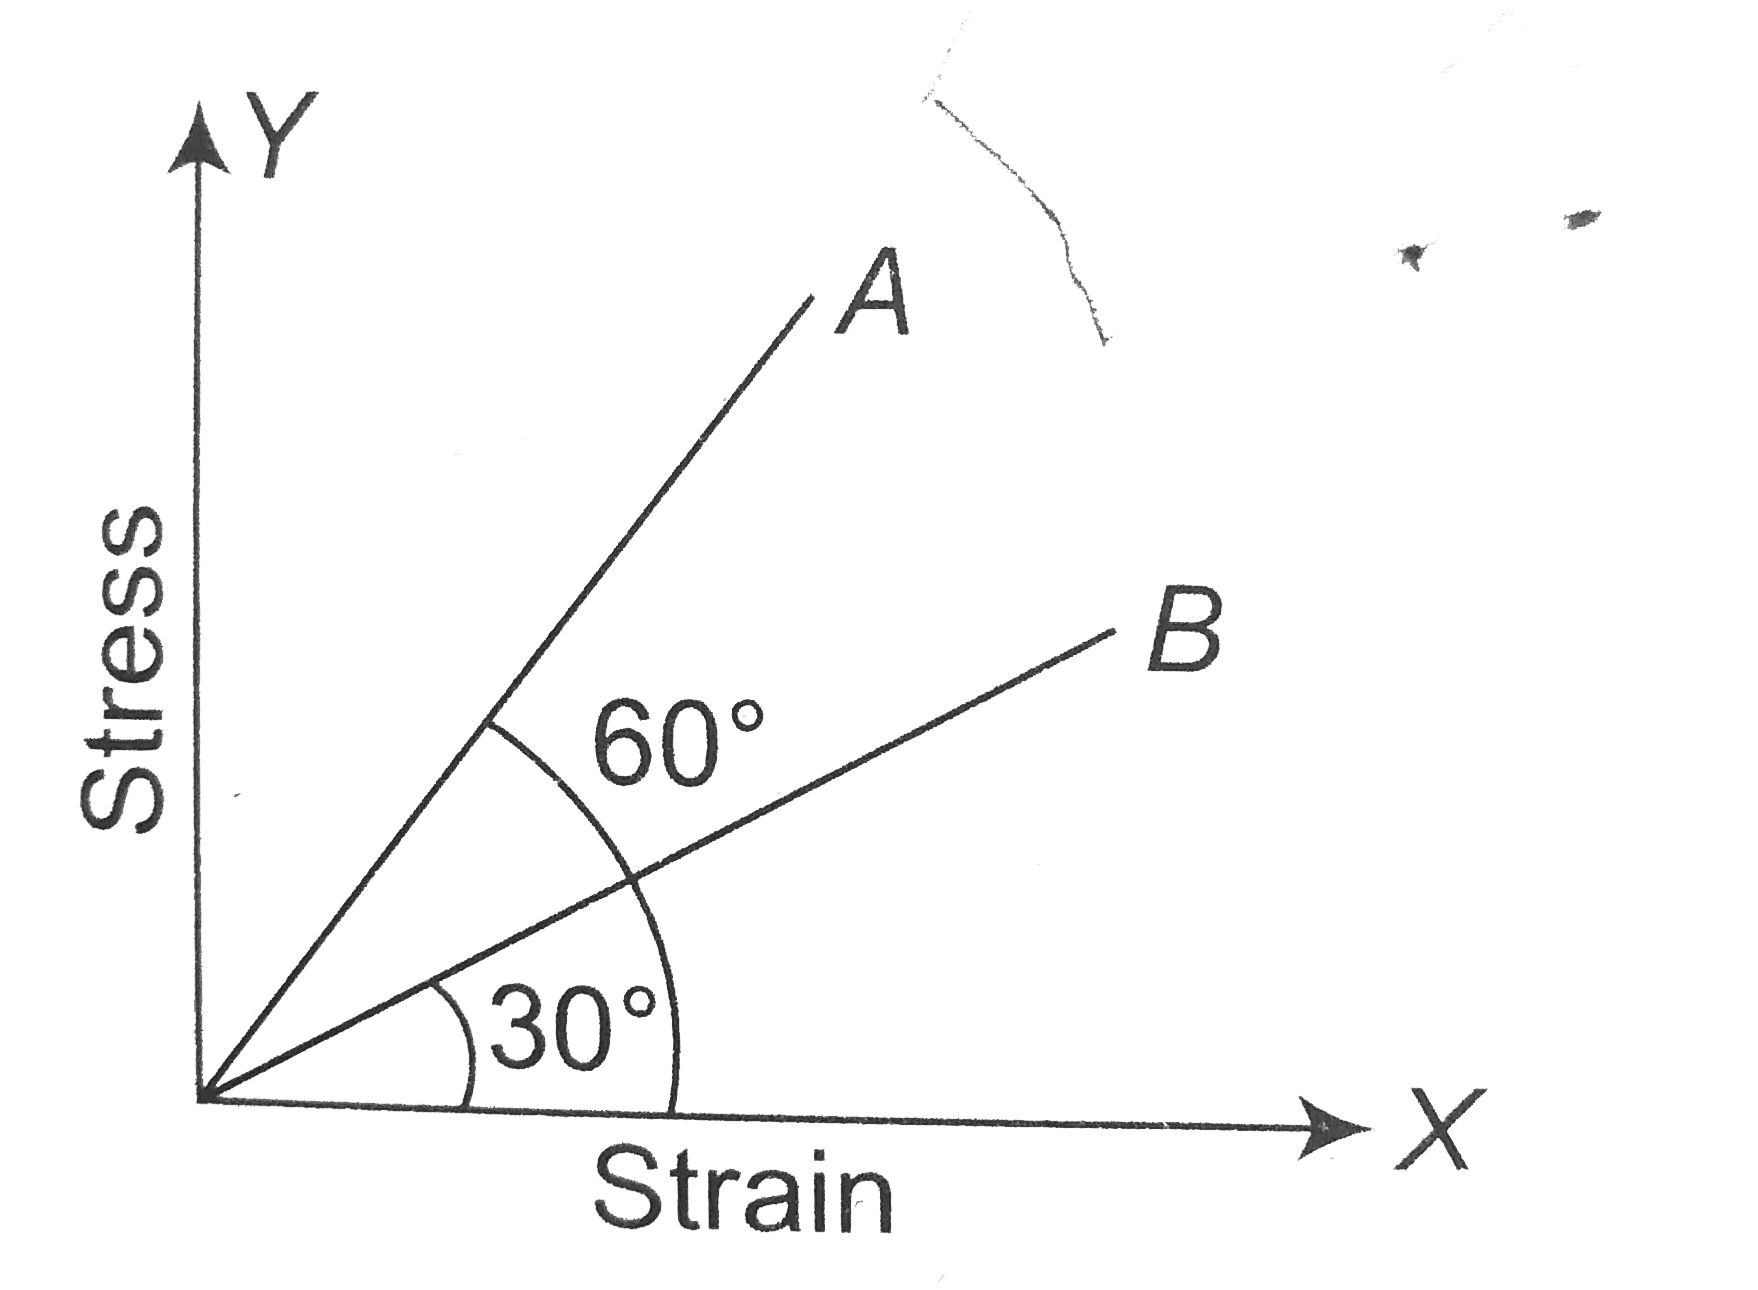
The stress versus strain graphs for wires of two materials A and B are as shown in the figure. If YA and YB are the Young's moduli of the materials thenView SolutionThe stress and strain graphs for two materials, A and B are shown here. Answer the following:
 give reasonsView Solution
In plotting stress versus strain curves for two material P and Q, a student by mistake puts strain on the y-axis stress on ther x-axis as shown in the figure. Then the correct statement is/are
 View Solution


