The correct curve between intensity of scattering (I) and the angle of diffraction ϕ in Davison - Germer experiment is :
The correct Answer is:A
Step-by-Step Solution:
1. Understanding the Davison-Germer Experiment:
- The Davison-Germer experiment demonstrated the wave nature of electrons through diffraction patterns. The intensity of scattered electrons is measured at various angles of diffraction.
2. Identifying Key Parameters:
- The experiment indicates that the maximum intensity of scattering occurs at a specific angle of diffraction, which is 50 degrees in this case.
3. Analyzing the Intensity vs. Angle of Diffraction:
- As the angle of diffraction increases from 0 degrees, the intensity of scattering will rise, reaching a peak at 50 degrees, and then it will start to decrease. This behavior is typical for diffraction patterns.
4. Evaluating the Options:
- The problem provides four options for the graph of intensity (I) versus angle of diffraction (φ). We need to identify which graph correctly represents the behavior described.
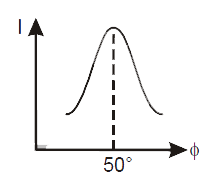
- Option A: Shows a peak at 50 degrees, which corresponds to the highest intensity.
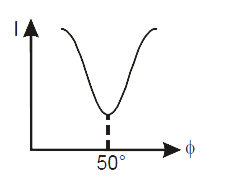
- Option B: Indicates low intensity at 50 degrees, which is incorrect.
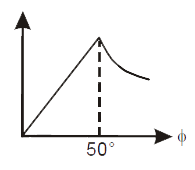
- Option C: Displays a straight line, which does not represent the expected curve.
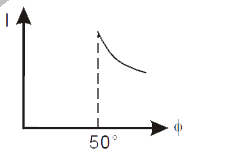
- Option D: Does not show an increase in intensity leading up to 50 degrees, making it incorrect.
5. Conclusion:
- The correct graph is the one that shows the intensity peaking at 50 degrees. Therefore, Option A is the correct answer.
Final Answer:
The correct curve between intensity of scattering (I) and the angle of diffraction (φ) in the Davison-Germer experiment is represented by Option A.
---
- The Davison-Germer experiment demonstrated the wave nature of electrons through diffraction patterns. The intensity of scattered electrons is measured at various angles of diffraction.
- The experiment indicates that the maximum intensity of scattering occurs at a specific angle of diffraction, which is 50 degrees in this case.
- As the angle of diffraction increases from 0 degrees, the intensity of scattering will rise, reaching a peak at 50 degrees, and then it will start to decrease. This behavior is typical for diffraction patterns.
- The problem provides four options for the graph of intensity (I) versus angle of diffraction (φ). We need to identify which graph correctly represents the behavior described.
- Option A: Shows a peak at 50 degrees, which corresponds to the highest intensity.
- Option B: Indicates low intensity at 50 degrees, which is incorrect.
- Option C: Displays a straight line, which does not represent the expected curve.
- Option D: Does not show an increase in intensity leading up to 50 degrees, making it incorrect.
- The correct graph is the one that shows the intensity peaking at 50 degrees. Therefore, Option A is the correct answer.
The correct curve between intensity of scattering (I) and the angle of diffraction (φ) in the Davison-Germer experiment is represented by Option A.
Topper's Solved these Questions
- MATTER WAVEBOOK - MOTIONCHAPTER - MATTER WAVEEXERCISE - EXERCISE 3 (SECTION A)
17 Videos
- MATTER WAVEBOOK - MOTIONCHAPTER - MATTER WAVEEXERCISE - EXERCISE 3 (SECTION B)
7 Videos
- MATTER WAVEBOOK - MOTIONCHAPTER - MATTER WAVEEXERCISE - EXERCISE 1 (SECTION B : DAVISSION GERMER EXPERIMENT )
11 Videos
- MAGNETISM -1BOOK - MOTIONCHAPTER - MAGNETISM -1EXERCISE - Exercise - 3 SECTION -A
56 Videos
- MODERN PHYSICSBOOK - MOTIONCHAPTER - MODERN PHYSICSEXERCISE - PHYSICS
73 Videos
Similar Questions
Knowledge Check
The correct curve between the stopping potential (V) and intensity of incident light (I) is
A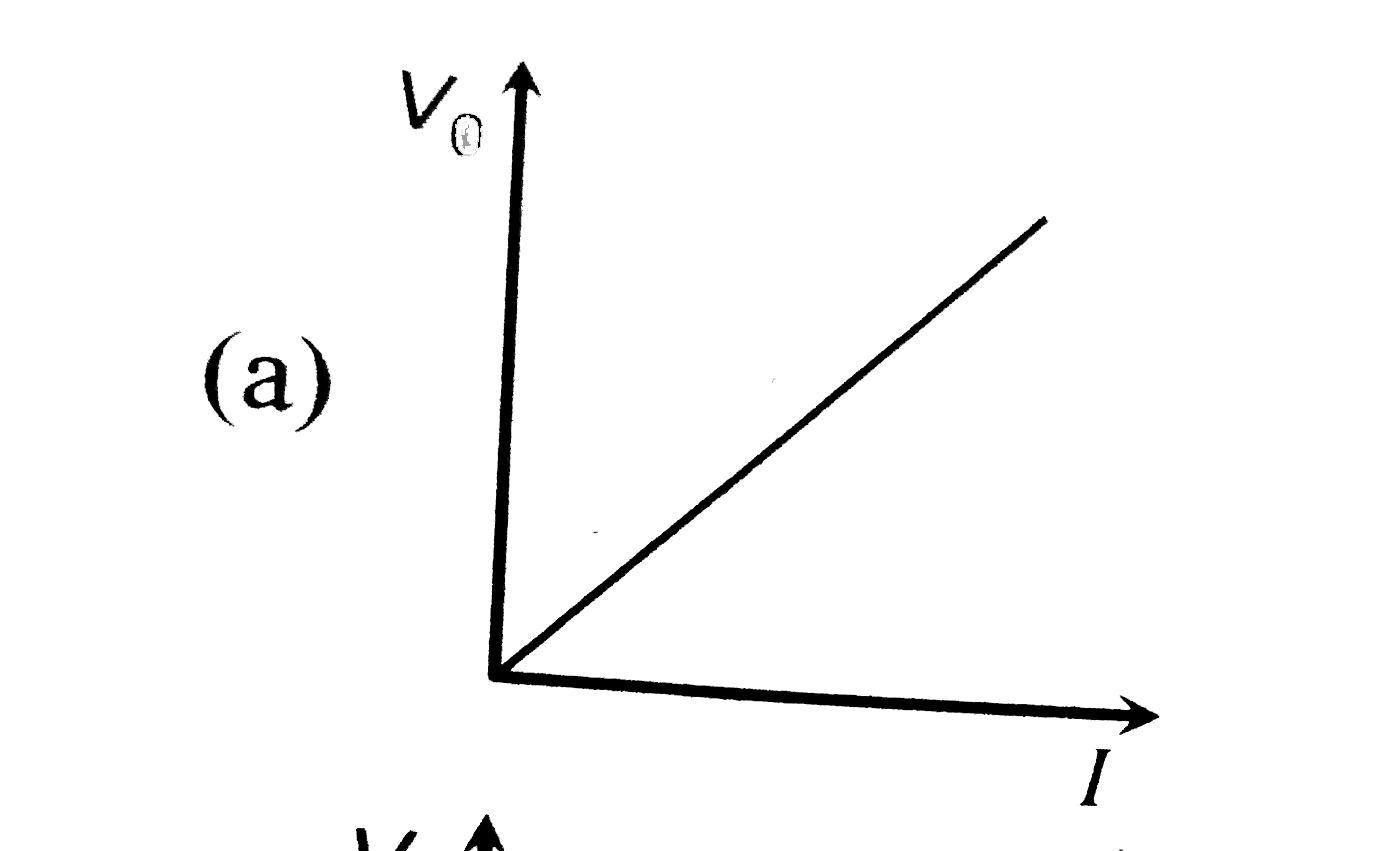 B
B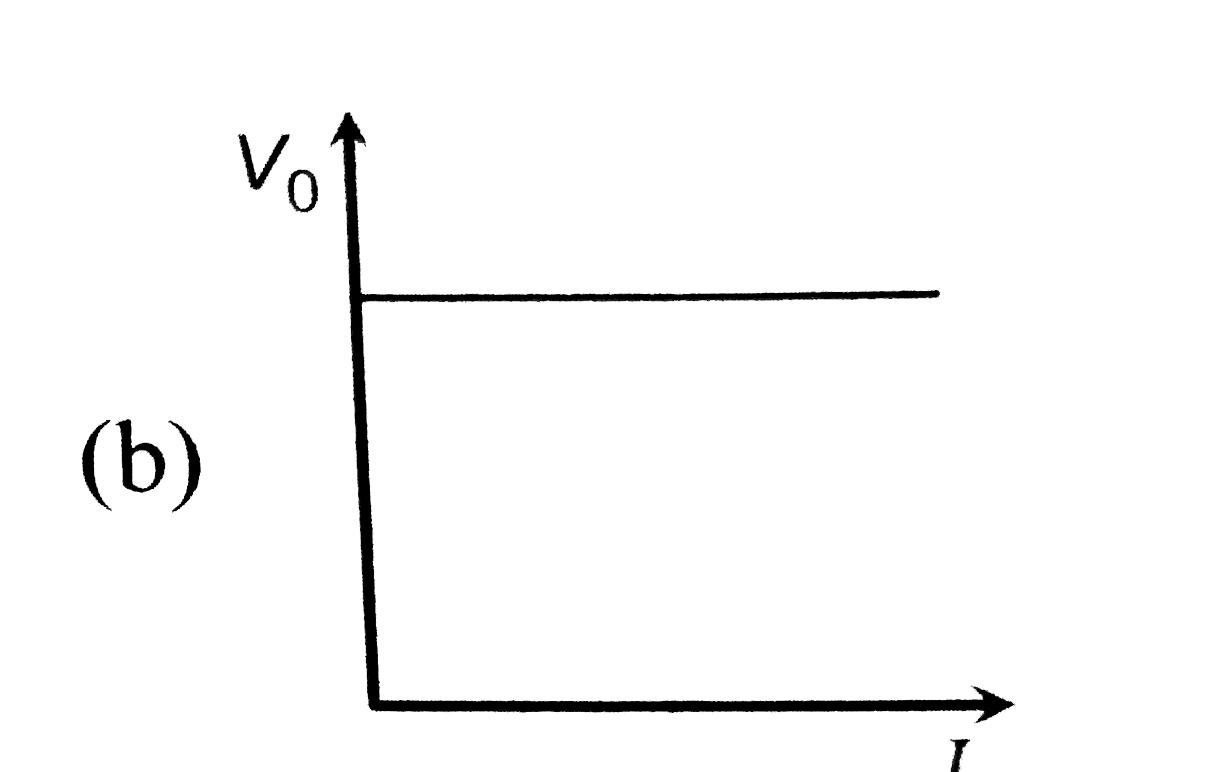 C
C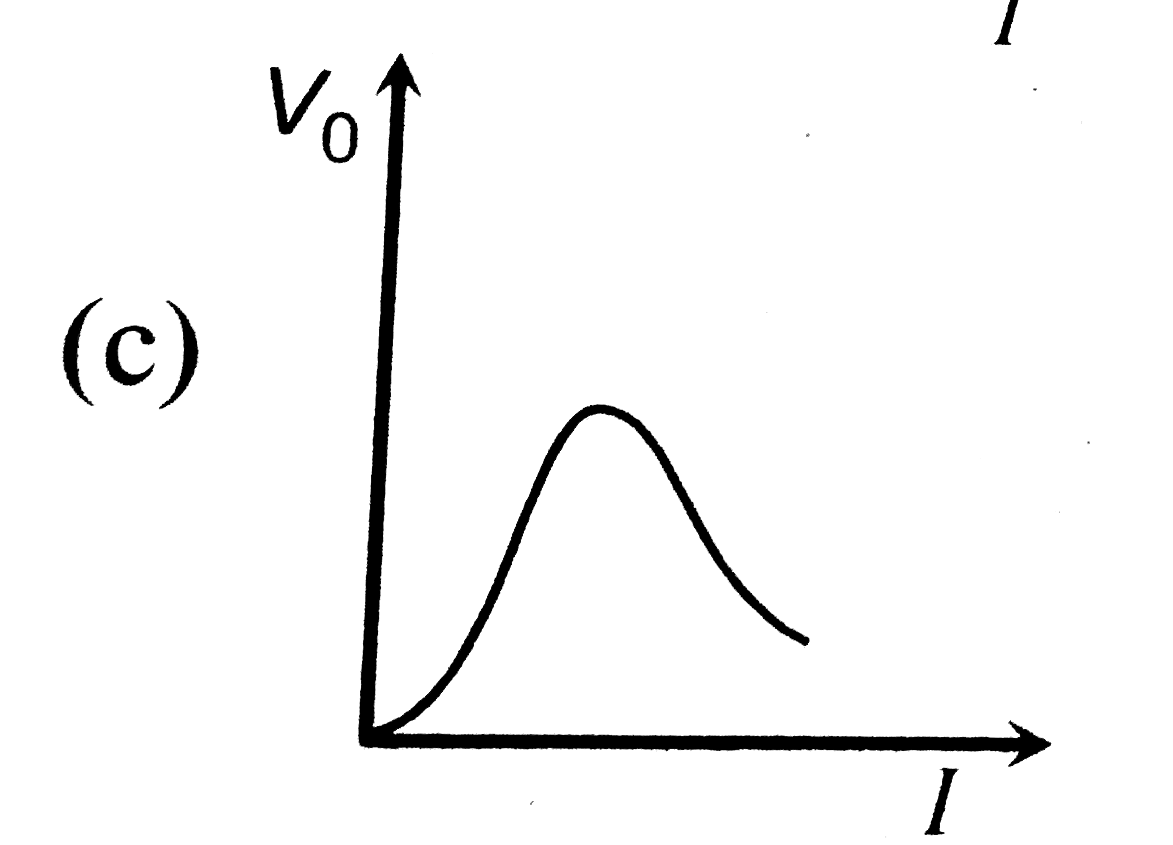 D
D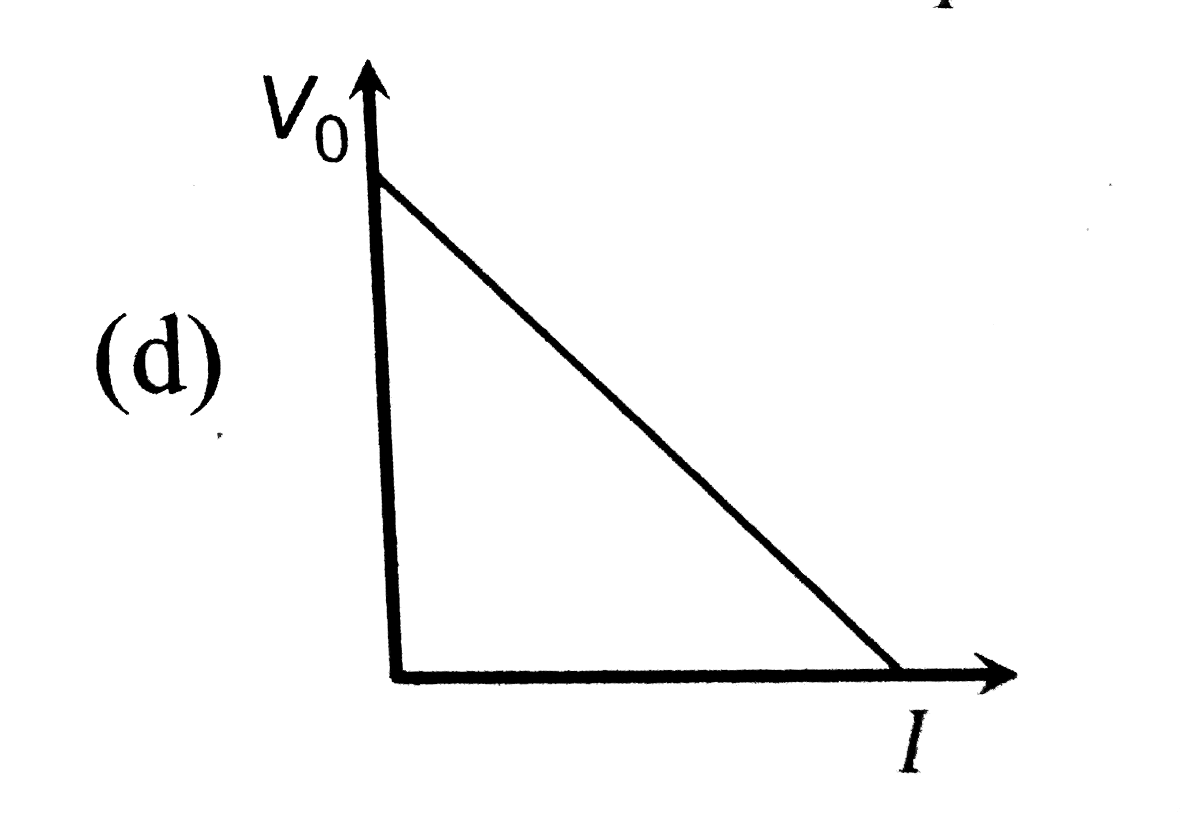
Which crystal is used to scatter electrons in the Davission and Germer experiment?
AcobaltBNickelCCalciteDSilverIn Davisson-Germer experiment, the correct relation between angle of diffraction ϕ and glancing angle θ is-
Aθ=90∘−ϕ2Bθ=90∘+ϕ2Cθ=ϕ2Dθ=ϕ
In Davisson-Germer experiment the relation between the angle of diffraction θ and the grazing angle 0ϕ is
View SolutionWhich of the following may be representing graph between number of scattered particles detected (N) and scattering angle(θ) in Rutherford's experiment?
View SolutionWhich of the following may be representing graph between number of scattered particles detected (N) and sacttering angle (θ) in Rutherford's experiment?
View SolutionThe correct relation between scattering angle (θ), impact parameter (b) and distance of closest approach (D) is
View SolutionCorrect relation between magnetic field B, Magnetic intensity H and intensity of Magnetisation I is
View Solution
