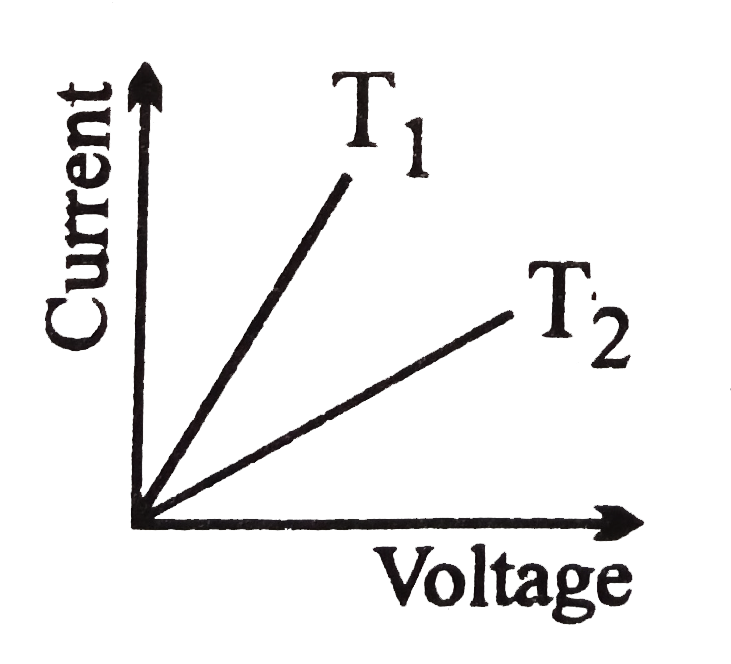
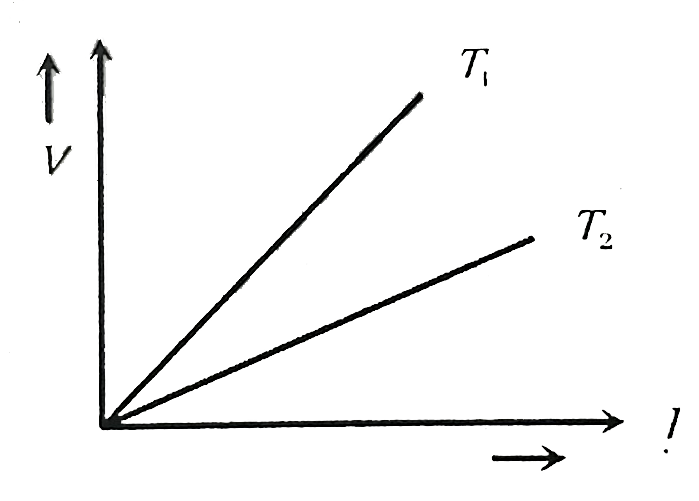
The current in a metallic conductor is plotted against voltage at two different temperatures and . Which is correct
none
The correct Answer is:B
Step by step video & image solution for The current in a metallic conductor is plotted against voltage at two different temperatures T_1 and T_2. Which is correct by Physics experts to help you in doubts & scoring excellent marks in Class 12 exams.
Updated on:21/07/2023Topper's Solved these Questions
- CURRENT ELECTRICITYBook:MOTIONChapter:CURRENT ELECTRICITYExercise:EXERCISE -2 (OBJECTIVE PROBLEMS NEET)
Explore 41 Videos
- CURRENT ELECTRICITYBook:MOTIONChapter:CURRENT ELECTRICITYExercise:EXERCISE -3 SECTION -A (PREVIOUS YEAR PROBLEMS NEET)
Explore 34 Videos
- CURRENT ELECTRICITYBook:MOTIONChapter:CURRENT ELECTRICITYExercise:EXERCISE -4 (Level -II)
Explore 25 Videos
- CONSTRAINED MOTION Book:MOTIONChapter:CONSTRAINED MOTION Exercise:EXAMPLES
Explore 12 Videos
- ELASTICITYBook:MOTIONChapter:ELASTICITYExercise:EXERCISE -3
Explore 60 Videos
Similar Questions
The current in a metllic conductor is plotted against voltage at two different temperatures T1andT2. Which is correct
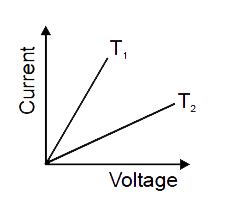
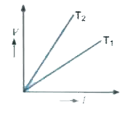
View SolutionThe voltage-current (V-I) graph of a metallic conductor at two different temperature T1 and T2 is shown in figure. At which temperature is the resistance higher?
View Solution
Knowledge Check
Compressibility factor (Z) is plotted against pressure at different temperature for same gas
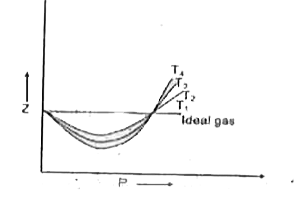 AT4>T3>T2>T1BT1>T2>T3>T4CT1>T2>T3>T4DT1>T2>T3>T4
The current (I) and voltage (V) graphs for a given metallic wire at two different temperature (T1) and (T2) are shown in fig. It is concluded that
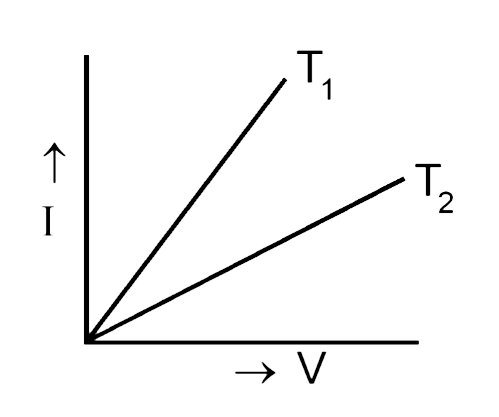 AT1=T2BT1>T2CT1<T2DNone of these
The current I and voltage V variations for a given metallic wire at tow different temperature T1andT2 are shown in the figure. Then which one of the following is correct
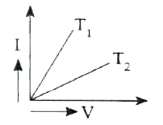 AT1>T2BT1<T2CT1=T2DT1=2T2
The graph of (xm) vs P at two different temperature T1 and T2 is [where T1>T2]
View SolutionThe current - voltage graphs for a given metallic wire at two different temperatures T1andT2 are shown in the figure.
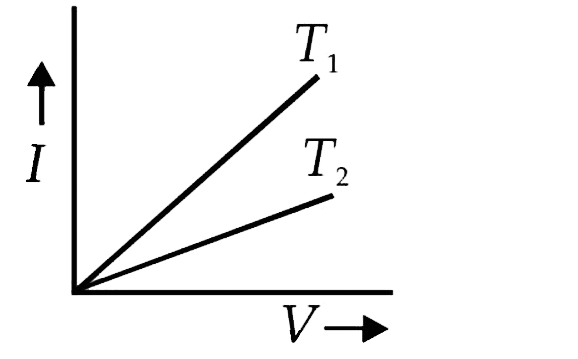
The temperature T2 is greater than T1.
View SolutionThe stress-strain graph for a metallic wire is shown at two different temperature, T1 and T2 which temperature is high T1 or T2 ?
View SolutionThe product of PV is plotted against P at two temperatures T1 and T2 and the result is shown in figure. What is correct about T1 and T2?
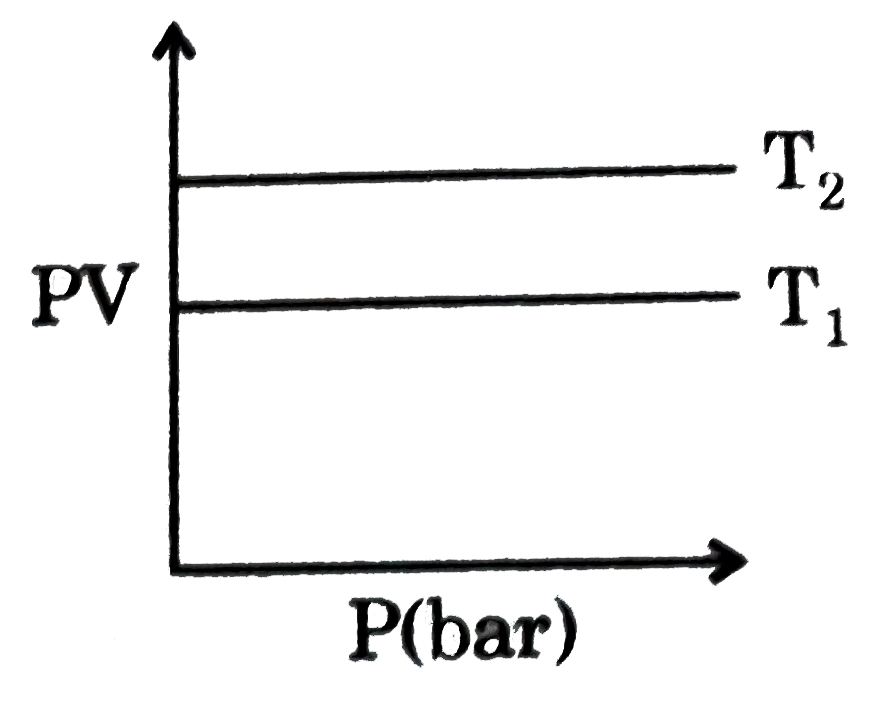
View SolutionThe voltage V and current I graph for a conductor at two different temperatures T1 and T2 are shown in the figure. The relation between T1 and T2 is
View Solution
