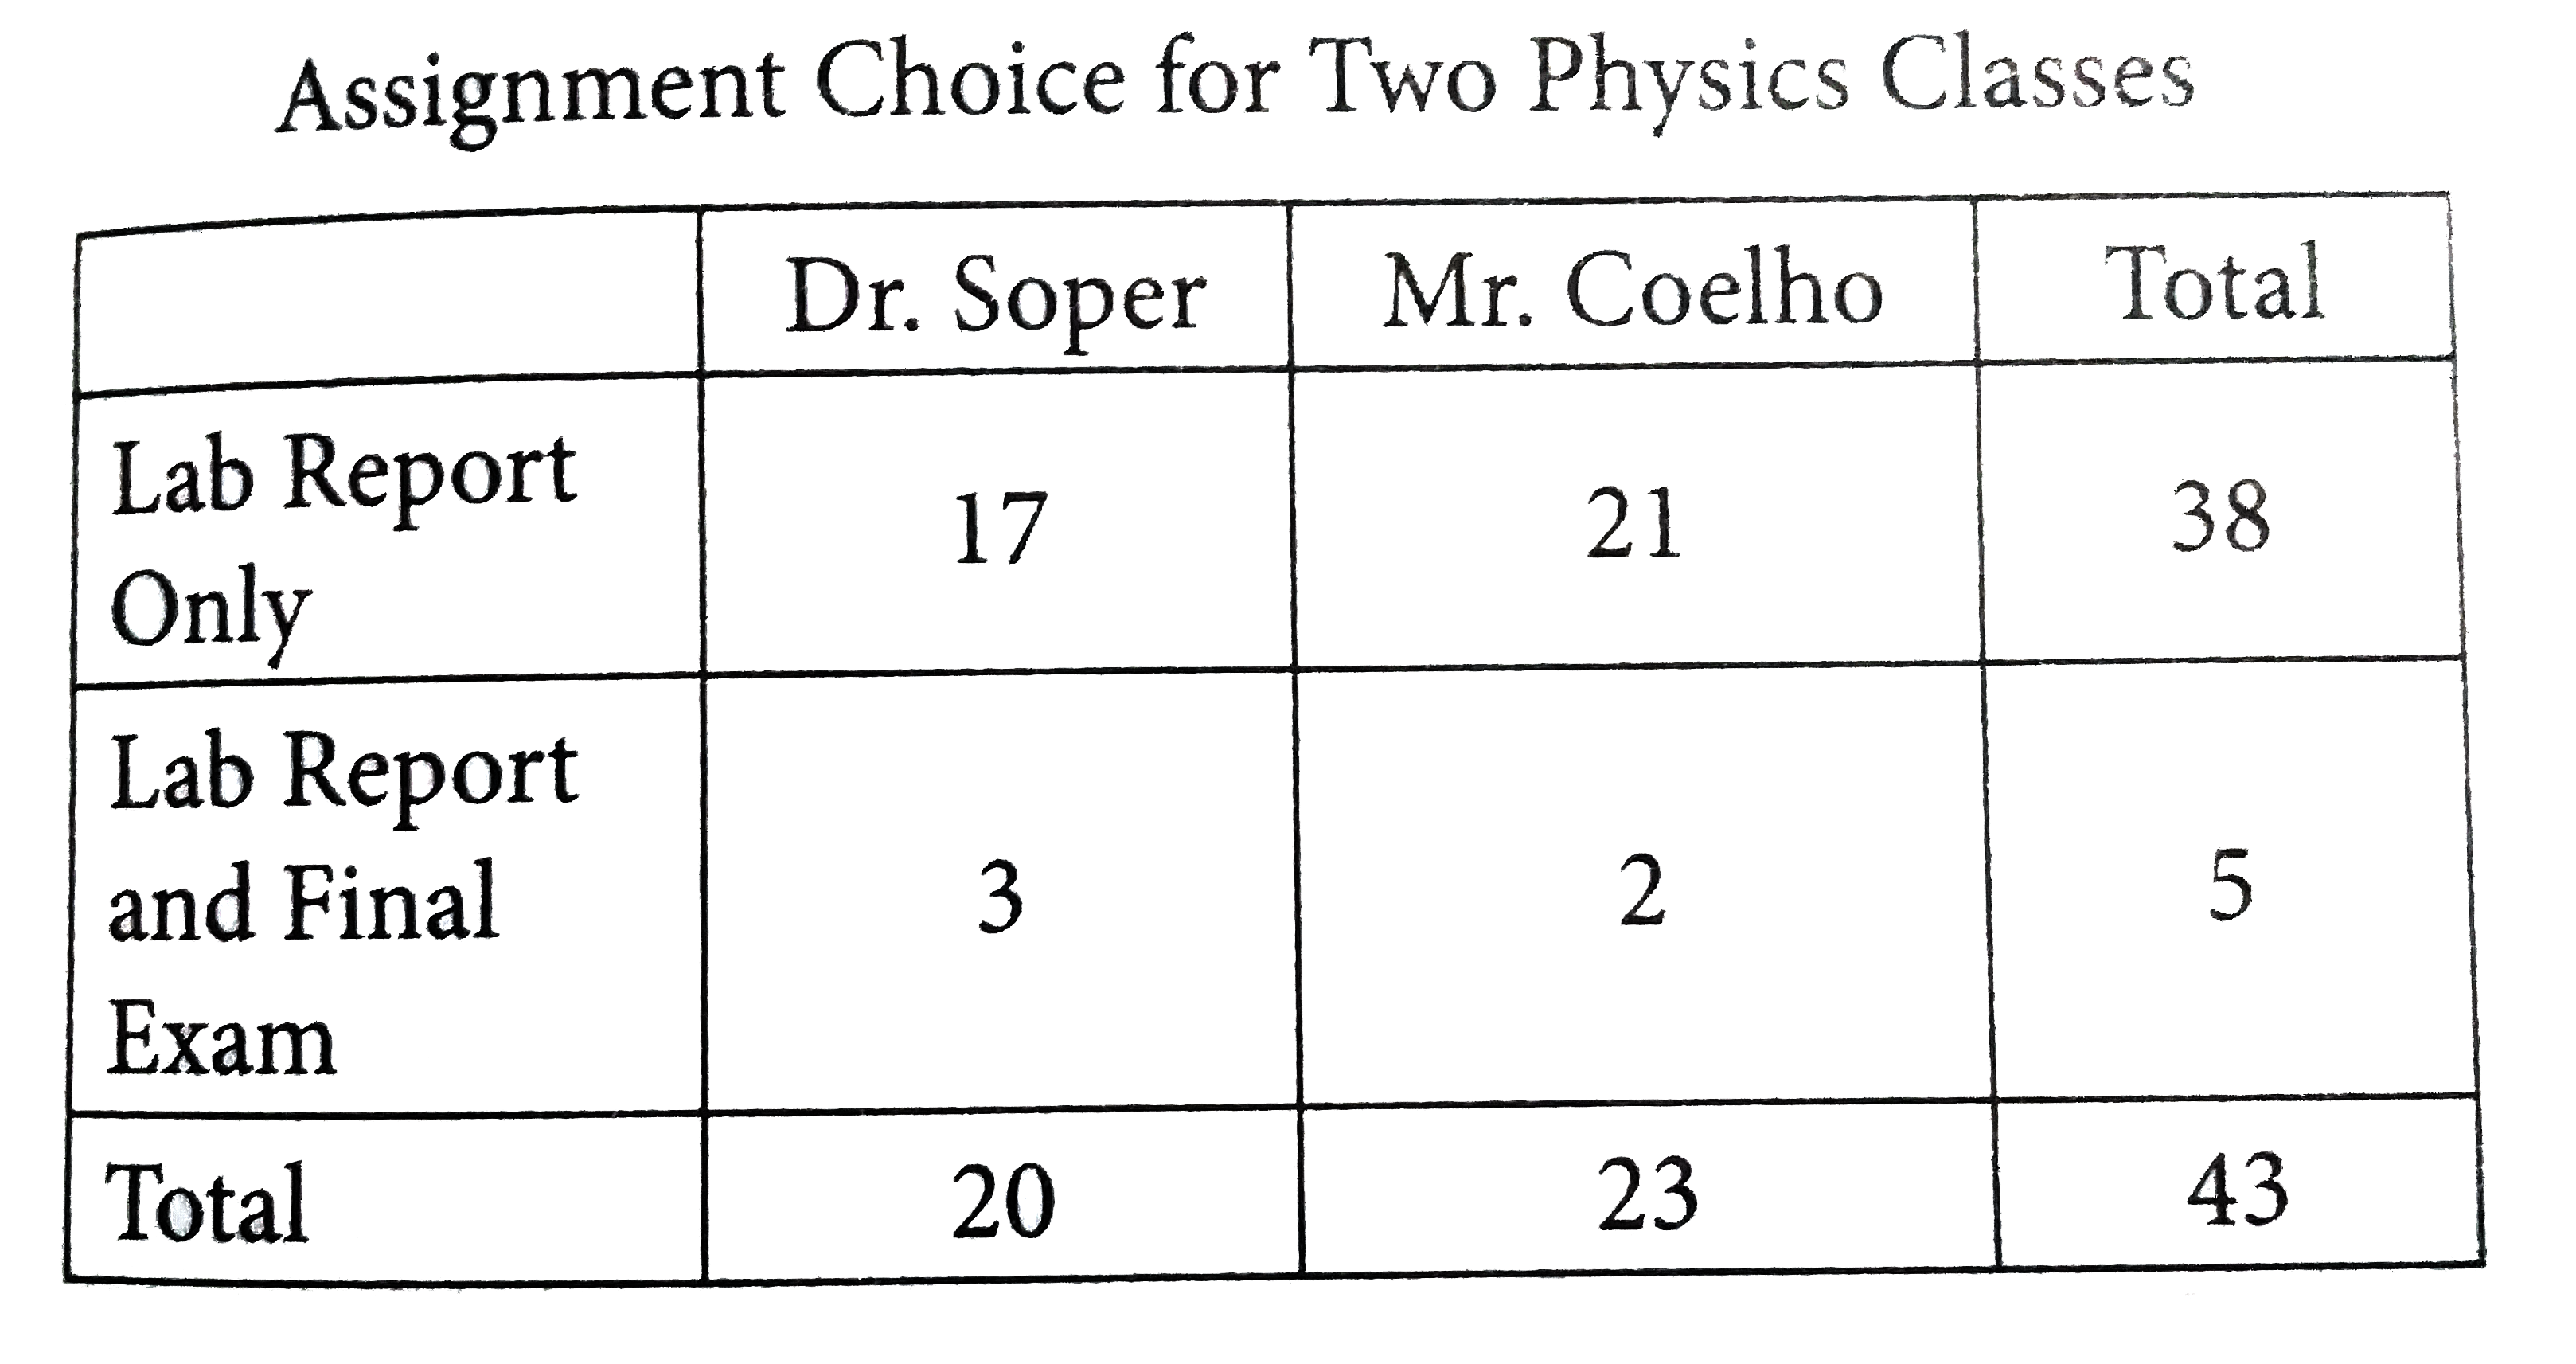
The table above shows the number of students who chose to be grated on lab reports and finals exams in Dr. Soper's and Mr. Coelho's physics classes. What fraction of the students in Dr. Soper's class chose to be graded on the lab report and final exam?
The correct Answer is:C
Step by step video, text & image solution for The table above shows the number of students who chose to be grated on lab reports and finals exams in Dr. Soper's and Mr. Coelho's physics classes. What fraction of the students in Dr. Soper's class chose to be graded on the lab report and final exam? by Maths experts to help you in doubts & scoring excellent marks in Class 12 exams.
Updated on:21/07/2023Topper's Solved these Questions
Similar Questions
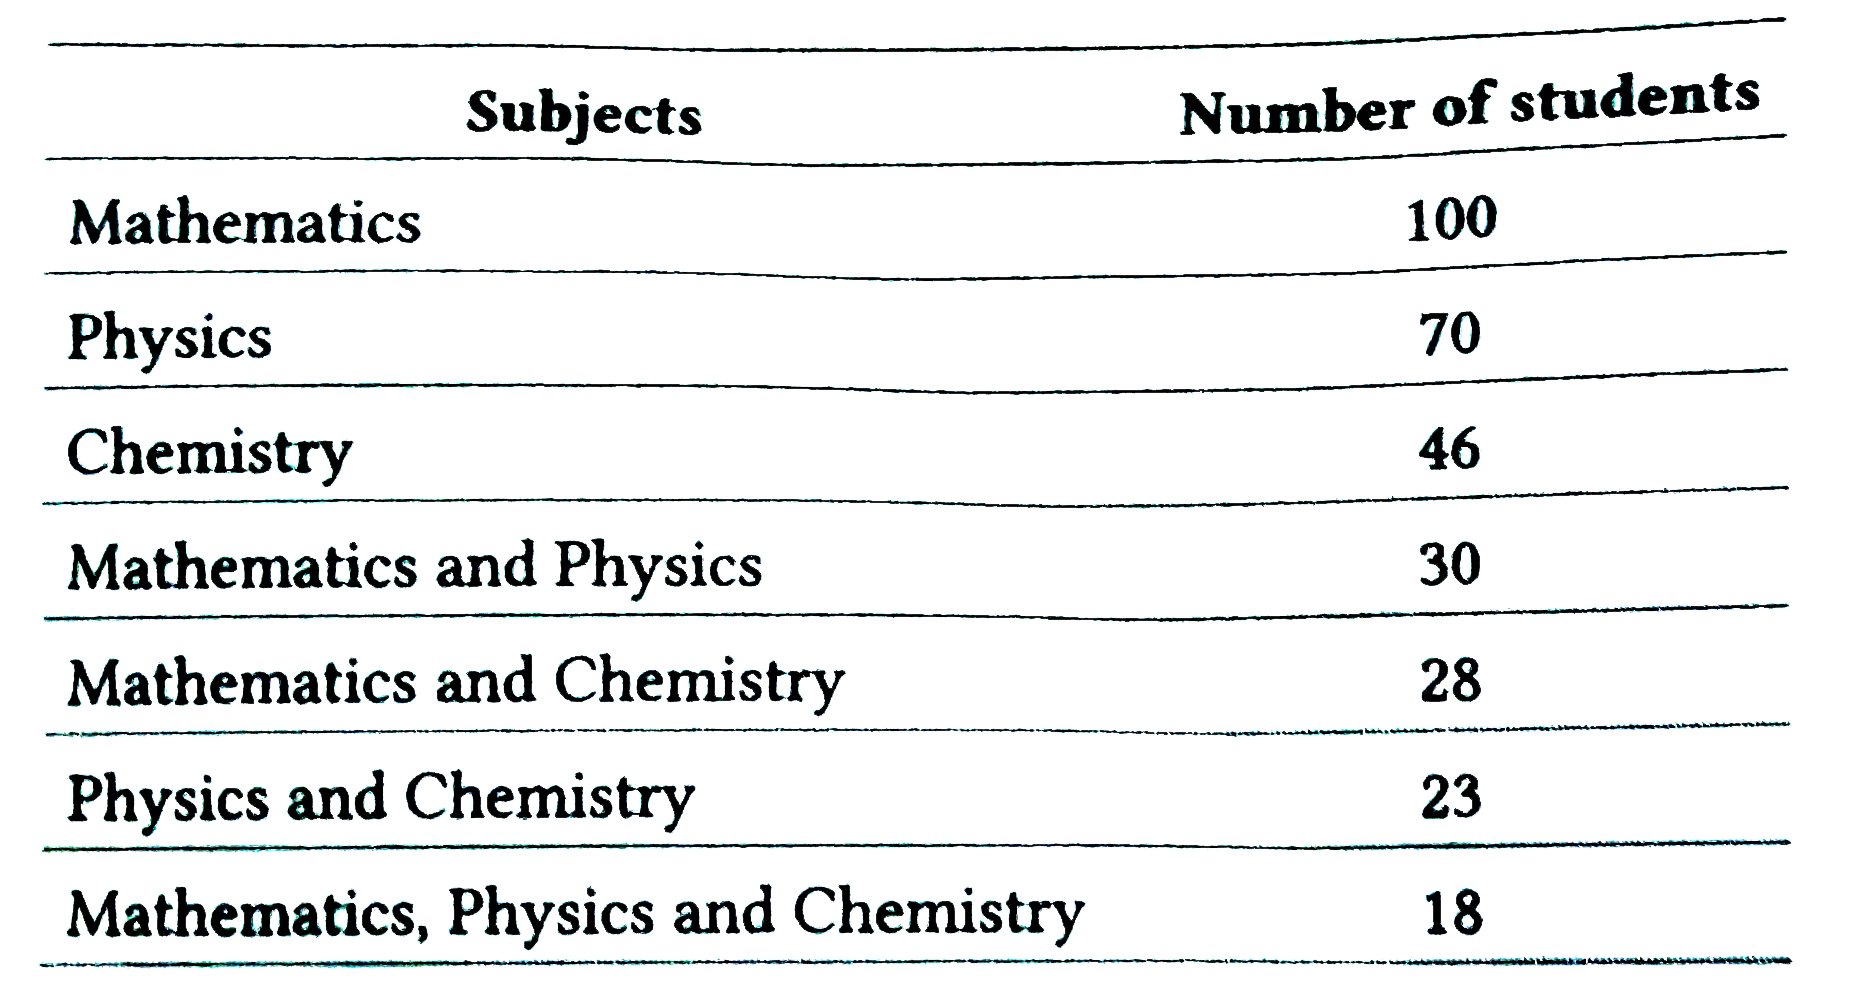
A class has 175 students. The following table shows the number of students studying one or more of the following subjects in this case.

How many students are enrolled in Mathematics alone, Physics alone and Chemistry alone? Are there students who have not offered any one of these subjects?
View SolutionIn State X,Mr. Camp’s eighth-grade class consisting of 26 students was surveyed and 34.6percent of the students reported that they had at least two siblings. The average eighth‑grade class size in the state is 26. If the students in Mr. Camp’s class are representative of students in the state’s eighth-grade classes and there are 1,800 eighth-grade classes in the state, which of the following best estimates the number of eighth‑grade students in the state who have fewer than two siblings?
View Solution
Knowledge Check

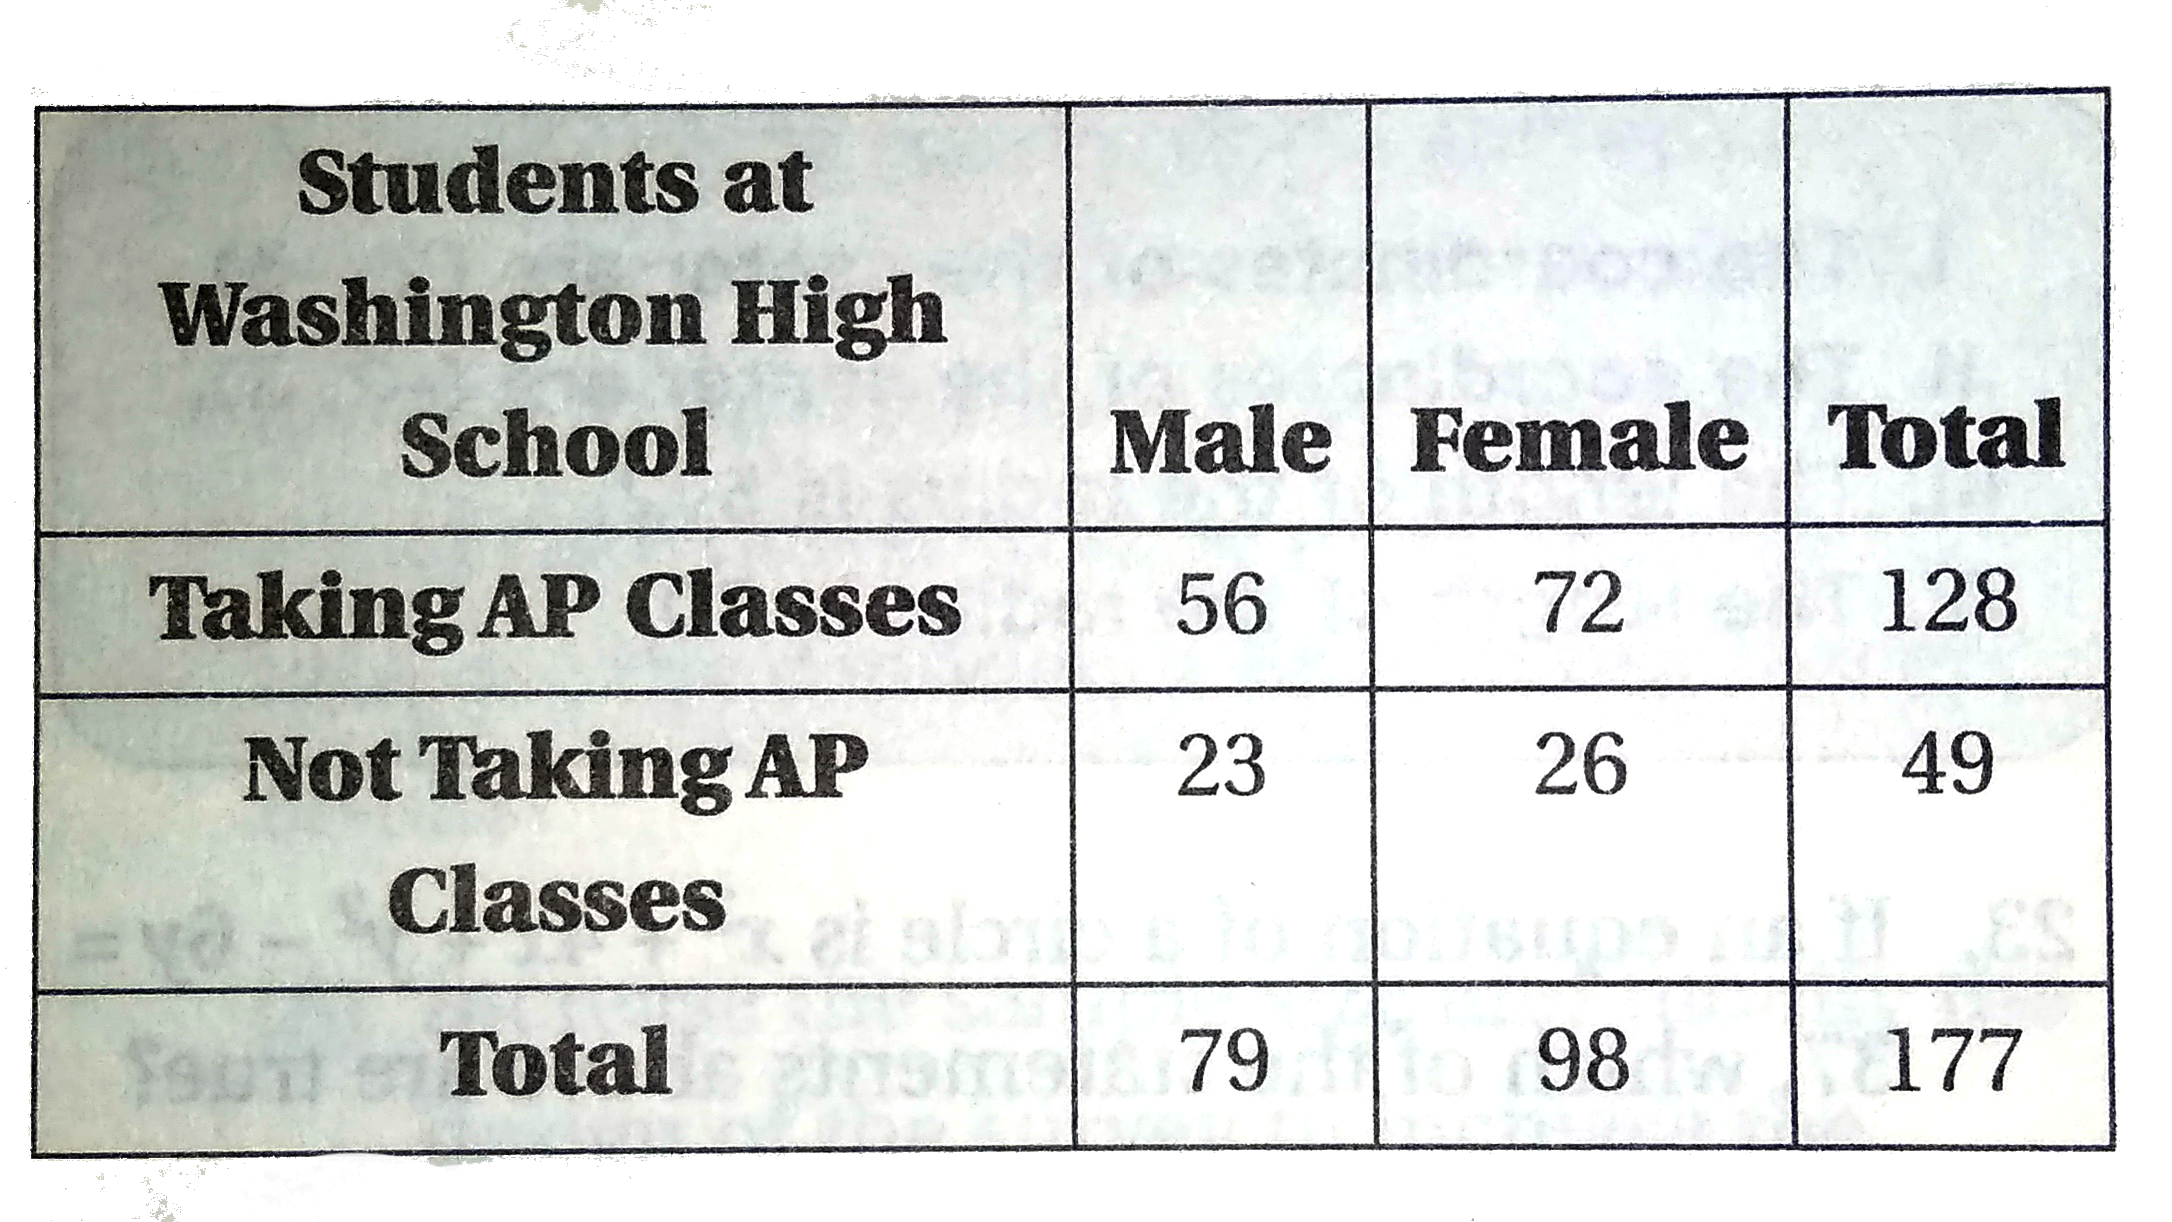
The table above gives the number of male and female students at Washington High School who are taking Advanced Placement (AP) classes and those who are not. What is the proportions of the total number of students at the school who are both male and NOT taking AP classes?A23177B79177C2349D2356Professors Lambert and Stassen teamteach an advanced psychology class. Their students recently took their final exams, and the professors are preparing to grade them. Professor Stassen predicts that, if she graded all the exams, she would take 50% more time than Professor Lambert would if he graded all the exams. They estimate that it will take them 40 hours to grade all the exams if they grade together. Which of the following equations best represents the situation described?
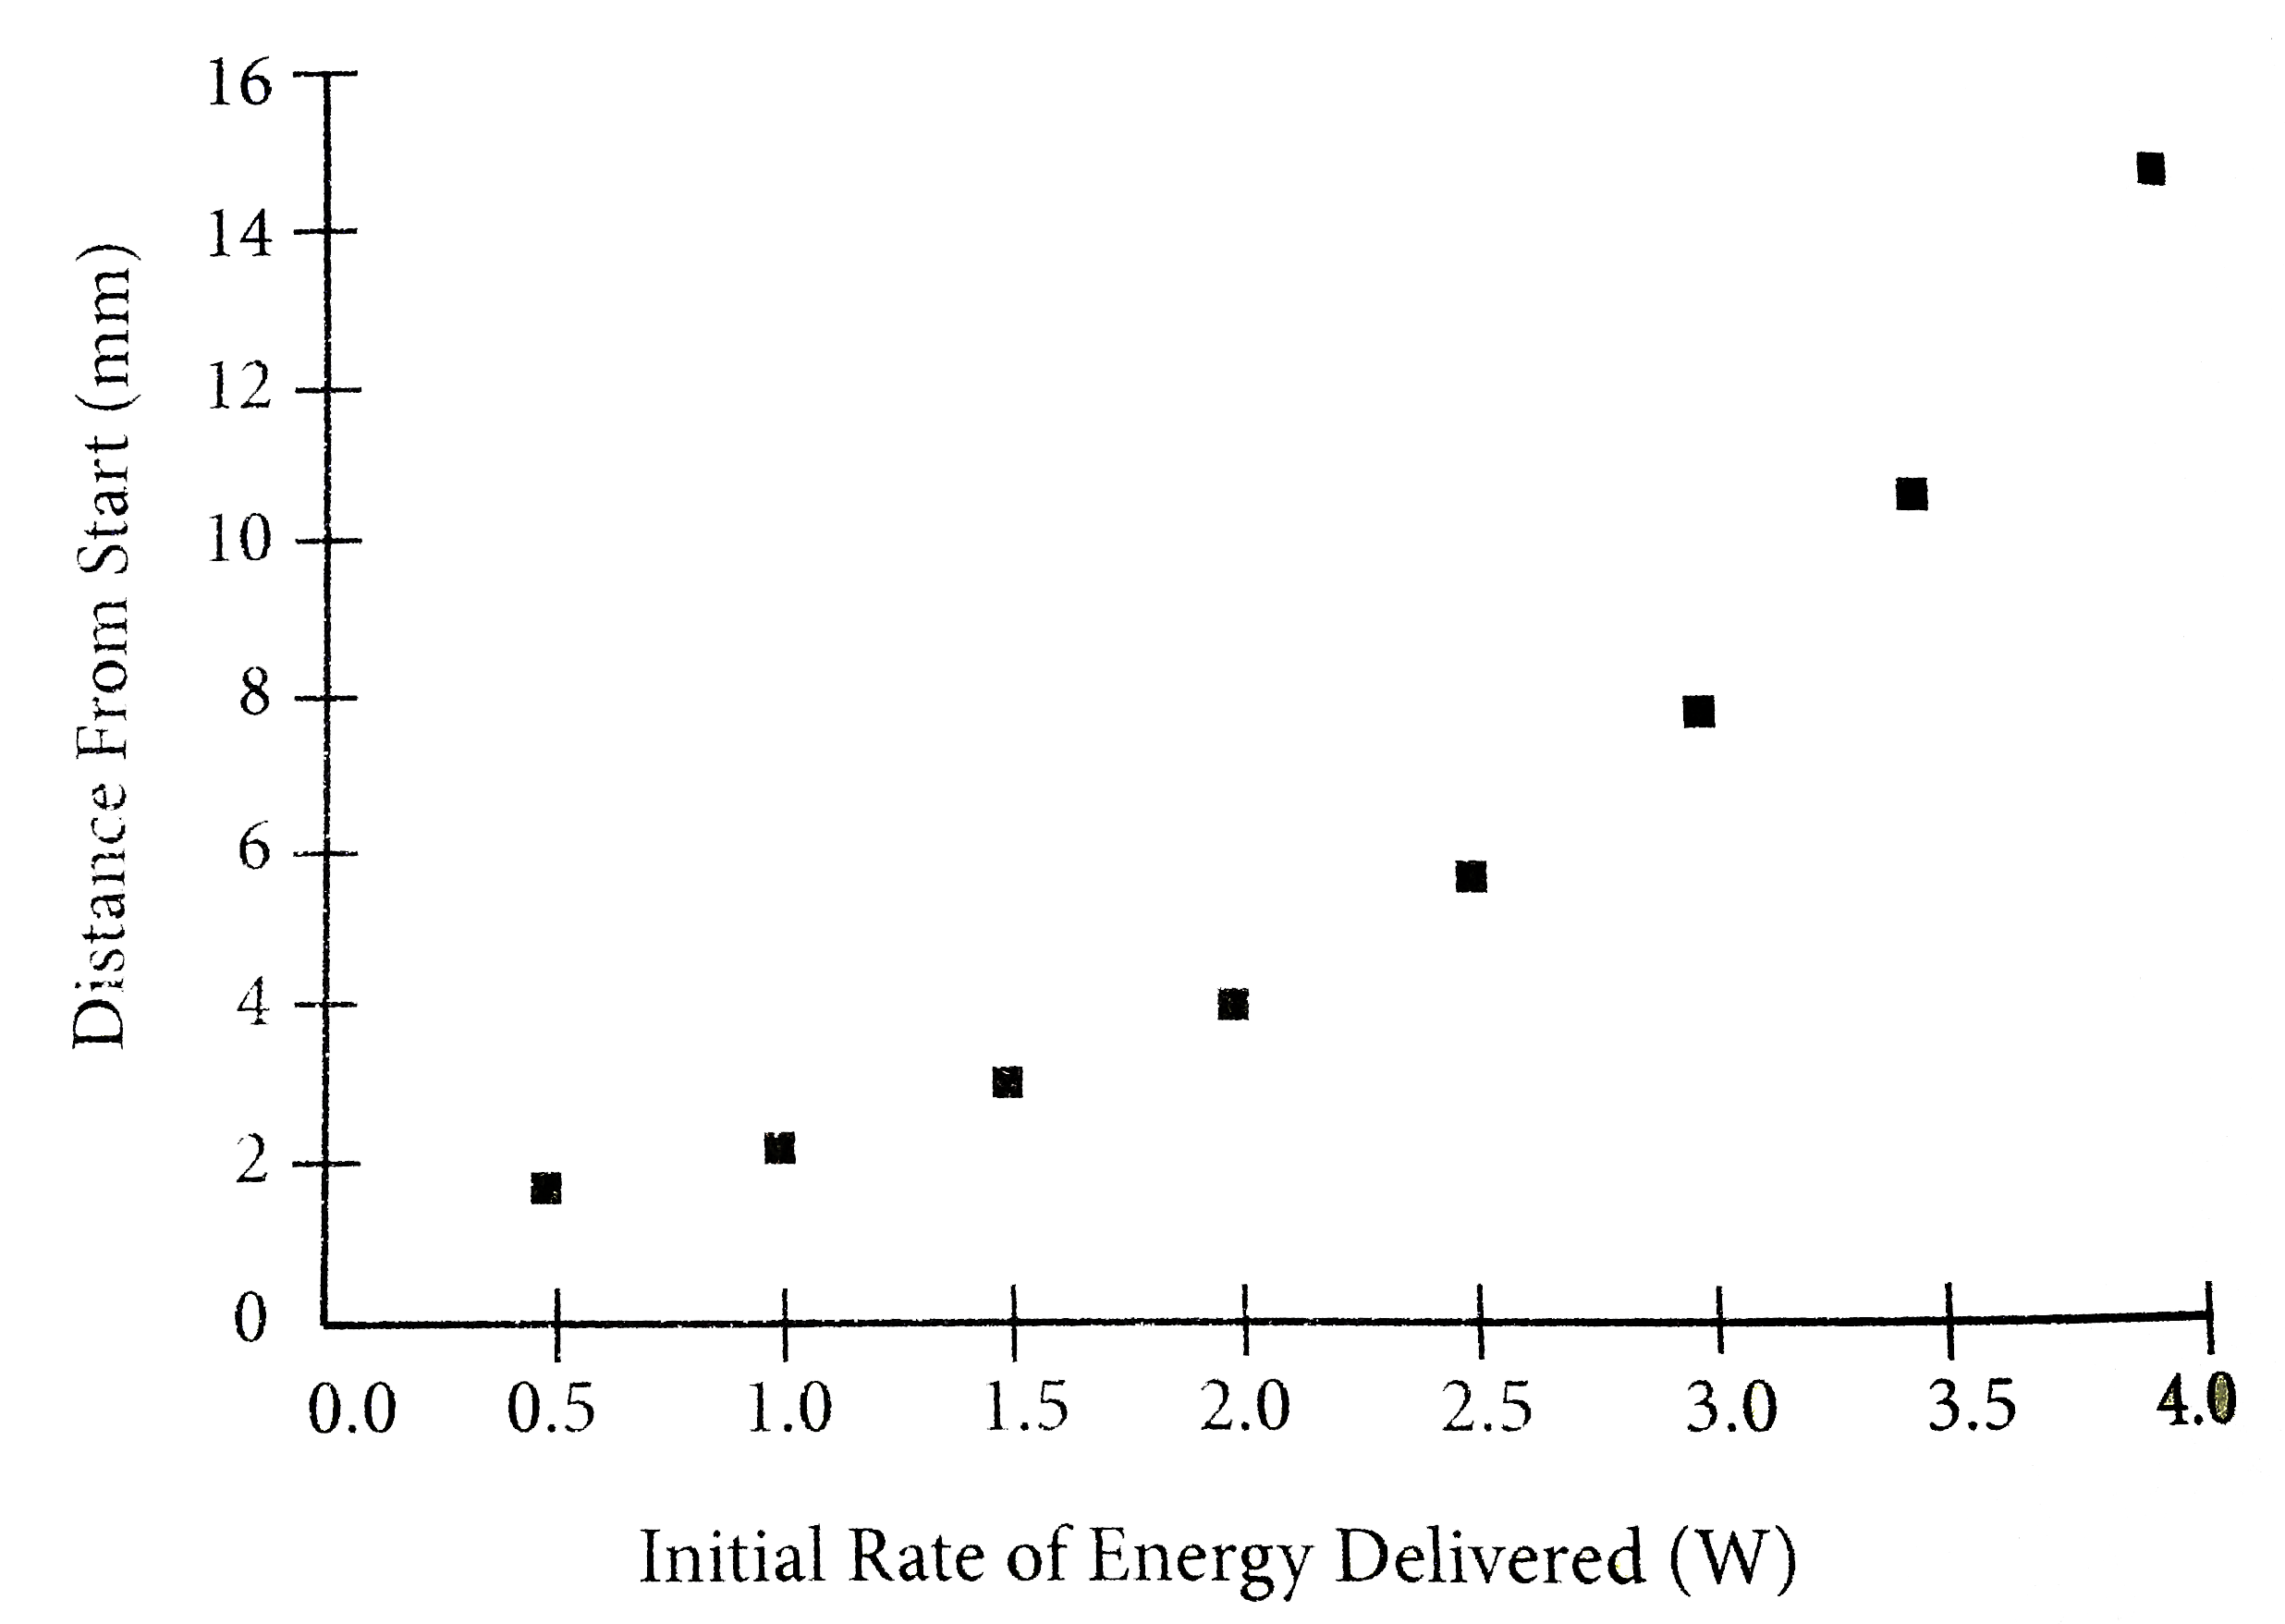
Ax+32x=40B1x+23x=140C1x+50x=140D2x+3x=140Mr. Lastorka's science class is running experiments with an energy efficient model electric car, As the initial rate of energy delivered to the car, measured in watt, increases, the number of millimeters moved by the car from its starting positions increases exponentially . The results the several trial runs are shown on the scatterplot graph below.

Based on the data, the students in Mr . Lastroka's class determine the exact equation involving Watts, x and total distance from start,y. They call the function y=f(x) over the x-axis. He challenges each student to determine the new function and what it would mean from a physics perspective. Four students pairs gave their answers below. Who is correct, and for what reasons?ACharles and Shannon, who identify the new equation as y=−2x and explain that the new graph indicates that the car is still moving forward at the same rate as beforeBMichael and Lauren, who identify and new equations as y=−2x and explain theat the new graph indicates the car is now moving in reverse at the same rate as before.CMatthew and Karen, who identify the new equations as y=−2x and explain that the new graph indicates that the car is now moving forward more rapidly than before.DAndy and Joanie, who identify the new equation as y=2−x and explain that the new graph indicates that the car is no longer moving in any direction.
