A psychology student randomly selected 300 people from a group of people who indicated that they preferred to work alone. Those 300 people were given a task to work on individually and then asked whether they were happy or unhappy while doing the task. OF those surveyed ,5% stated they are unhappy while doing the task. Which of the following inferences can appropriately be drawn from this survey result?
Few people who prefer working alone will be unhappy doing this task
Few people who do not prefer working alone will be happy doing this task
Less than 5% of people will be happy doing this task if they do not work alone
Less than 5% of people will be unhappy doing this task if they work alone.
The correct Answer is:A
Step by step video, text & image solution for A psychology student randomly selected 300 people from a group of people who indicated that they preferred to work alone. Those 300 people were given a task to work on individually and then asked whether they were happy or unhappy while doing the task. OF those surveyed ,5% stated they are unhappy while doing the task. Which of the following inferences can appropriately be drawn from this survey result? by Maths experts to help you in doubts & scoring excellent marks in Class 12 exams.
Topper's Solved these Questions
Similar Questions
A certain homeowner uses a gas edger to clean up his lawn every time he mows. If the edger uses 160 milliliters of fuel each time, what is the maximum number of times the homeowner can edge his lawn with 8 litres of fuel?( 1 liter = 1,000 milliliters)
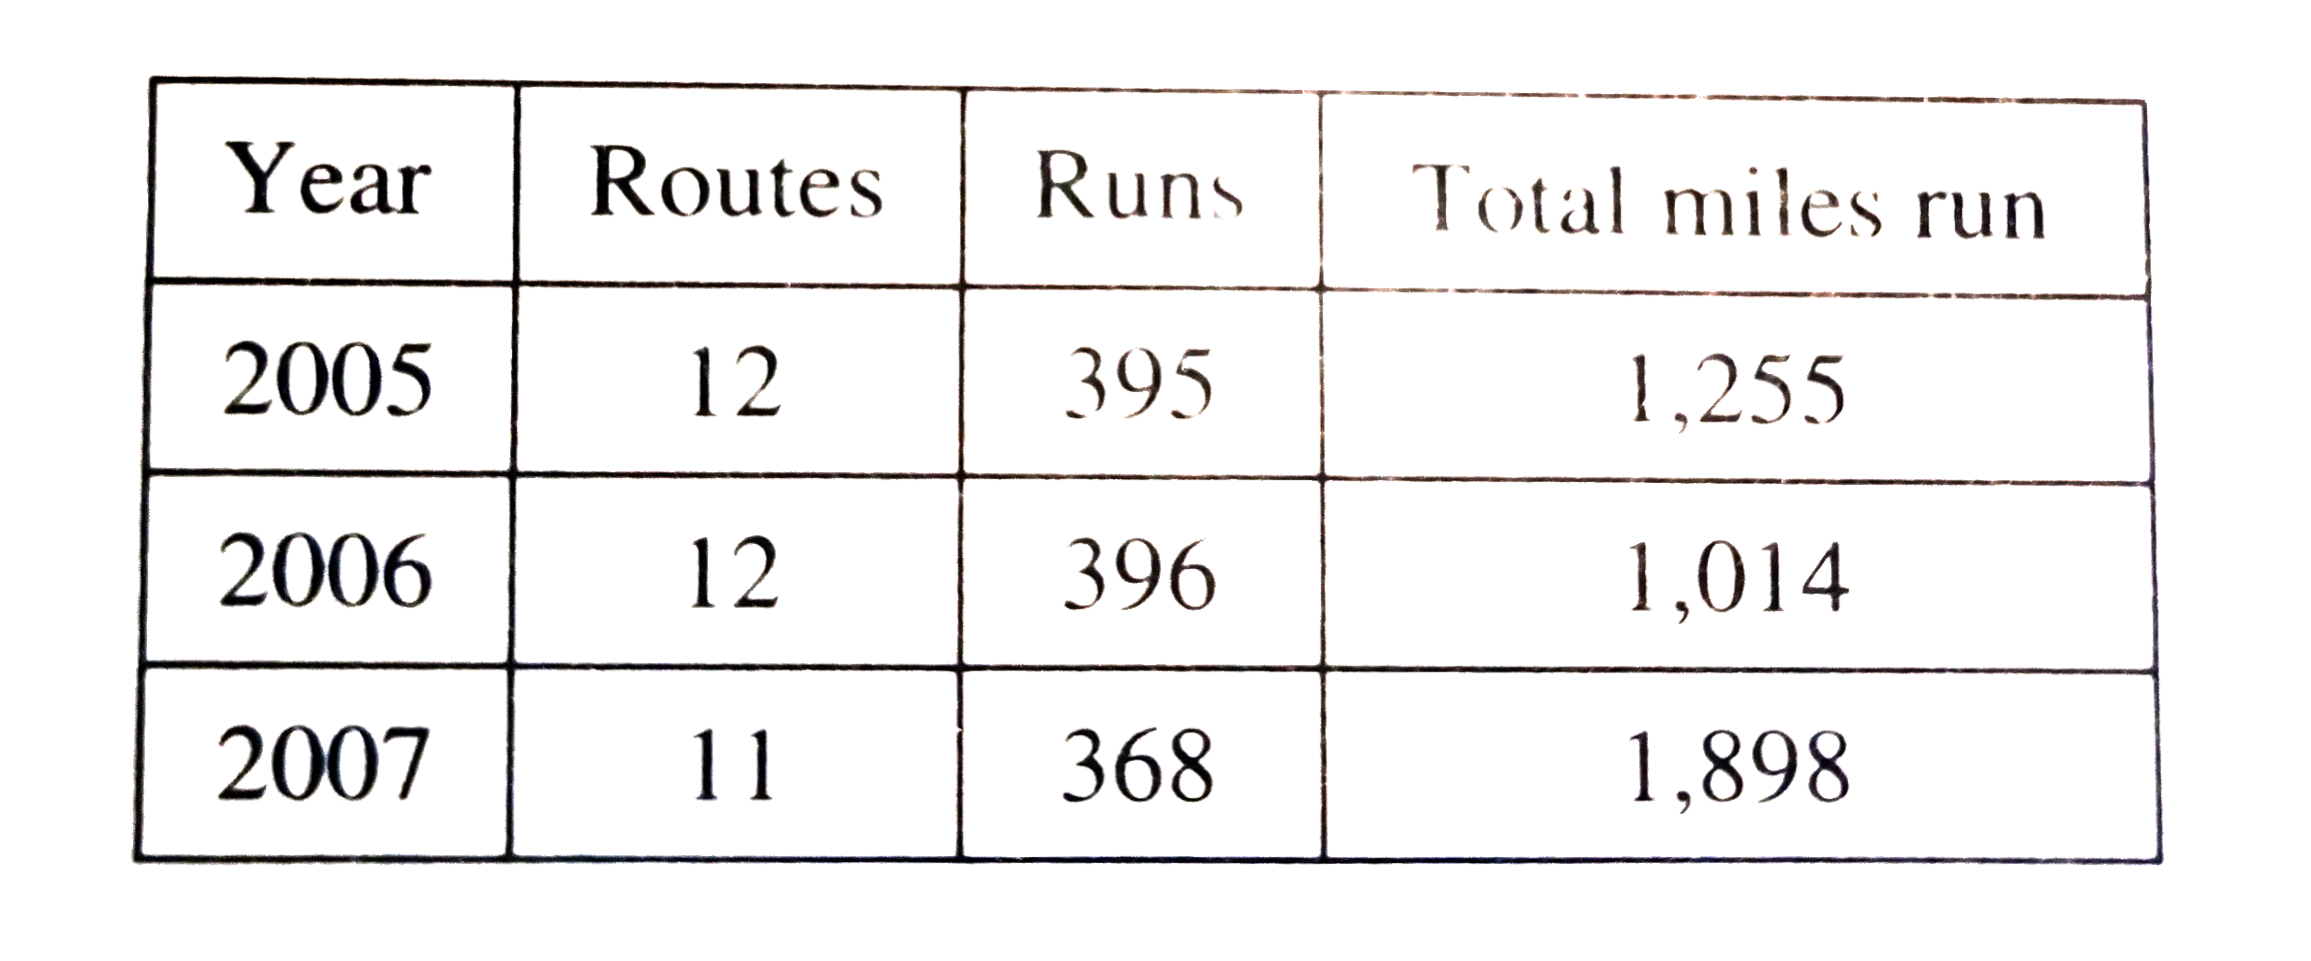
01:48View SolutionFor each of 3 years , the table below gives the number of different routes a runner ran , the number of runs she ran , and the total number of miles she ran .

To the nearest tenth of a mile , what is the average number of miles the runner ran per run in 2005 ?04:30View SolutionIF the function g is defined by g(x)=3x+5, what is the value of g(-5)?
03:08View SolutionA market researcher selected 200 people at random from a group of people who indicated that they liked a certain book. The 200 people were shown a movie based on the book and then asked whether they liked or disliked the movie. Of those surveyed, 95% said they disliked the movie. Which of the following inferences can appropriately be drawn from this survey result?
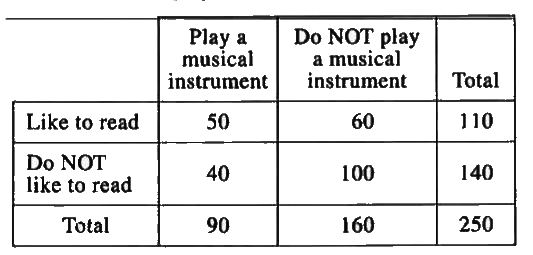
02:50View SolutionThe table below shows the results of a survey of 250 people who were asked whether they like to read and whether they play a musical instrument.

According the the results, what is the probability that a randomly selected person who was surveyed likes to read, given that the person plays a musical instrument?04:46View Solution
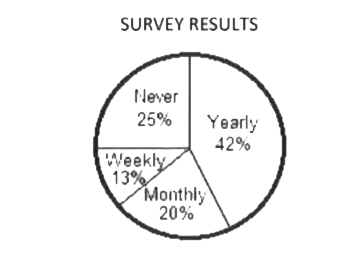
The circle graph abvoe shows the distribution of responses to a survey in which a group of people were asked how often they donate to charity. What fraction of those surveyed reported that they donate at least yearly?01:19View SolutionYou have a team of 5 people and 3 tasks to assign. Task A needs two people, Task B needs two people, and Task C needs one person. You are only going to assign one task to each person. In how many different ways can you assign the tasks?
View Solutionএকটি কাজ শেষ করতে 33 জন লোকের যতদিন লাগে 24 জন লোকের তা অপেক্ষা 6 দিন বেশি লাগে, ঐ কাজটি 44 জন লোক কত দিনে করতে পারবে?
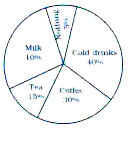
02:28View SolutionA survey was carried out to find the favorite beverage preferred by a certain group of young people. The following pie chart shows the findings of this survey. From this pie chart answer the following:

If 45 people like tea, how many people were surveyed?04:33View SolutionWhile planning a small group activity with students, which of the following should be emphasised.
A. To create a challenging task.
B. To teach students to work together.
C. To select groups thoughtfully.
D. Completion of task.01:10View SolutionWorking together A, B and C can complete a task in 12 days. A and B can do the task in 55 days and 66 days respectively if they worked alone. In how many days can C do the task if he worked alone?
01:37View SolutionIf 10 people perform a task in 15 days, calculate how long 25 people can perform that task. (Use proportions)
01:18View SolutionThis pie-chart shows the results of an online survey in which people were asked about their favorite author. The favorite author of most of the people surveyed is sports?
01:14View SolutionThis pie-chart shows the results of an online survey in which people were asked about their favorite author. What is the total number of people who responded to the survey?
01:57View SolutionThis pie-chat shows the results of an online survey in which people were asked about their favorite sport. Which is the favorite sport of the people in the survey conducted?
01:19View Solution

