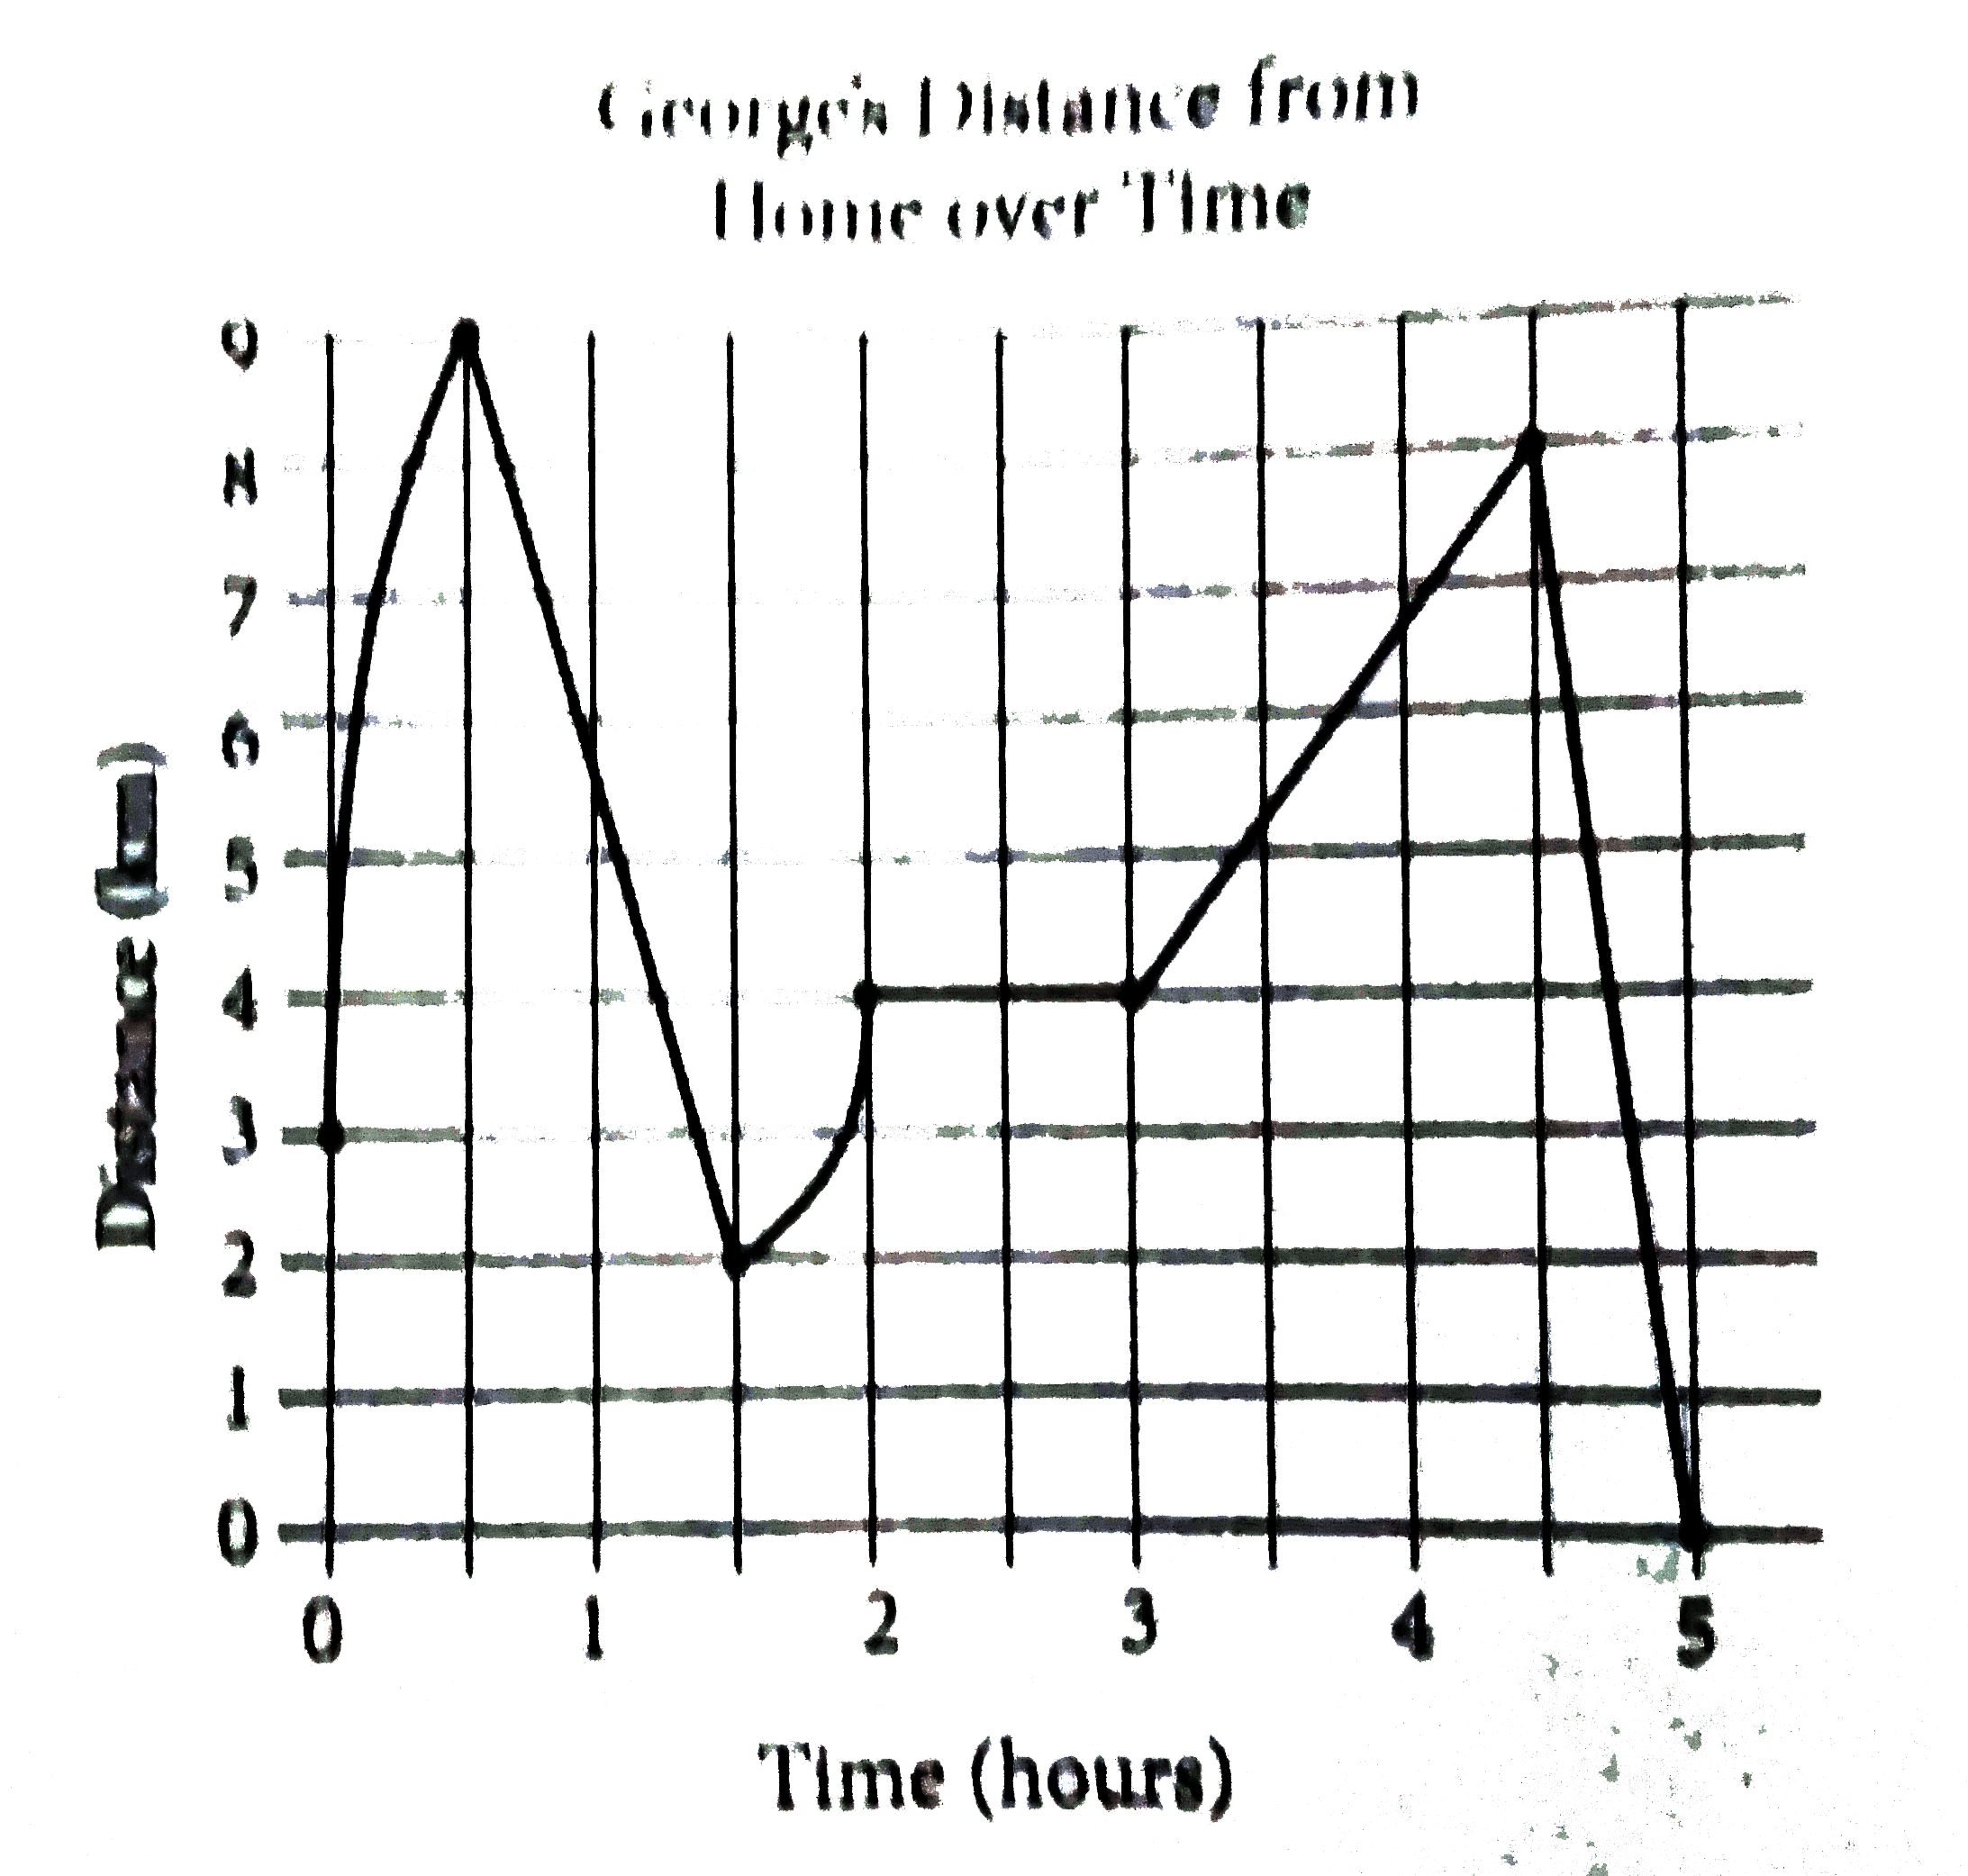
George recorded his distance from home over a five-hour period, his distance and time are shown in the graph above. According to the graph , which of the following is NOT true about the five-hour period?
George's distance from home increased at a constant rate during the first hour of the five-hour period.
George's distance from home reached its maximum during the first hour.
George remained a constant distance from his home for one hour.
George was moving further from his home for a longer period of time than he was moving closer to his home.
The correct Answer is:A
Step by step video, text & image solution for George recorded his distance from home over a five-hour period, his distance and time are shown in the graph above. According to the graph , which of the following is NOT true about the five-hour period? by Maths experts to help you in doubts & scoring excellent marks in Class 12 exams.
Topper's Solved these Questions
Similar Questions

Theresa ran on a treadmill for thirty minutes, and her time and speed are shown on the graph above. According to the graph, which of the following statements is NOT true concerning Theresa’s run?View Solution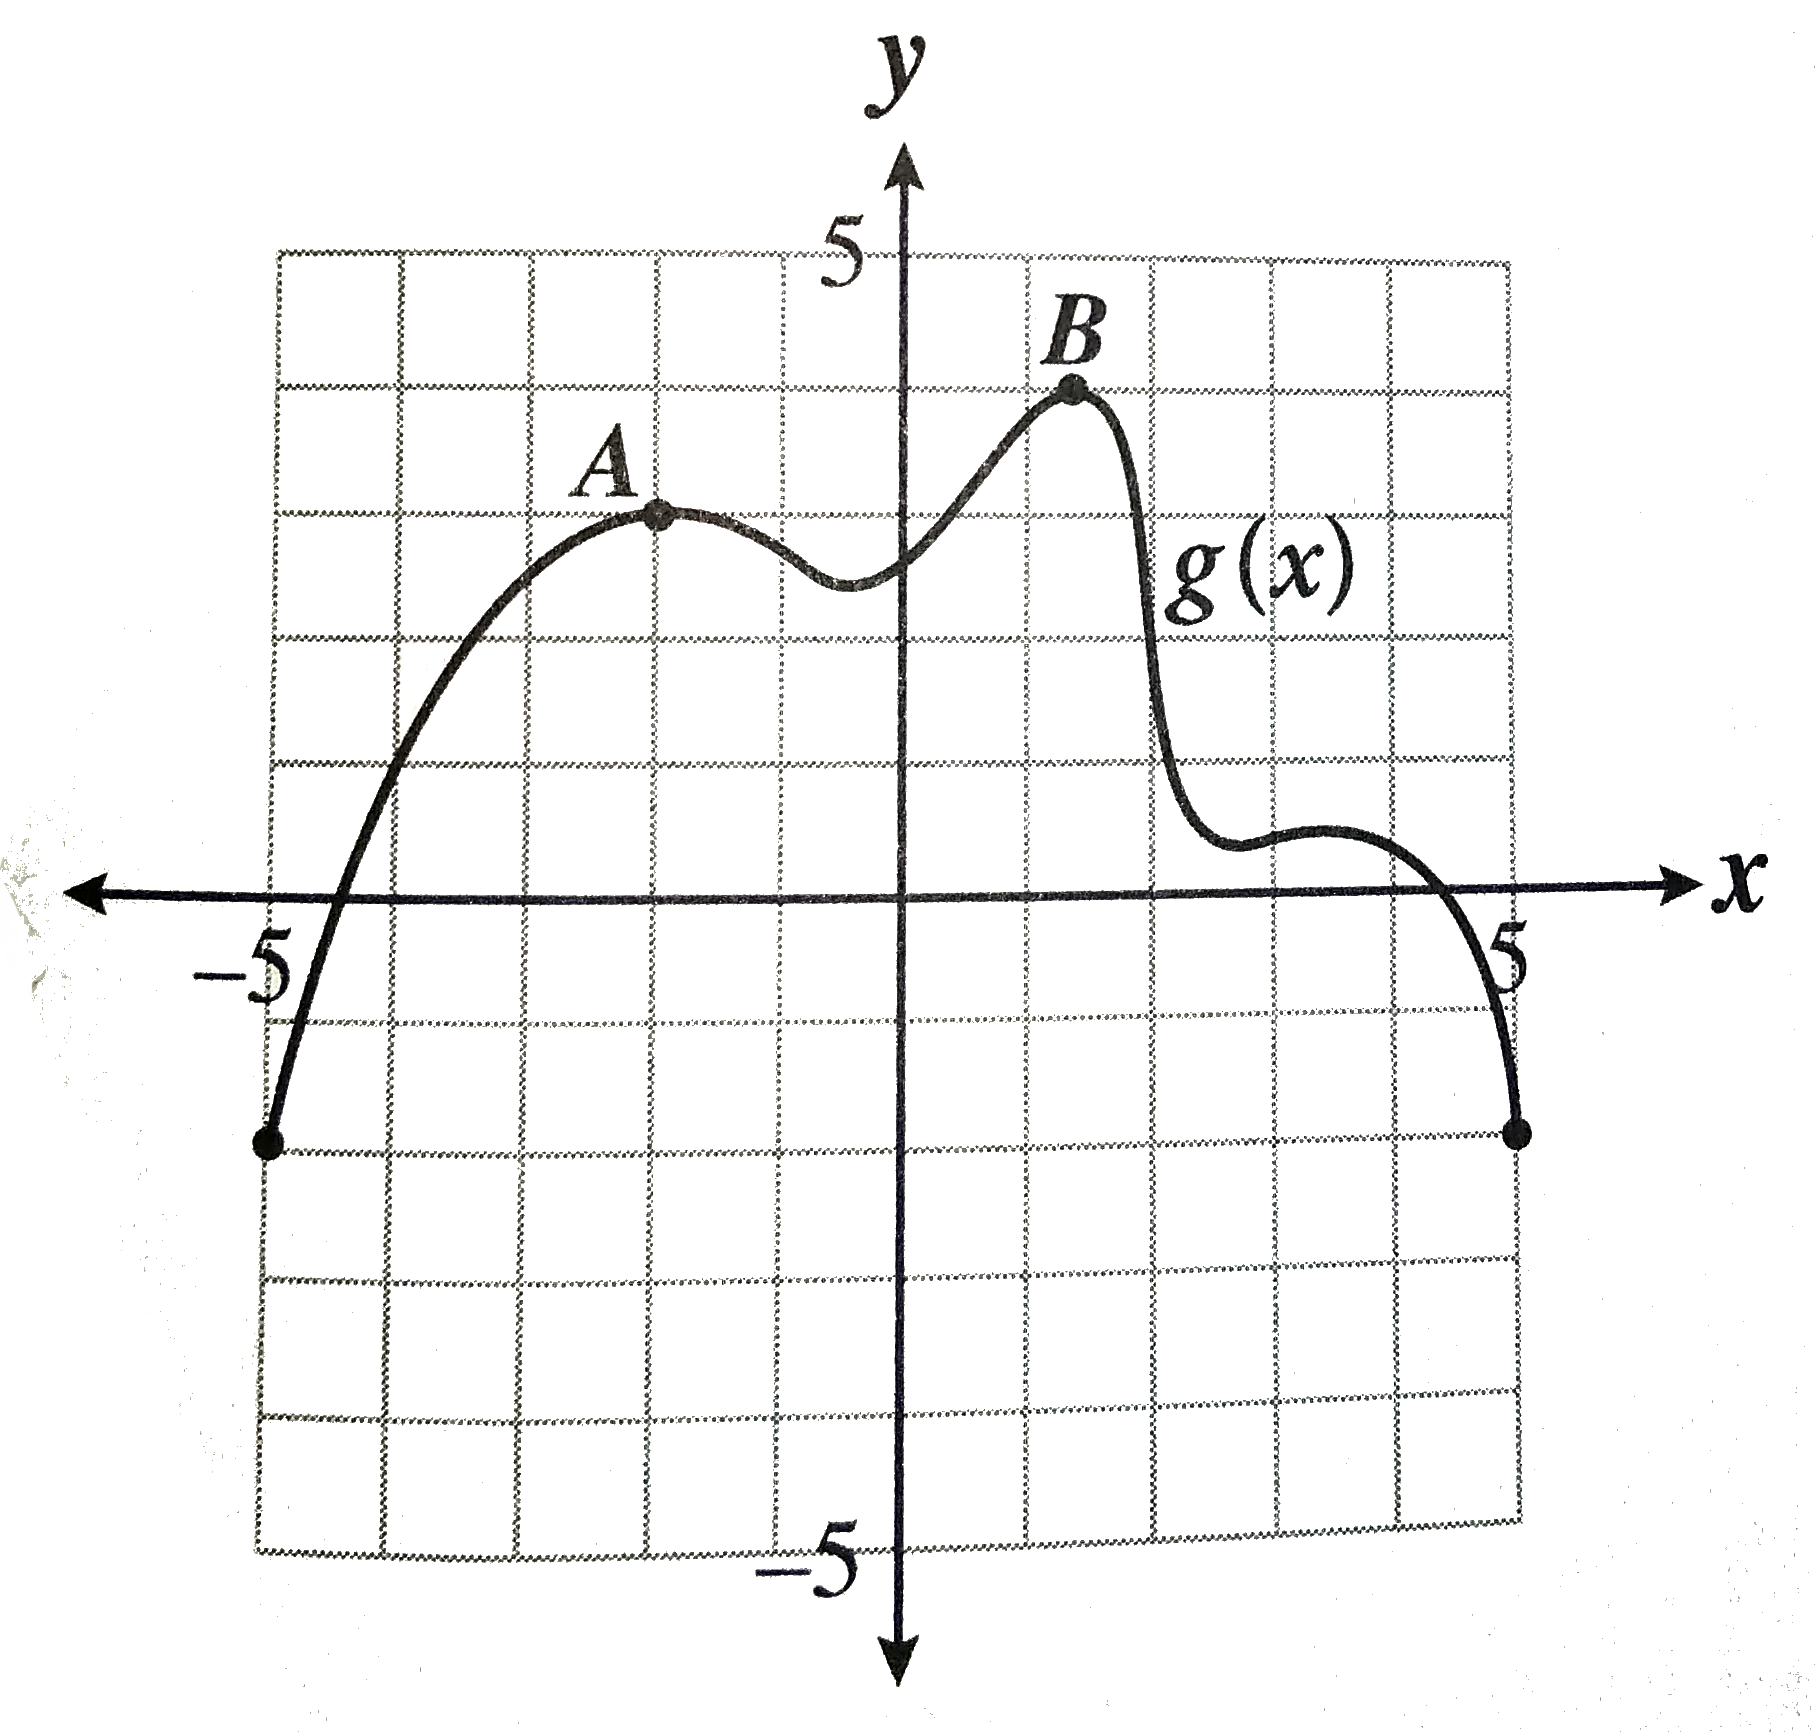
The graph of g(x) is shown in the figure above. If h(x)=−g(x)+1, which of the following statements is true?View Solution
Knowledge Check
- Question 1 - Select One
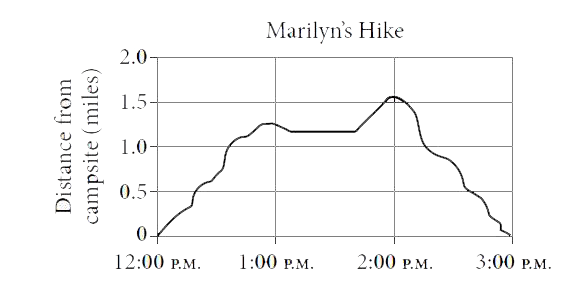
The graph above shows Marilyn’s distance from her campsite during a 3‑hour hike. She stopped for 30 minutes during her hike to have lunch. Based of the graph, which of the following is closest to the time she finished lunch and continued her hike?A12:40 pmB1:10 pmC1:40 pmD2:00 pm - Question 2 - Select One
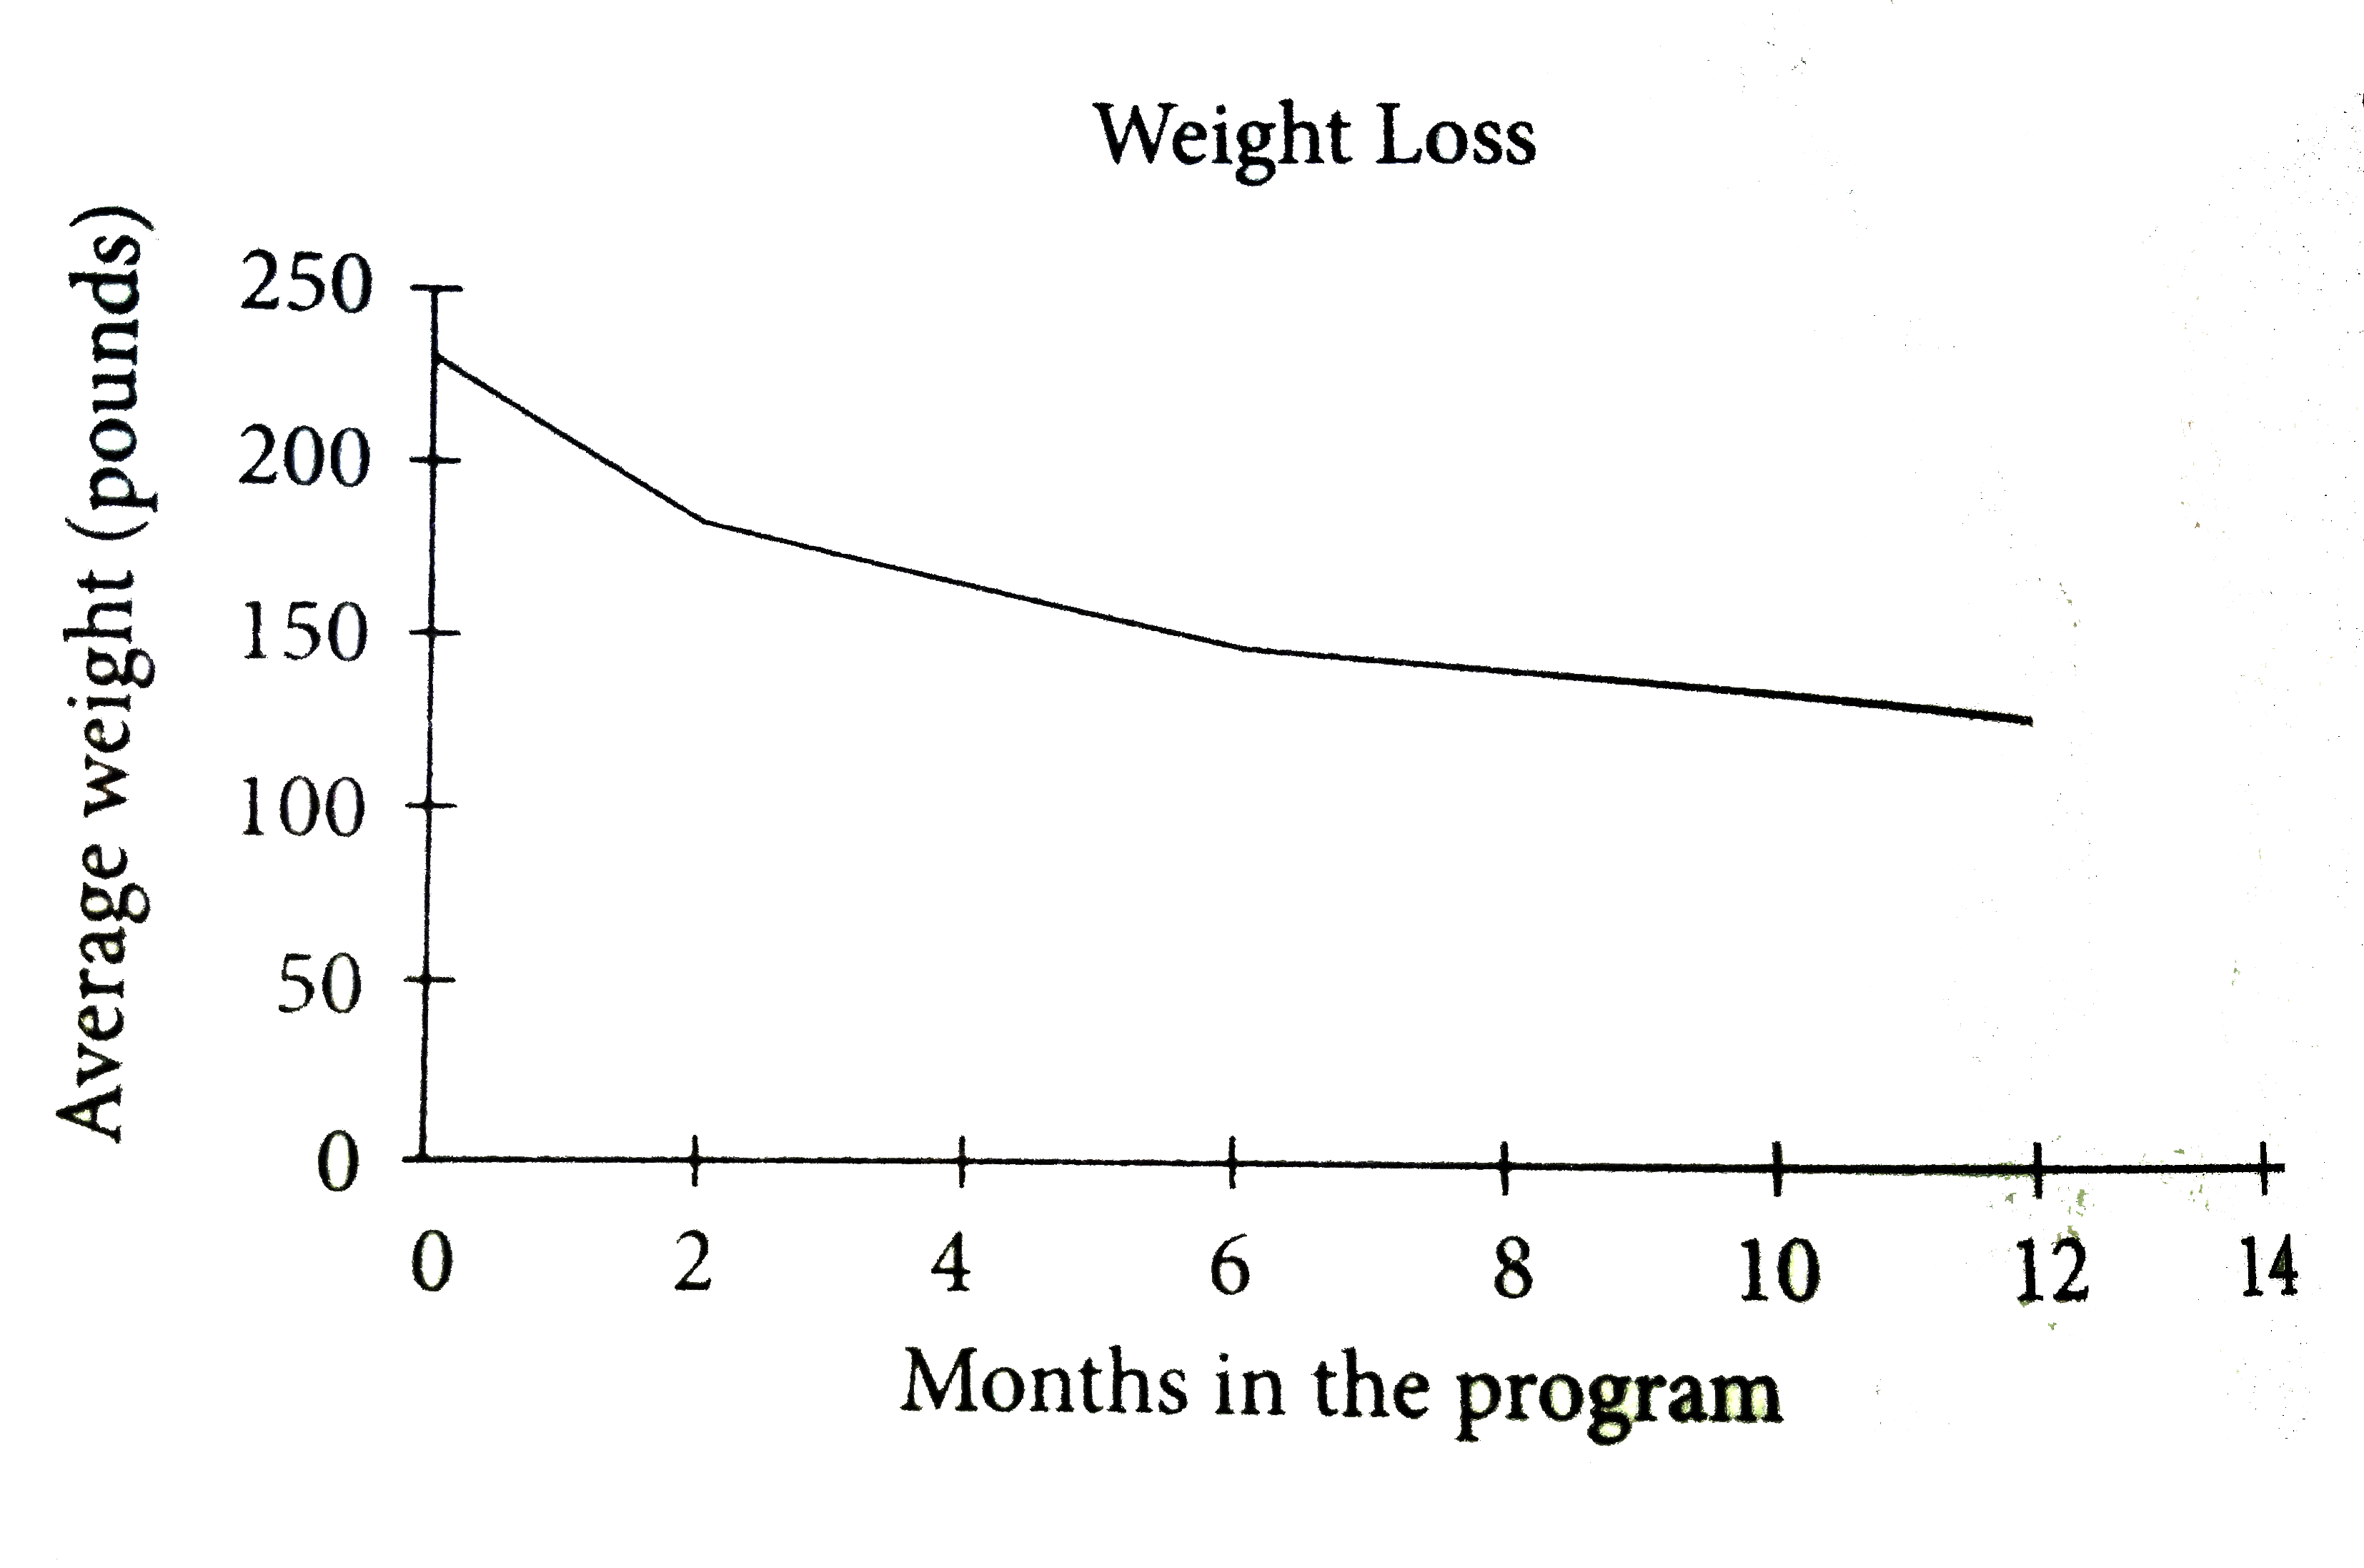
The graph above shows the average weight for the members of a weight loss program,for each month a member is in the program. According to the information in the graph, which of the following must be true?AThe average weight loss per month is the same regardless of the number of months a member is in the program.BThe average weight loss per month for members who are in the program more than 150 months is less than that for members who are in the program less than 150 months.CThe average weight loss per month for members who are in the program more than 6 months is less than that for members who are In the program less than 6 months.DThe average weight loss per month for members who are in the program more than 6 months is greater than that for members who are in the program less than 6 months. - Question 3 - Select One
y=−(x−3)2+a
In the equation above, a is a constant. The graph of the equation in the xy-plane is a parabola. Which of the following is true about the parabola?AIts minimum occurs at (−3, a).BIts minimum occurs at (3, a).CIts maximum occurs at (−3, a).DIts maximum occurs at (3, a).
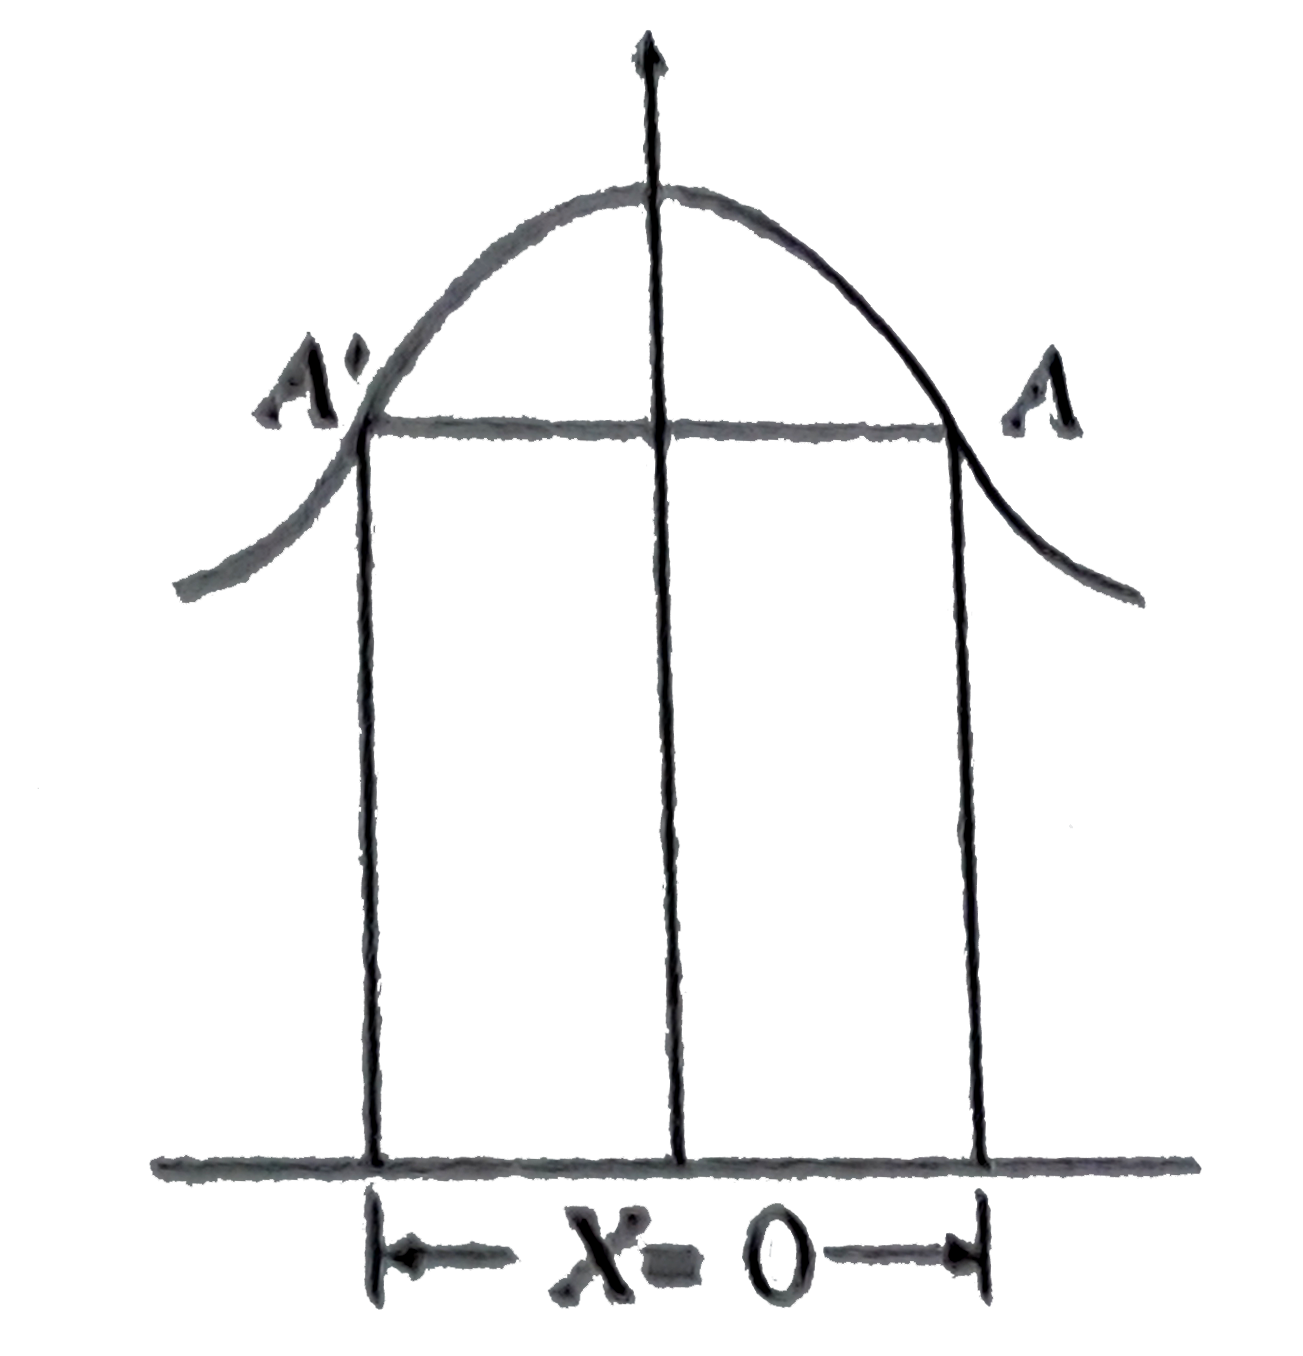
The variation of magnetic field (B) due to circular coil as the distance X varies is shown in the graph. Which of the following is false
 View Solution
Which of the following distance time graphs is possible ?
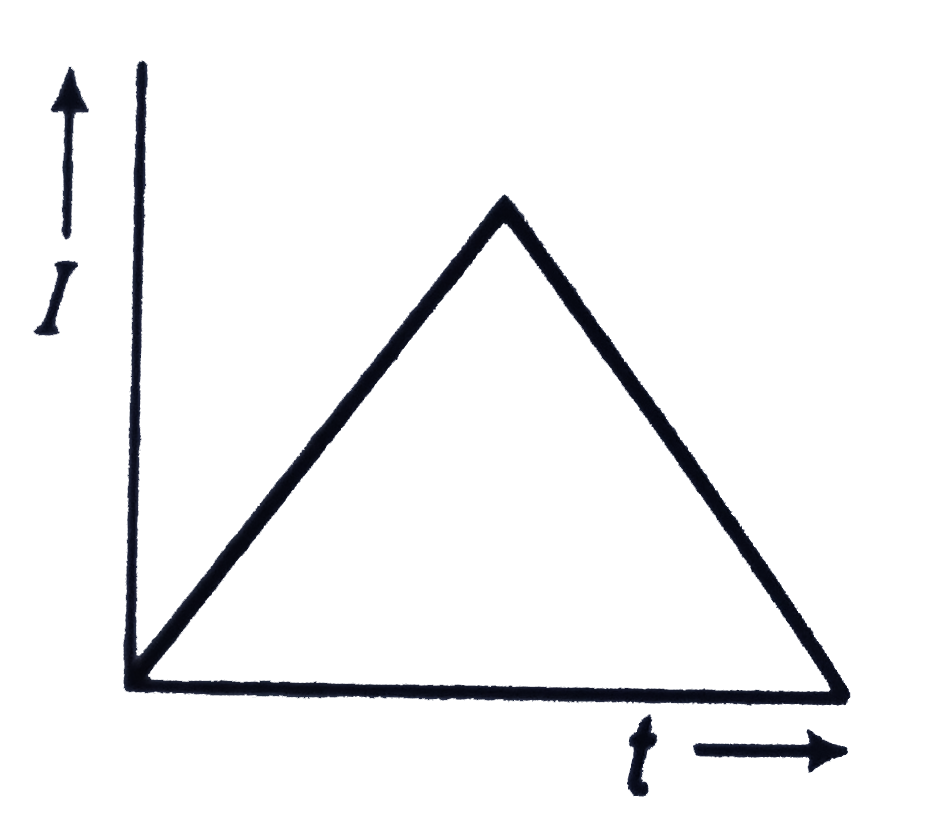
View SolutionAn alternating current I in an inductance coil varies with time t according to the graph as shown: Which one of the following graph gives the variation of voltage with time?
 View Solution
An alternating current I in an inductance coil varies with time t according to the graph as shown: Which one of the following graph gives the variation of voltage with time?
 View Solution
The current i in an induction coil varies with time according to the graph shown in figure. Which of the following graph shows induced emf in the coil with time:
View Solution

