Which one of the following is the pictorial representation of data?Solution in Bengali
raw data
bar diagram
cumulative frequency
frequency distribution
The correct Answer is:B
Step by step video, text & image solution for Which one of the following is the pictorial representation of data? by Maths experts to help you in doubts & scoring excellent marks in Class 9 exams.
Updated on:21/07/2023Topper's Solved these Questions
- FREQUENCY DISTRIBUTIONS OF GROUPED DATA BOOK - CALCUTTA BOOK HOUSECHAPTER - FREQUENCY DISTRIBUTIONS OF GROUPED DATA EXERCISE - EXAMPLES (SHORT ANSWER TYPE QUESTION)
5 Videos
- FREQUENCY DISTRIBUTIONS OF GROUPED DATA BOOK - CALCUTTA BOOK HOUSECHAPTER - FREQUENCY DISTRIBUTIONS OF GROUPED DATA EXERCISE - EXAMPLES (LONG ANSWER TYPE QUESTION)
4 Videos
- FACTORISATIONBOOK - CALCUTTA BOOK HOUSECHAPTER - FACTORISATIONEXERCISE - EXERCISE 2.4 (Long -answer type questions )
11 Videos
- GRAPHSBOOK - CALCUTTA BOOK HOUSECHAPTER - GRAPHSEXERCISE - EXERCISE - 3 Long-answer type questions
50 Videos
Similar Questions
Find the lower class-boundary of the continuous frequency distribution of which the mid-value is m and the upper class-boundary is u.
View SolutionIf A (-1, 3), B (1, -1) and C (5, 1) are the vertices of a triangle ABC, find the length of the median through A.
View SolutionFactorise : a(b2−c2)+b(c2−a2)+c(a2−b2)
View SolutionDraw the graphs of the following equations : (i) y=7
View Solution______ is a pictorial representation of Covalent bonding between the combining atoms.
View SolutionThe study related to the given below pictorial representation is

View SolutionWhich of the following are the graphical representation of the data?
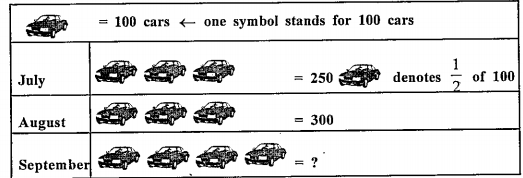
View SolutionA Pictograph : Pictorial representation of data using symbols.

How many cars were produced in the month of July?
View SolutionA Pictograph : Pictorial representation of data using symbols.

In which month were maximum number of cars produced?
View Solutionएक आकृति जो आँकड़ों को चित्ररूप में प्रदर्षित करती है, कहलाती है :
View SolutionState True or False:
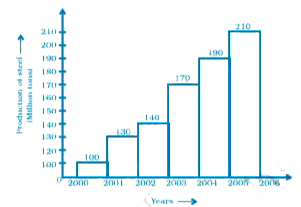
The following pictorial representation of data is a histogram.

View SolutionState whether the following statements are true or false:
A tabular form of data is also a pictorial representation of the data.
View SolutionState True or False:
Pictographs and bar graphs are pictorial representations of the numerical data.
View SolutionA pictorial representation of data using symbols to represent a group of items is called:
View SolutionA pictorial representation of data using symbols to represent a group of items is called:
View Solution
