Fill in the blanks.
A pictorial representation of grouped data in which rectangles are formed with class intervals as the bases and the corresponding frequencies at the height is known as _______.Solution in Punjabi
The correct Answer is:histogram
Step by step video, text & image solution for Fill in the blanks. A pictorial representation of grouped data in which rectangles are formed with class intervals as the bases and the corresponding frequencies at the height is known as _______. by Maths experts to help you in doubts & scoring excellent marks in Class 8 exams.
Updated on:21/07/2023Topper's Solved these Questions
- DATA HANDLING BOOK - NAND LAL PUBLICATIONCHAPTER - DATA HANDLING EXERCISE - ADDITIONAL QUESTIONS FOR PRACTICE (Short Answer Type Questions)
2 Videos
- DATA HANDLING BOOK - NAND LAL PUBLICATIONCHAPTER - DATA HANDLING EXERCISE - ADDITIONAL QUESTIONS FOR PRACTICE (Long Answer Type Questions)
14 Videos
- DATA HANDLING BOOK - NAND LAL PUBLICATIONCHAPTER - DATA HANDLING EXERCISE - EXERCISE-5.3
6 Videos
- CUBES AND CUBE ROOTSBOOK - NAND LAL PUBLICATIONCHAPTER - CUBES AND CUBE ROOTSEXERCISE - Sample Paper For Practice
18 Videos
- DIRECT AND INVERSE PROPORTIONSBOOK - NAND LAL PUBLICATIONCHAPTER - DIRECT AND INVERSE PROPORTIONSEXERCISE - SAMPLE PAPER FOR PRACTICE ( Fill in the blanks )
17 Videos
Similar Questions
Following are the numbers of members in 25 familles of a village 7, 9, 8, 8, 7, 6, 4, 3, 7, 9, 8, 8, 5, 4, 7, 7, 7, 8, 6, 5, 4, 4, 3, 6, 5
Prepare a frequency distribution table for the data using class intervals 0-3, 3-6............so on.
View SolutionDraw a pie chart for the following data. Number of students studying languages in a school.

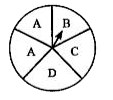
View SolutionList the outcomes you can see in the these experiments :
(a) Spinning a wheel
(b) Tossing two coins together

View SolutionCube of a natural number 5 will end with the digit
View SolutionSpeed of moving objects varies inversely to the ________ to cover a certain distance.
View SolutionIn a histogram, each class rectangle is constructed with base as frequency (b) class intervals range (d) size of the class
View SolutionHistogram a histogram or frequency histogram is a graphical representation of a frequency distribution in the form of rectangles with class intervals as bases and heights proportional to corresponding frequencies such there is no gap between any two successive rectangles.
View SolutionDefine the following terms:
(i) Observations
(ii) Raw data
(iii) Frequency of an observation
(iv) Frequency distribution
(v) Discrete frequency distribution
(vi) Grouped frequency distribution
(vii) Class-interval
(viii) Class-size
(ix) Class limits
(x) True class limits
View SolutionWhich one of the following is the pictorial representation of data?
View SolutionA histogram is a pictorial representation of the grouped data in which class intervals and frequency are respectively taken along
(a) vertical axis and horizontal axis
(b) vertical axis only
(c) horizontal axis only
(d) horizontal axis and vertical axis.
View SolutionIn a histogram, each class rectangle is constructed with base as frequency (b) class intervals range (d) size of the class
View SolutionForm a grouped frequency distribution from the following data by inclusive method taking 4as the magnitude of class intervals. 31,23,19,29,22,20,16,10,13,34,38,33,28,21,15,18,36,24,18,15, 12,30,27,23,20,17,14,32,16,25,18,29,24,19,16,11,22,15,17,10
View SolutionIntroduction|| Collection OF Data||Primary and Secondary Data|| classes|| Class interval|| Class size ( range )|| Presentation OF Group data & Single data ( ungrouped data )||Tally mark||Frequency distribution table
View Solutionएक आकृति जो आँकड़ों को चित्ररूप में प्रदर्षित करती है, कहलाती है :
View SolutionState True or False:
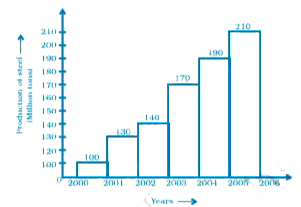
The following pictorial representation of data is a histogram.

View Solution
