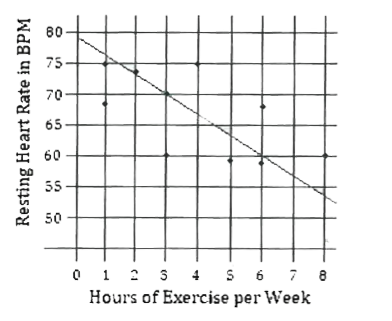
Ten 25 - years - old men were asked how many hours per week they exercise and their resting heart rate was taken in beats per minute (BPM). The results are shown as points in the scatterplot above, and the line of best fit is drawn. What is the resting heart rate, in BPM, of the men represented by the data point that is farthest from the line of best fit?
60
66
67
75
The correct Answer is:A
Step by step video, text & image solution for Ten 25 - years - old men were asked how many hours per week they exercise and their resting heart rate was taken in beats per minute (BPM). The results are shown as points in the scatterplot above, and the line of best fit is drawn. What is the resting heart rate, in BPM, of the men represented by the data point that is farthest from the line of best fit? by Maths experts to help you in doubts & scoring excellent marks in Class 12 exams.
Similar Questions
What is heart rate ?
View Solution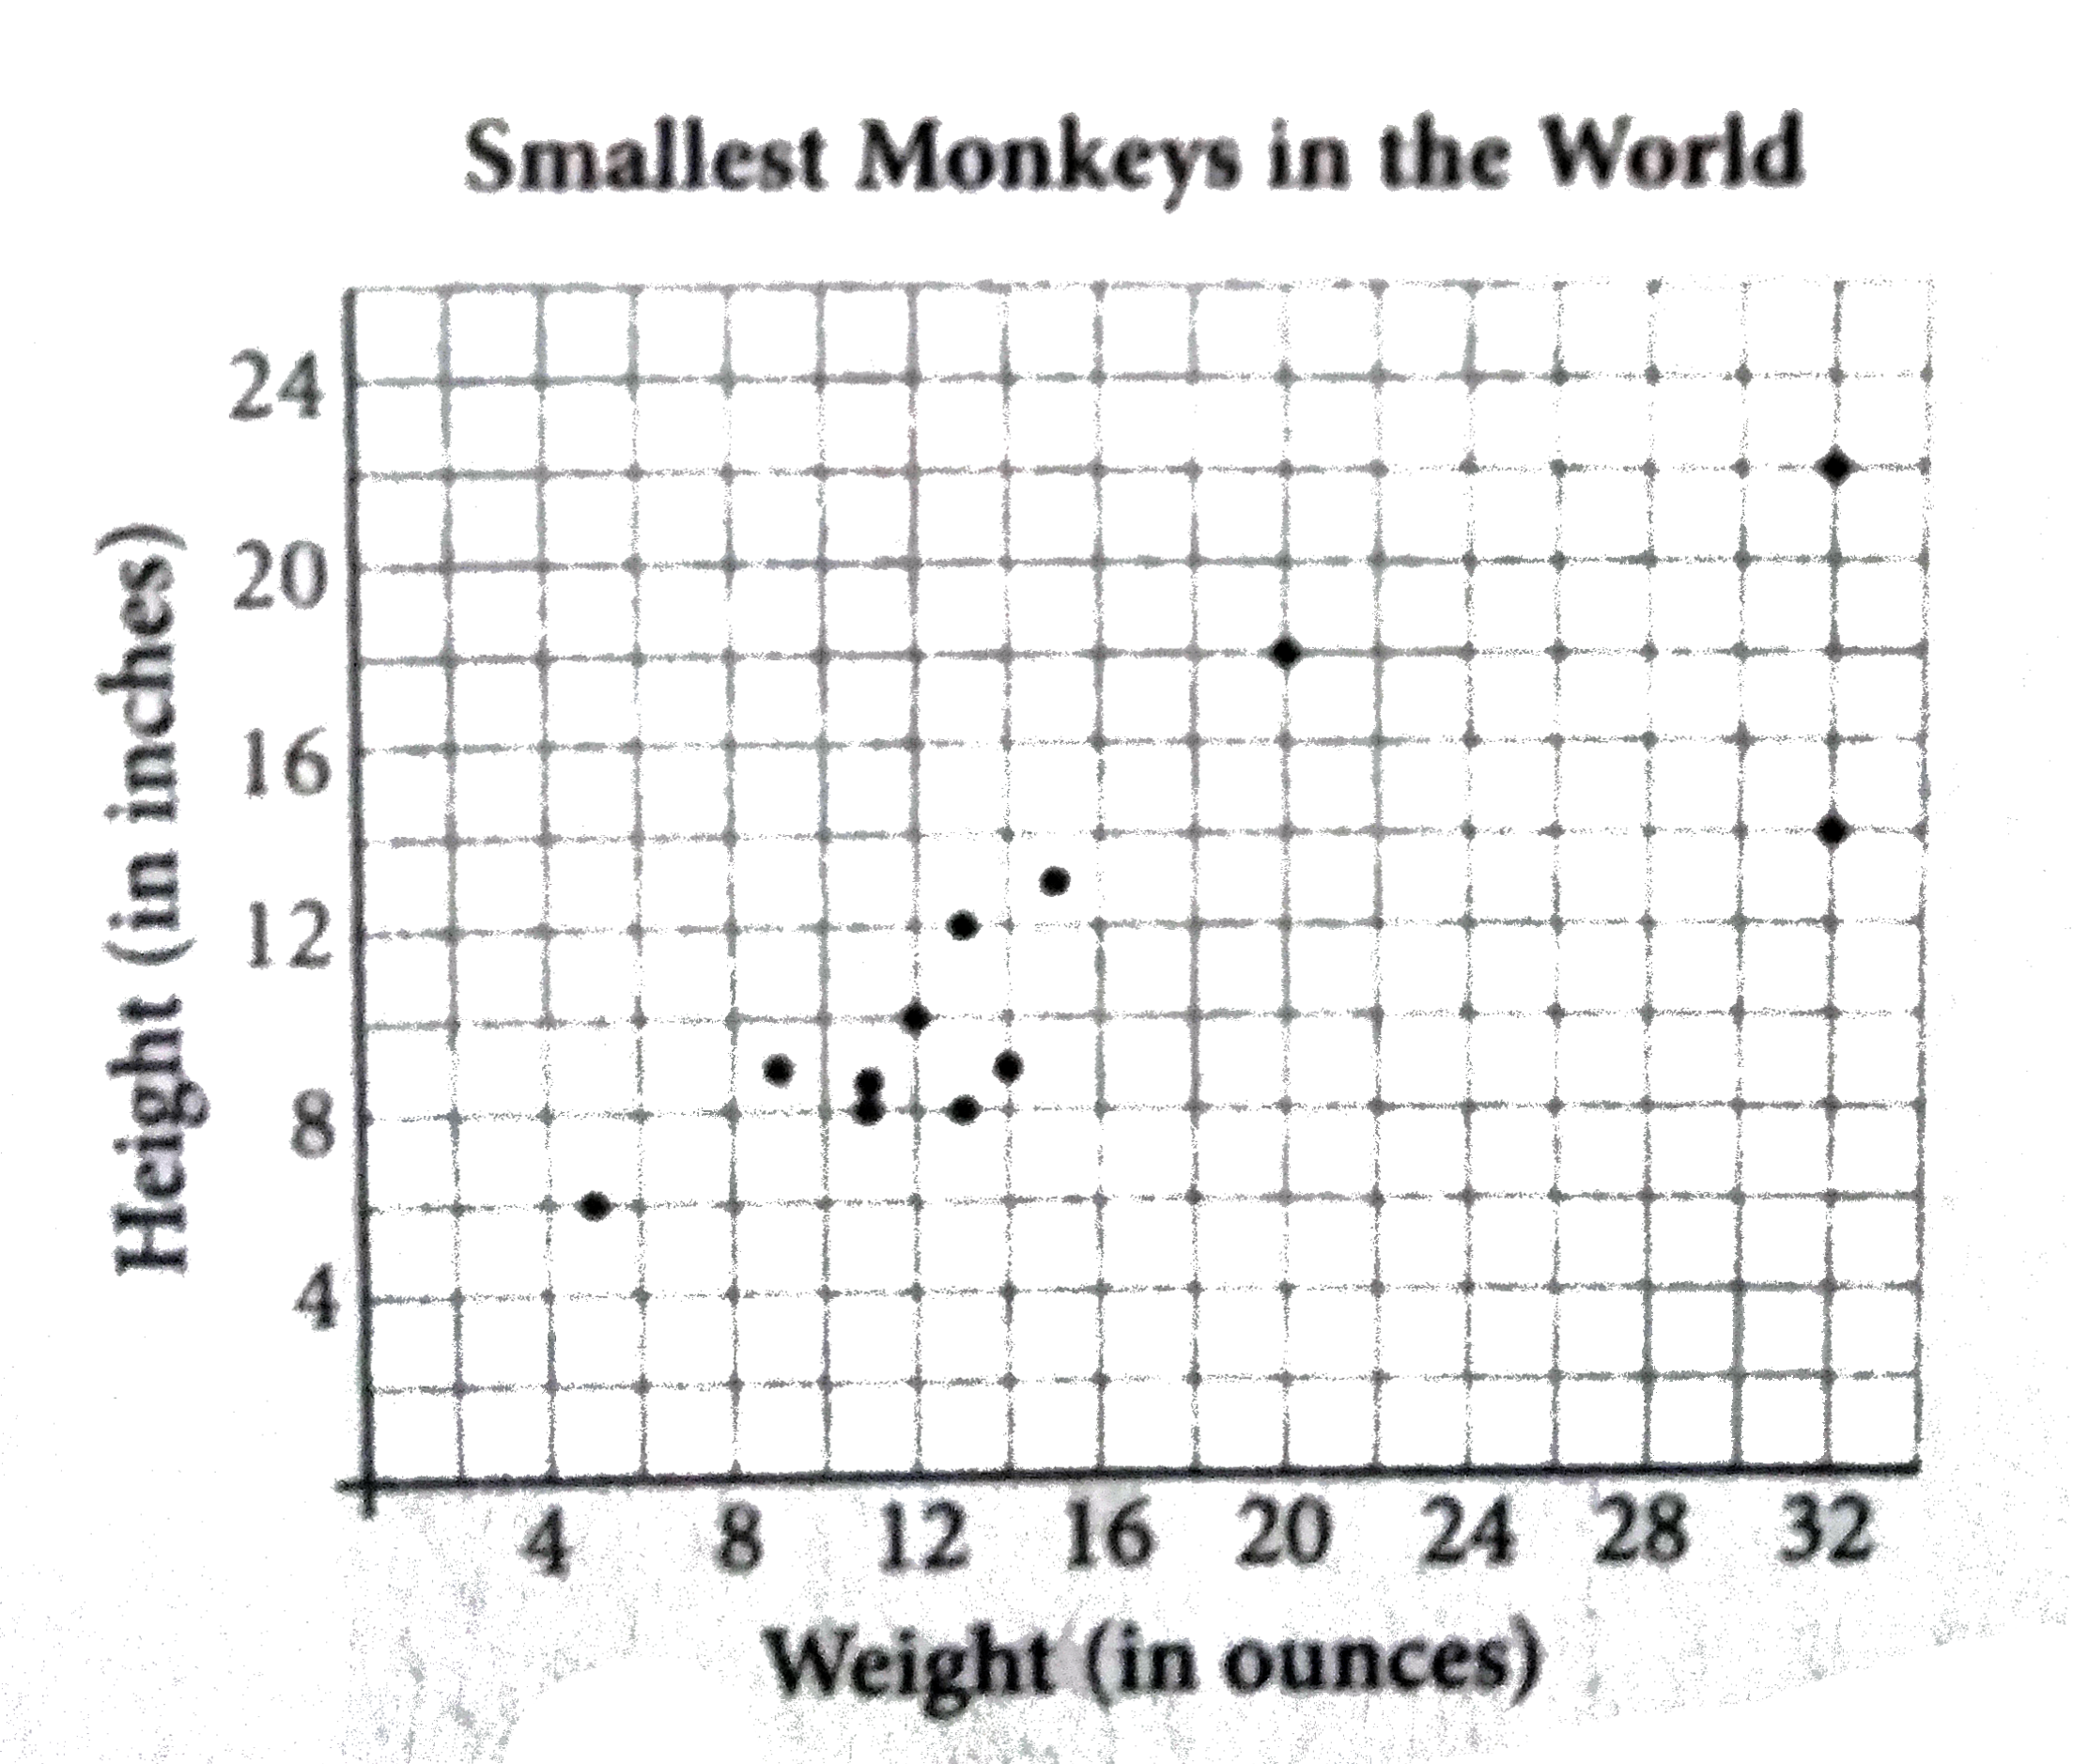
There are more than 250 known species of monkeys in the world. The scatterplot above shows the average height and weight of 12 species of particularly small monkeys, most of the which live in the Amazon Basin of South America. What is the height, in inches, of the monkeys represented by the data point that is farthest from the line of best fit (not shown)?View Solution
Knowledge Check
- Question 1 - Select One
Ten 25- year - old men were asked how many hours per week they exercise and their resting heart rate was taken in beats per minute (BPM). The results are shown as points in the scatterplot below, and the line of best fit is drawn.
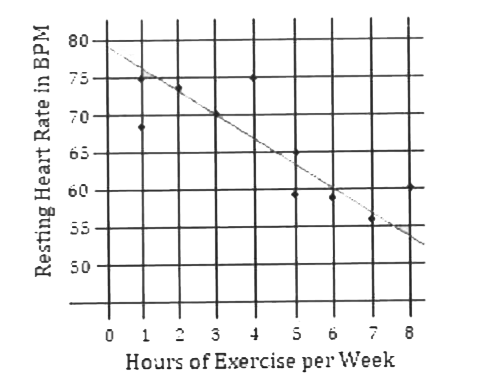
Which of the following is the best interpretation of the slope of the line of best fit in the context of this problem?AThe predicted number of hours that a person must exercise to maintain a resting heat rate of 50 BPM.BThe predicted resting heat rate of a person that does not exercise.CThe predicted decrease in resting heart rate, in BPM, for each one - hour increase in weekly exercise.DThe predicted increase in the number of hours of exercise needed to increase the resting heart rate by one BPM. - Question 2 - Select One
Ten 25- year - old men were asked how many hours per week they exercise and their resting heart rate was taken in beats per minute (BPM). The results are shown as points in the scatterplot below, and the line of best fit is drawn.
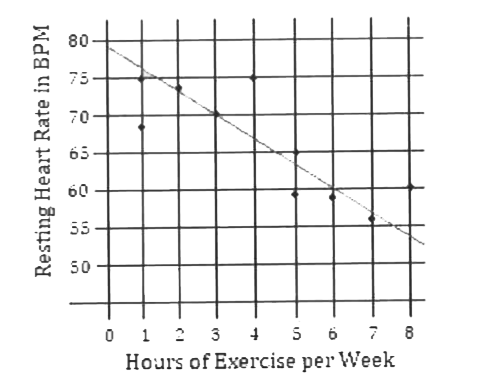
How many of hte men have a resting heart rate that differs by more than 5 BPM from the resting heart rate predicted by the line of best fit?ANoneBTwoCThreeDFour - Question 3 - Select One
Ten 25- year - old men were asked how many hours per week they exercise and their resting heart rate was taken in beats per minute (BPM). The results are shown as points in the scatterplot below, and the line of best fit is drawn.
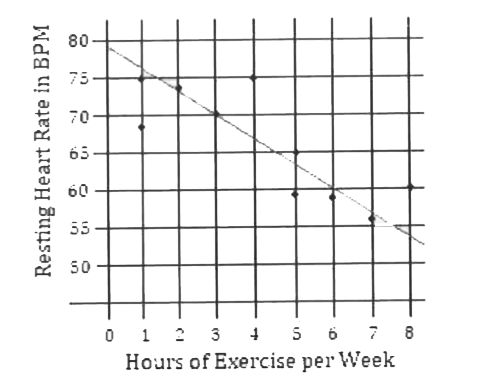
Based on the line of best fit, what is hte predicted resting heart rate for someone that exercises three and a half hours per week?A66 BPMB68 BPMC70 BPMD72 BPM
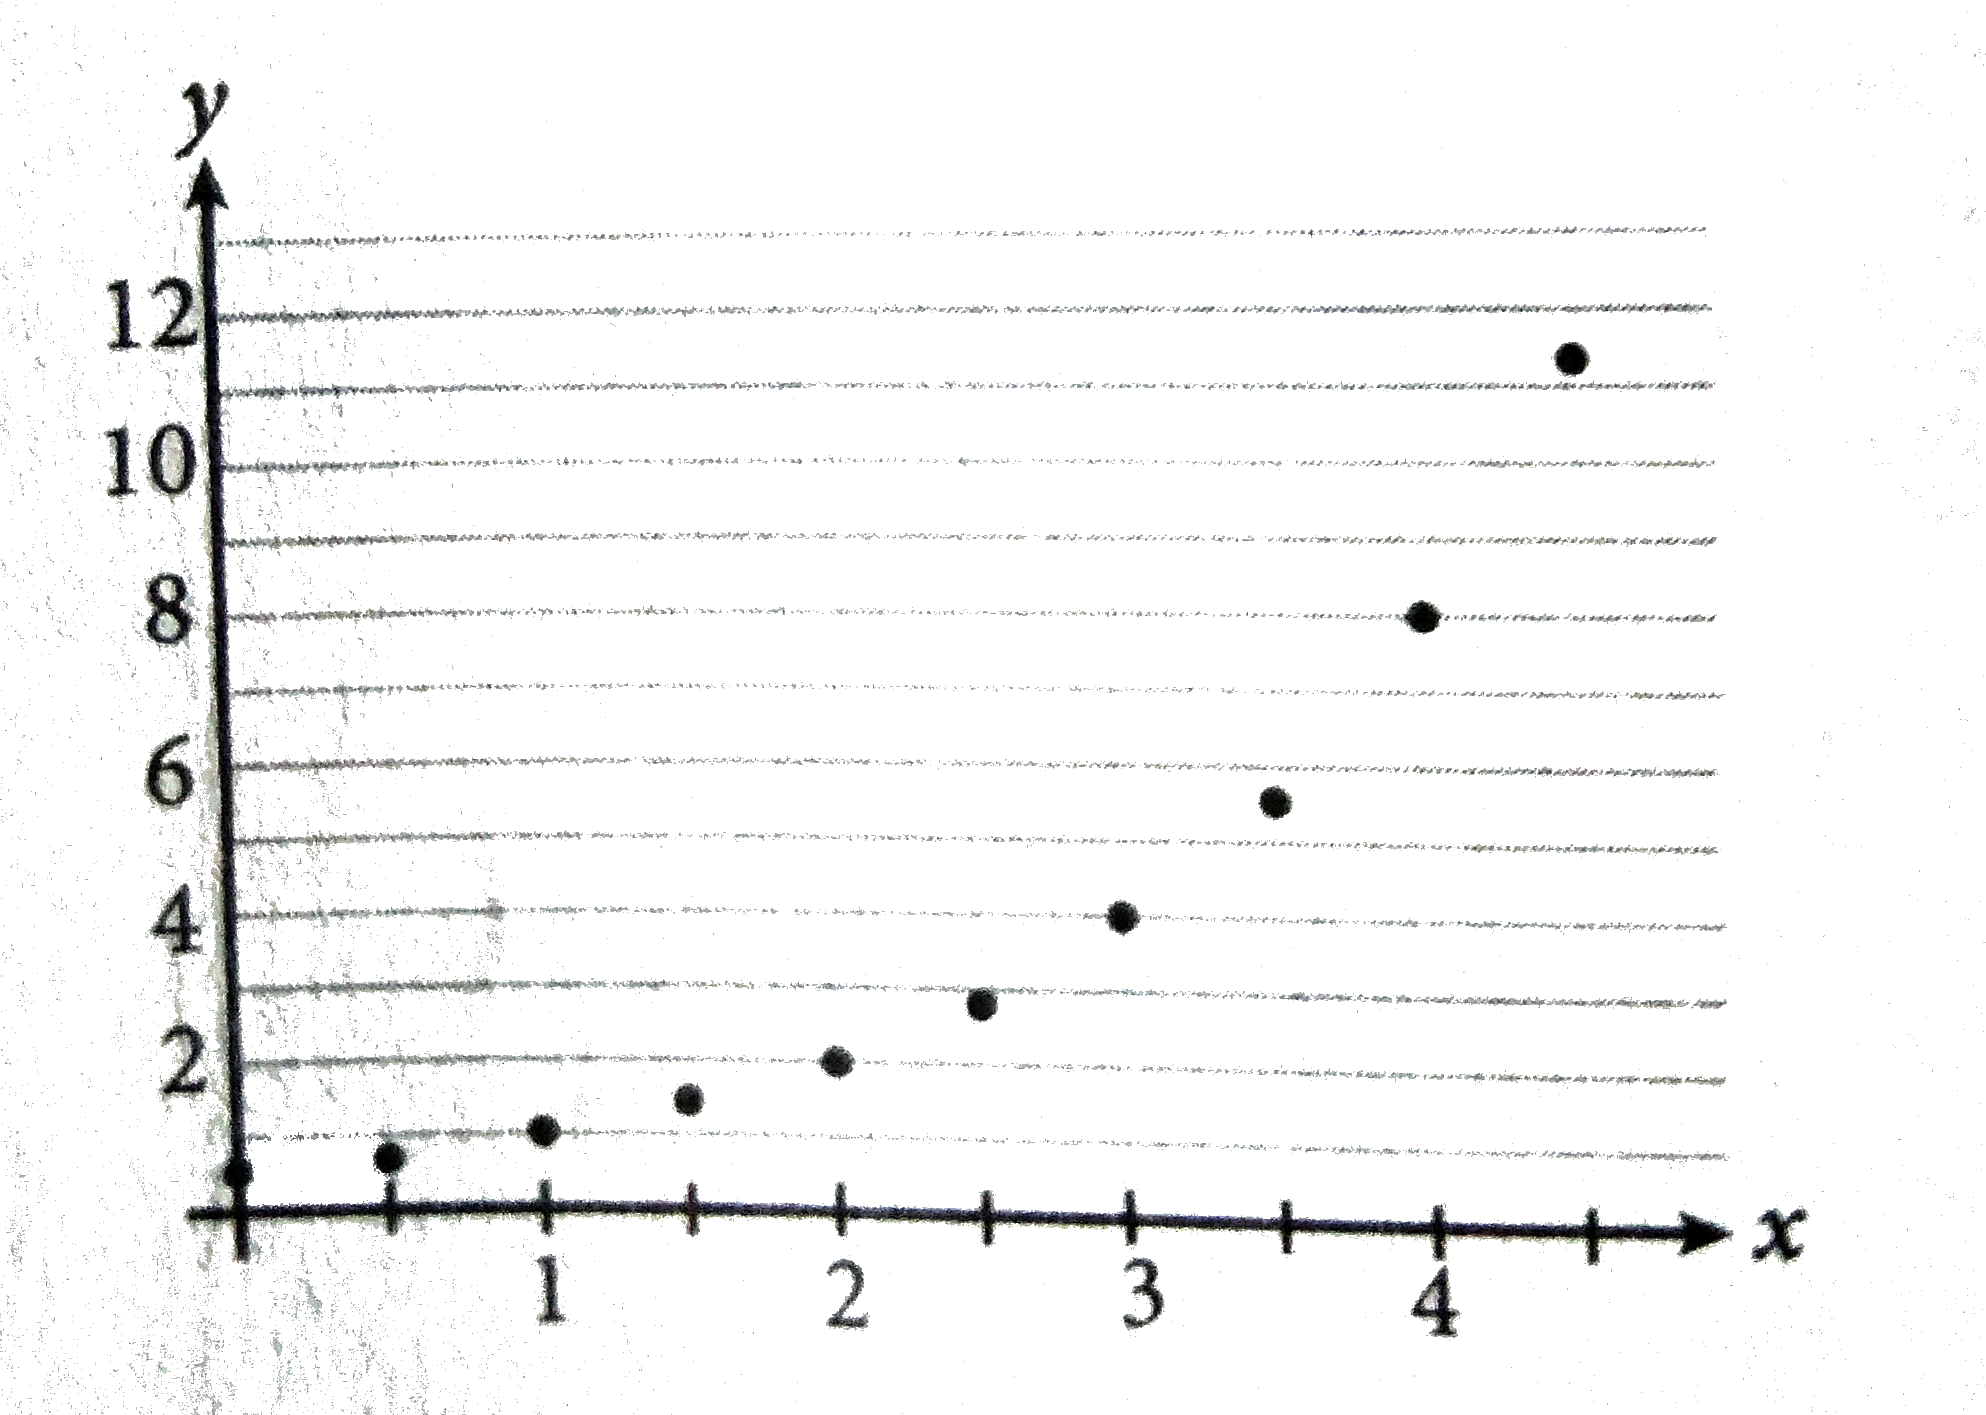
Which of the following equations best models the data shown in the scatterplot above?View Solution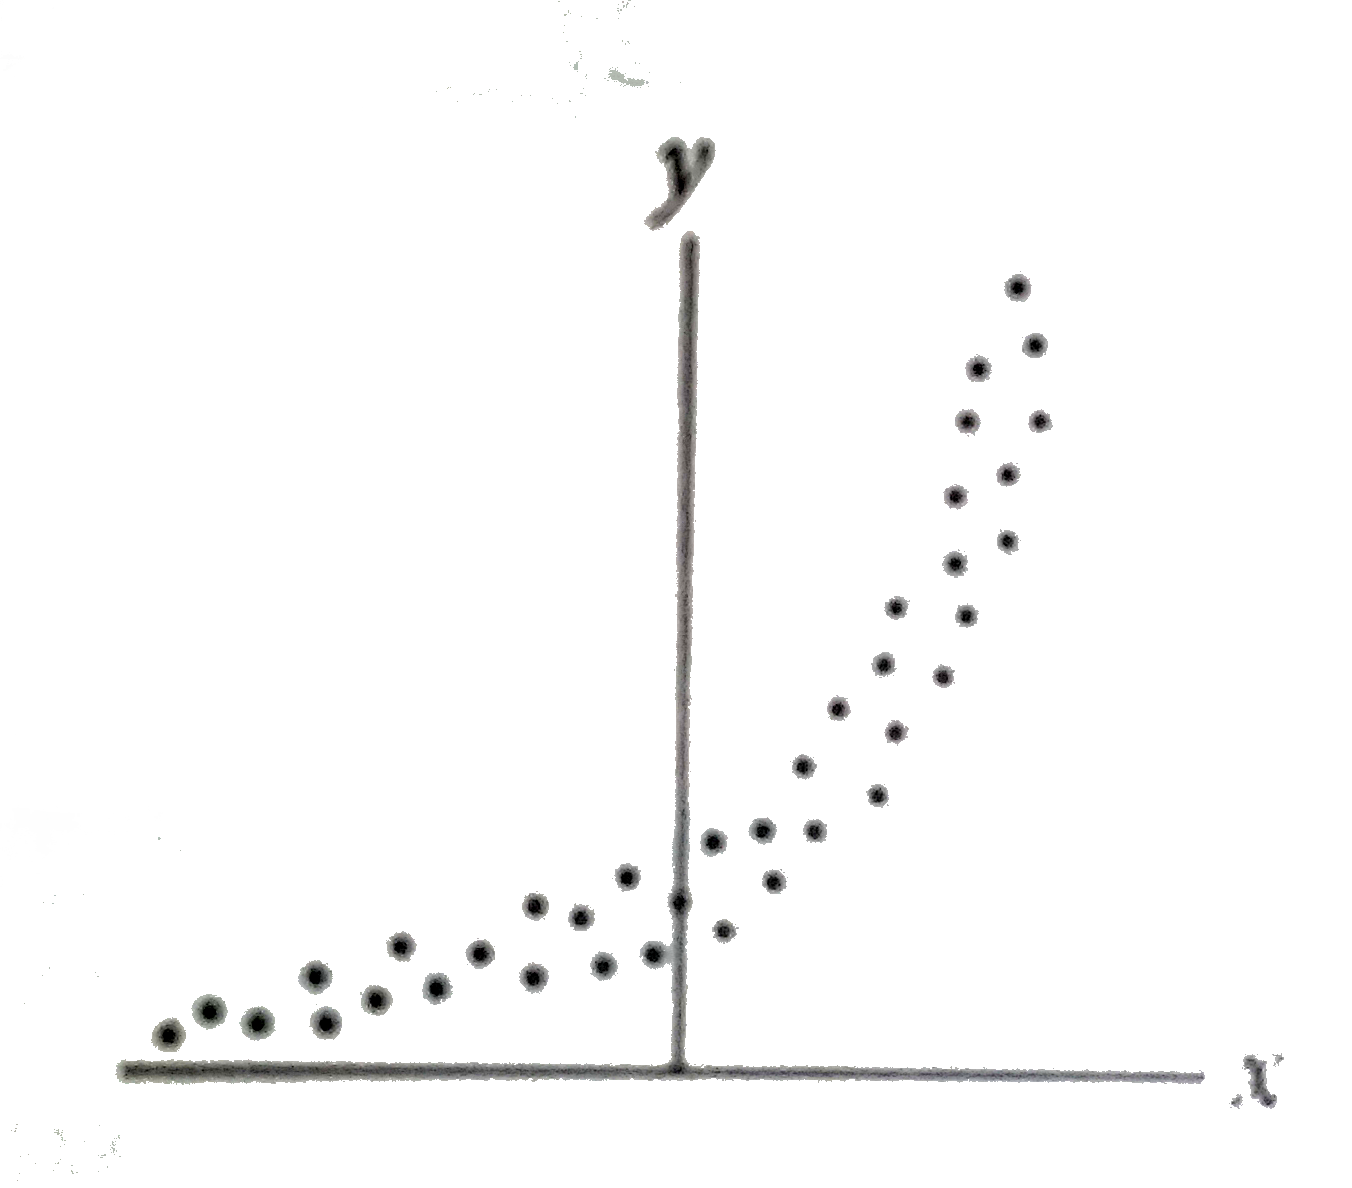
Which of the following best describes the type of association shown in the scatterplot above?View SolutionThe rate of heart beat per minute is highest in case of
View Solution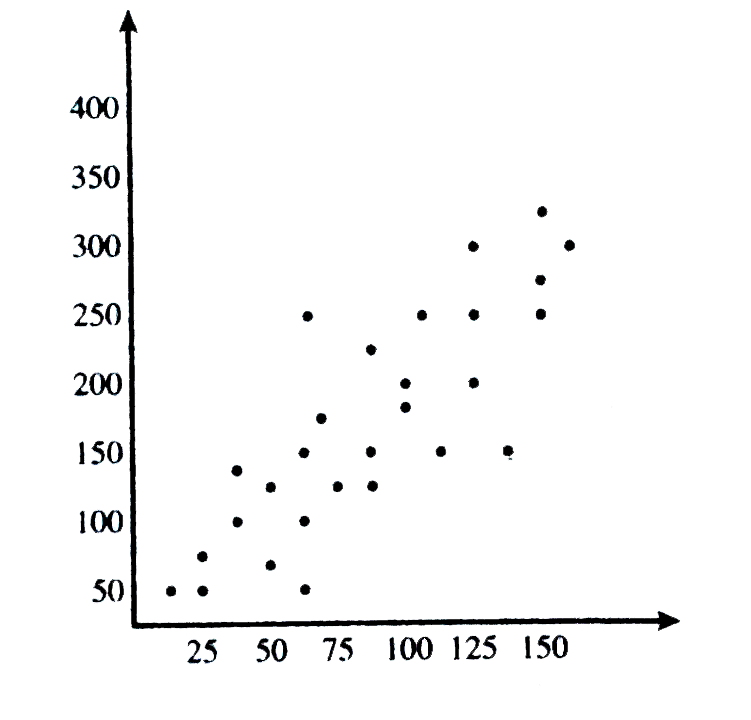
For the scatterplot above , which is closest to the slope of the line of best fit ?View Solution
A physicas professor presented the scatterplot above to her first-year students. What is the significance of the slope of the line of best fit ?View Solution

